1、 BTC volume rebound
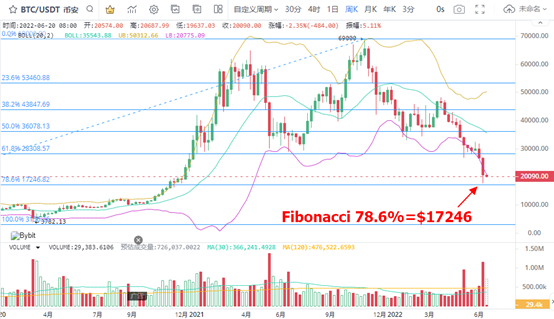
In the past week, BTC prices fell in large quantities, and began to rebound after the lowest price reached US $17622. At the point, Fibonacci's 78.6% corresponding USD 17246 is the technical bottom. The price rise from this bottom is in line with BTC's rebound expectations. In terms of weekly K-line, the lowest closing price of BTC reached USD 20574, and USD 20000 became the support line of important integer points.
From the release effect of selling pressure, BTC volume retreated in the past week, and the trading volume reached a high level in the past two years. Therefore, the possibility of BTC bottoming near 78.6% of Fibonacci in the near future is significantly increased. Due to the obvious downward trend of BTC, there is little possibility of short-term price reversal. But for long-term investors, the low price volatility is already a good opportunity to buy at a low price.
2. BTC gradually approaches the cost price of long-term investors
In terms of decline, BTC showed a strong technical rebound after breaking the position of US $20000. In the 30 minute K-line chart, the btc30 minute increase has reached 6.11% and 5.41%, indicating that the long short balance below US $20000 has undergone subtle changes, stimulating the price decline to narrow quickly.
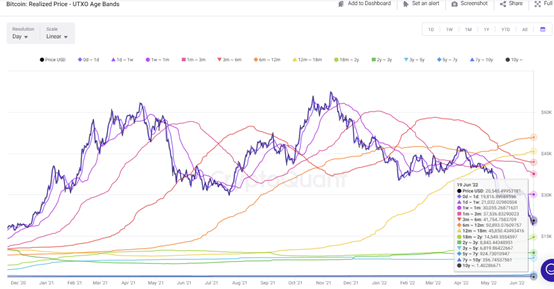
In terms of indicators, in terms of the price performance of BTC, which measures the cost price of investors in different periods, the more important cost price below $20000 is the average holding price of investors with a holding period of 18 to 24 months, reaching $14549 on June 19. The minimum amount of this BTC callback is $17622, with a difference of $3073 from $14549. Therefore, the range from US $15000 to US $17000 at the integer point is very important for long-term investors, or it may become a historical low absorption position.
3. BTC fails to realize loss high-level operation
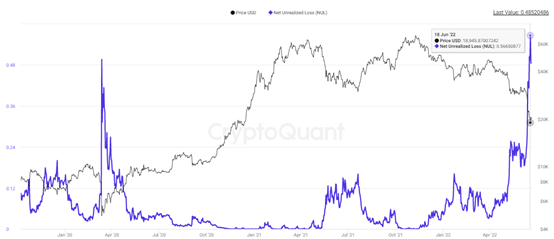
The unrealized loss index of BTC not only reached a high value of 0.566 on June 18, but also maintained a high level in the short term. This indicates that the unrealized loss of BTC has reached a high level. Moreover, with the unrealized loss of BTC and the nupl index remaining at a high level for 4 months, the accumulation of market losses is rising to the highest level in the past years. From this point of view, the market urgently needs a price reversal or a shock of large trading volume to digest the scale of loss. Therefore, the current low absorption opportunity of BTC around USD 20000 can be considered as effective.
4. Eth rebound verification support is effective
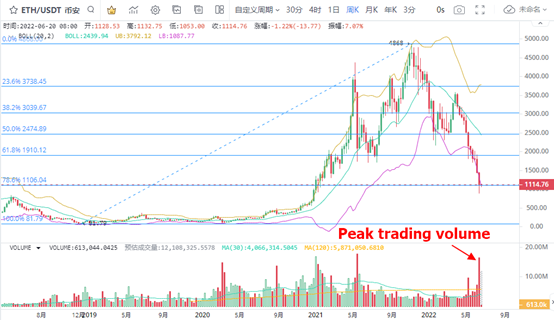
Eth's most important technical support line Fibonacci 78.6% of the corresponding USD 1106 support was confirmed by the rebound. In terms of weekly K-line, ETH hit a minimum of $881, while its closing price was $1128. Based on this judgment, the ETH price has verified that the support of USD 1106 is effective. In terms of weekly trading volume, ETH turnover rate was the highest in the past year. Considering that the performance of eth trading volume in the past year was very low, this volume increase occurred after the sharp decline in prices, and its low volume characteristics were very obvious. Therefore, the buying opportunity of eth around USD 1106 should not be ignored.
5. The trading volume on the ETH chain remains high
The online trading volume of eth has maintained a high level. During the recent price decline, the online trading volume has maintained a high level for one year. Therefore, in the ETH price decline stage, the selling pressure is also released in the trading volume recovery stage. Due to the continuous heavy volume during the decline of eth, judging from the chip distribution, ETH is in the stage of bottom chip growth and price bottoming. Considering that the ETH price has continued the rebound trend with an amplitude of 31% in the past trading day, this low absorption signal is worth paying attention to.