USDT Dominance is a metric that measures the market cap of the stablecoin Tether as a percentage of the total market cap. This metric has risen from 5.7% to 8.13% in just over a week. At the same time, Ethereum and Bitcoin saw severe selling pressure and posted enormous losses within the past week.
The market structure of ETH was bearish at the time of writing, and a move past $1300 would be required to flip bias to bullish. News related to 3AC hinted that further lows can be expected.
ETH- 12-Hour Chart
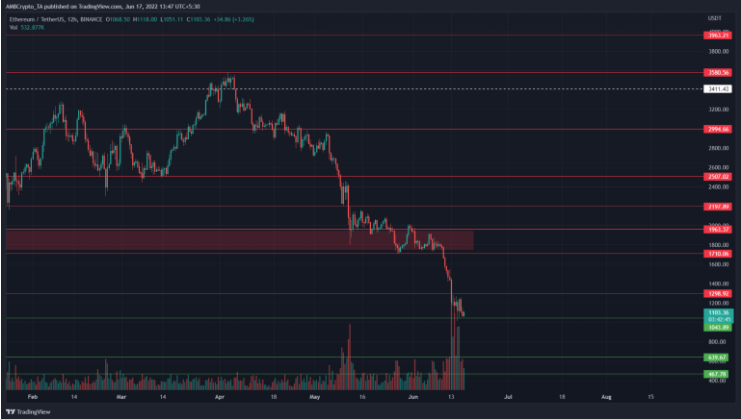
Source: ETH/USDT on TradingView
In February and March, ETH marched upward and made a series of higher lows to suggest an uptrend in play. In late March, the previous higher high at $3250 was broken and ETH was able to test the $3580 resistance level.
The price saw a pullback to the $3000 support level in April. But the sellers were able to seize the initiative by that time. In mid-April, Ethereum fell to $2800 and subsequently retested $3000 as resistance.
The $1850-$1950 area was a demand zone that held out against the selling pressure throughout May. A week into June, this support area began to buckle. In the past week alone, ETH has posted nearly 40% losses.
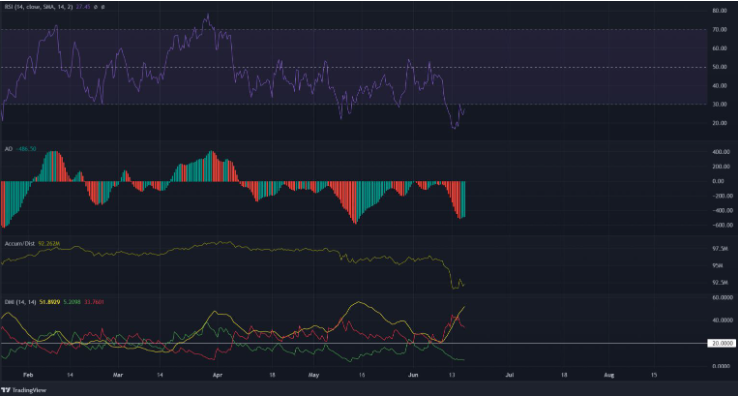
Source: ETH/USDT on TradingView
The indicators unanimously showed bearish momentum and heavy selling pressure. The RSI stood at 27.43 and has been below the neutral 50 line since the beginning of April. This showed that the downtrend has not yet abated. Combined with the drop below the $1950 demand zone, it appeared that further downside could be seen.
The Awesome Oscillator was also well beneath the zero line to signal bearish pressure. The A/D indicator has sunk lower and lower over the past two months and captured the stiff selling volume behind ETH.
The DMI showed an intense bearish trend as well, with both the -DI (red) and the ADX (yellow) both above the 20 mark.
Conclusion
The price action made a series of lower highs on the charts over the past eight weeks. The indicators also showed momentum and volume to favor the sellers. The $1300 mark is one to watch out for in the coming weeks.