Data shows much of the Bitcoin market distribution is the same since January of 2022, when the crypto hit the $33k bottom.
Bitcoin Holders Have Been Unwilling To Spend Amidst Consolidation Since Jan 2022
According to the latest weekly report from Glassnode, the coin price distribution in the BTC market seems to have not changed too drastically since the bottom earlier in the year.
The indicator of interest here is the “realized price distribution,” which shows how the distribution of coins in the Bitcoin market differs based on the price they were last moved at.
The metric functions by looking at the chain history of each coin and noting what the price was when it had been last involved in transactions.
The below chart shows how the realized BTC price distribution looked like on 22 January 2022:
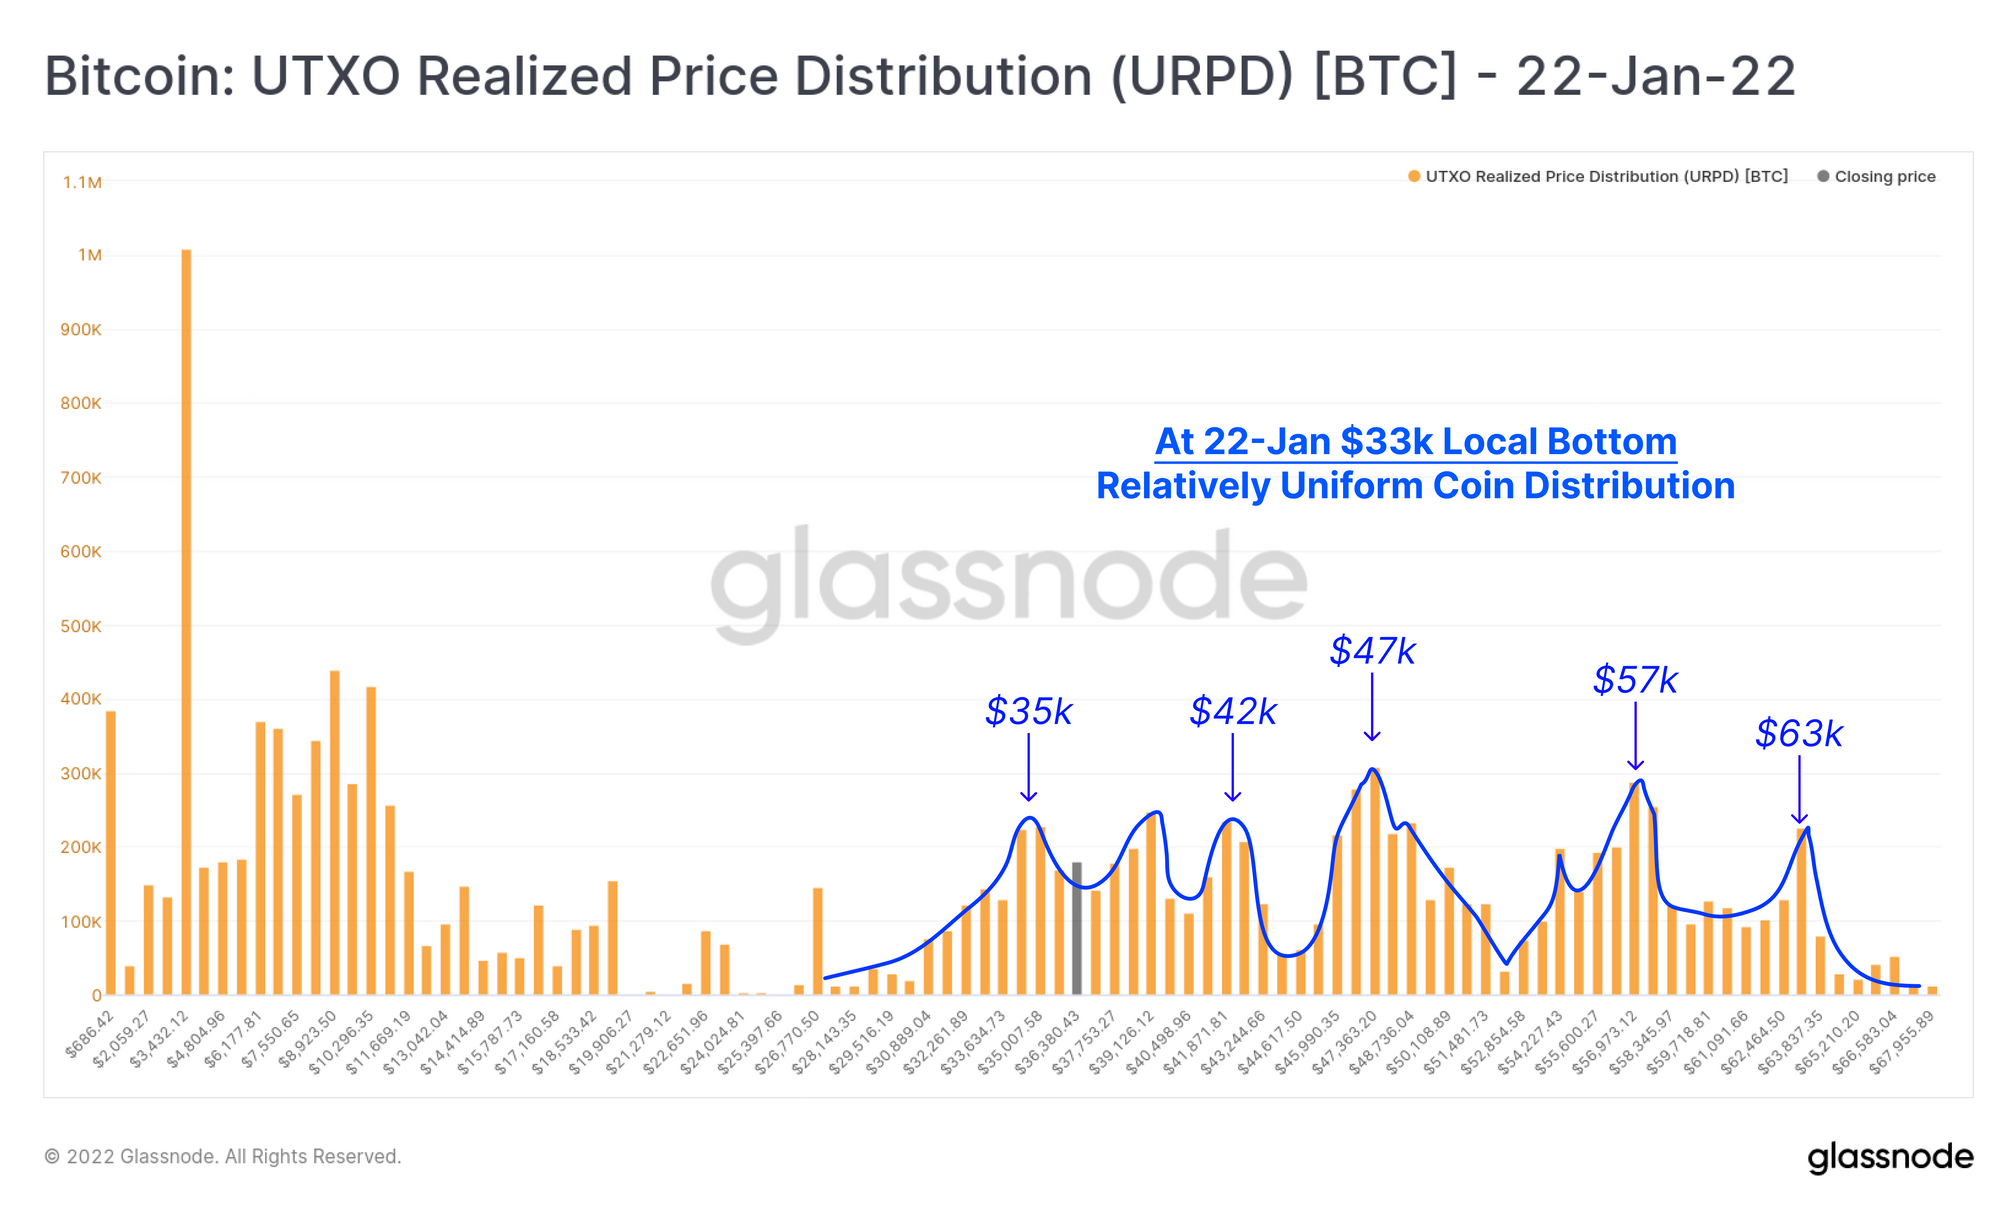
The coin distribution on the day of the $33k bottom | Source: Glassnode's The Week Onchain - Week 16, 2022
As you can see in the above graph, the Bitcoin market on 22 January seemed to have been pretty evenly distributed between the $35k and $63k price ranges.
The report notes that this trend implies there was a pretty consistent demand for BTC both when the crypto was moving up between Aug-Nov, and when it was observing a downtrend during Nov-Jan.
Now, here is a chart that shows how the current realized Bitcoin price distribution compares with the one from back then:
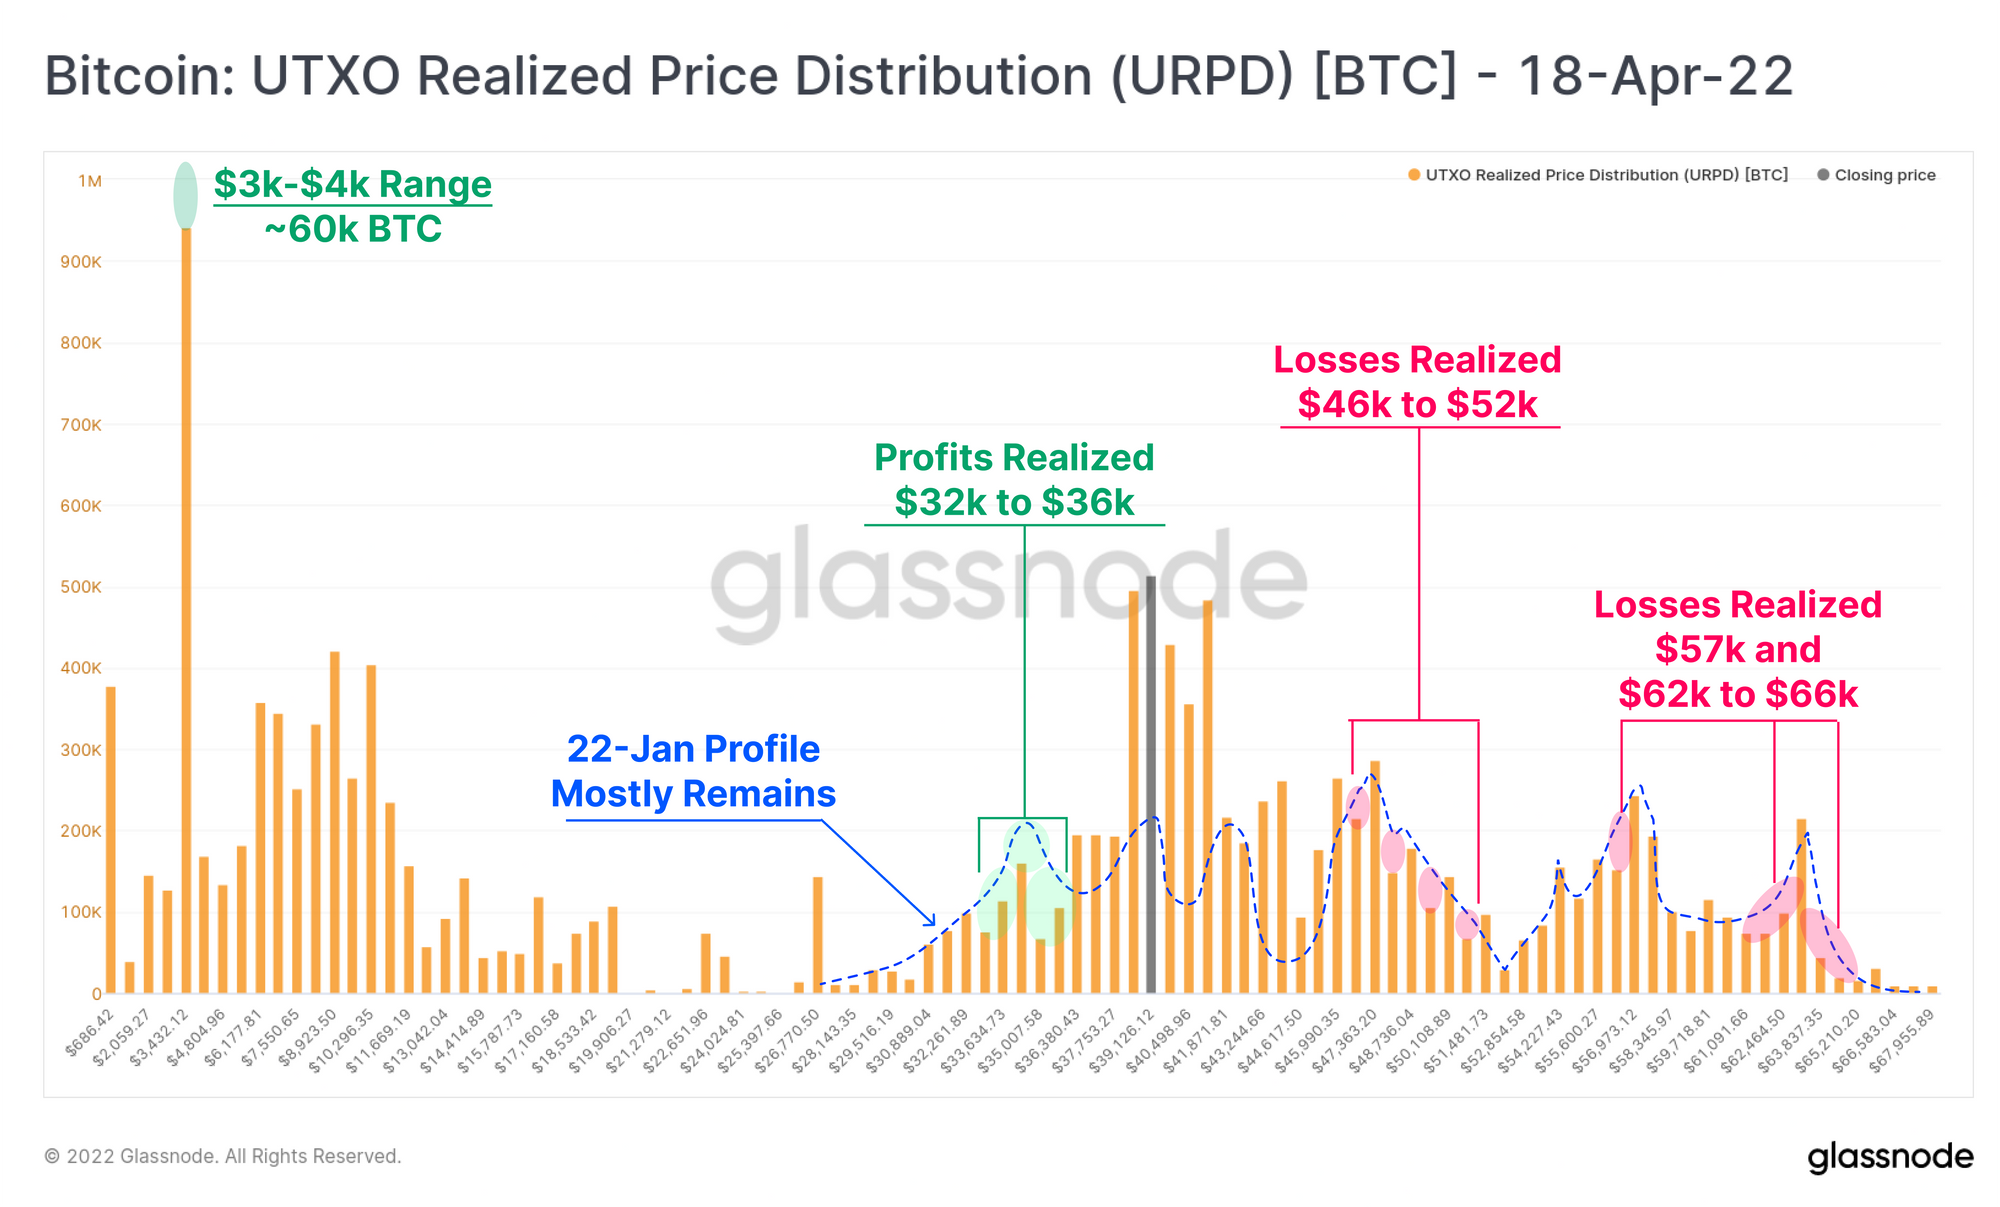
It seems like the $32k to $36k range has realized some profits | Source: Glassnode's The Week Onchain - Week 16, 2022
From this graph it’s apparent that the realized Bitcoin price distribution has been mostly unchanged since earlier in the year.
This means that much of the market has held strong during this period despite many of these holders being in a loss and the price being in a state of consolidation.
The supply ranging between $38k and $45k has amassed a large amount of new coins, a trend that makes sense considering this has been the consolidation range during the period.
There has also been some profit as well as some loss realization since January 2022. The profit realization has mostly come from the $32k to $36k range, implying it was from the dip buyers.
The report suggests that the overall takeaway from this trend is that investors have continued to view the $35k to $42k range as an accumulation zone.
BTC Price
At the time of writing, Bitcoin’s price floats around $42.7k, up 4% in the past week.

Looks like Bitcoin's price has surged up in the last few days | Source: BTCUSD on TradingView