The Solana price had managed to surge over 20% in just over a week, but at the moment, the price remains consolidated. With Bitcoin staying below the $25,000 belt, altcoins have been experiencing congested price action below their immediate price ceilings.
The coin has dropped nearly 3% in the last 24 hours and is now trading below $26. However, the technical outlook for SOL remained optimistic as demand and accumulation were still positive.
As the altcoin managed to break above many resistance levels in the last week, the daily chart is yet to reflect the bearishness. If demand wobbles, SOL might fall through its local support level.
Solana’s price has been trading between $23 and $26, respectively. If the altcoin manages to breach the upper belt of the range, then there could be another rally and a shift to bullish price action. The market capitalization of Solana fell at the time of writing, which reflected that sellers had become more active.
Solana Price Analysis: One-Day Chart
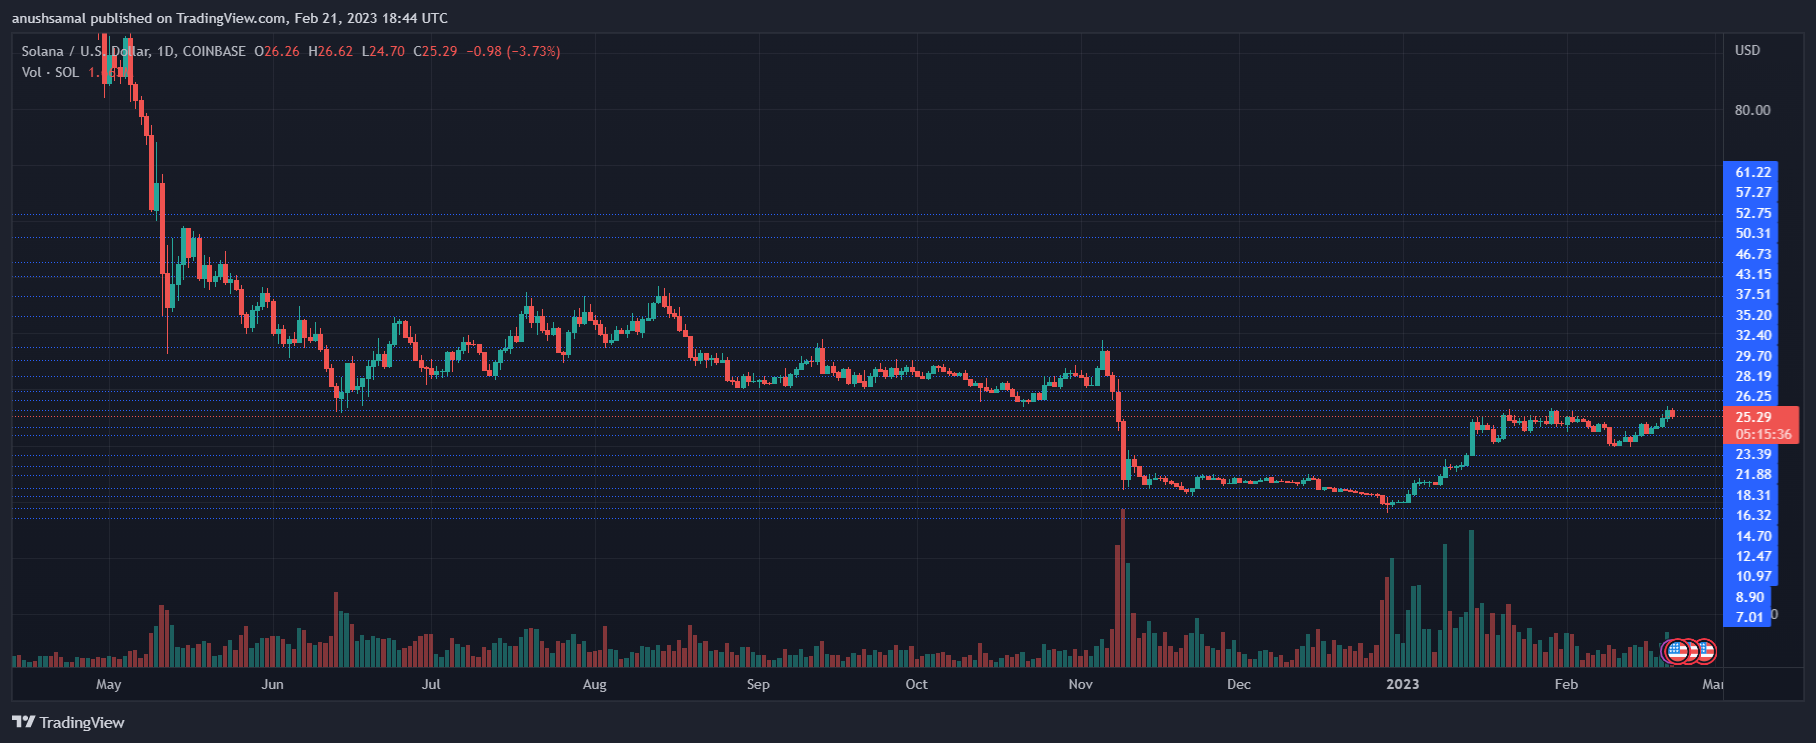
SOL was trading at $25.29 at the time of writing. It was trading relatively close to $26, the present overhead ceiling. Demand for SOL needs another push for the price to break past the $26 level.
If SOL manages to move above that level, then the altcoin might attempt to trade near $29 before it starts correcting.
Conversely, if buyers don’t exert pressure, Solana might fall to $23 and then to $21. The amount of Solana traded in the last session was high, meaning the coin experienced selling strength.
Technical Analysis
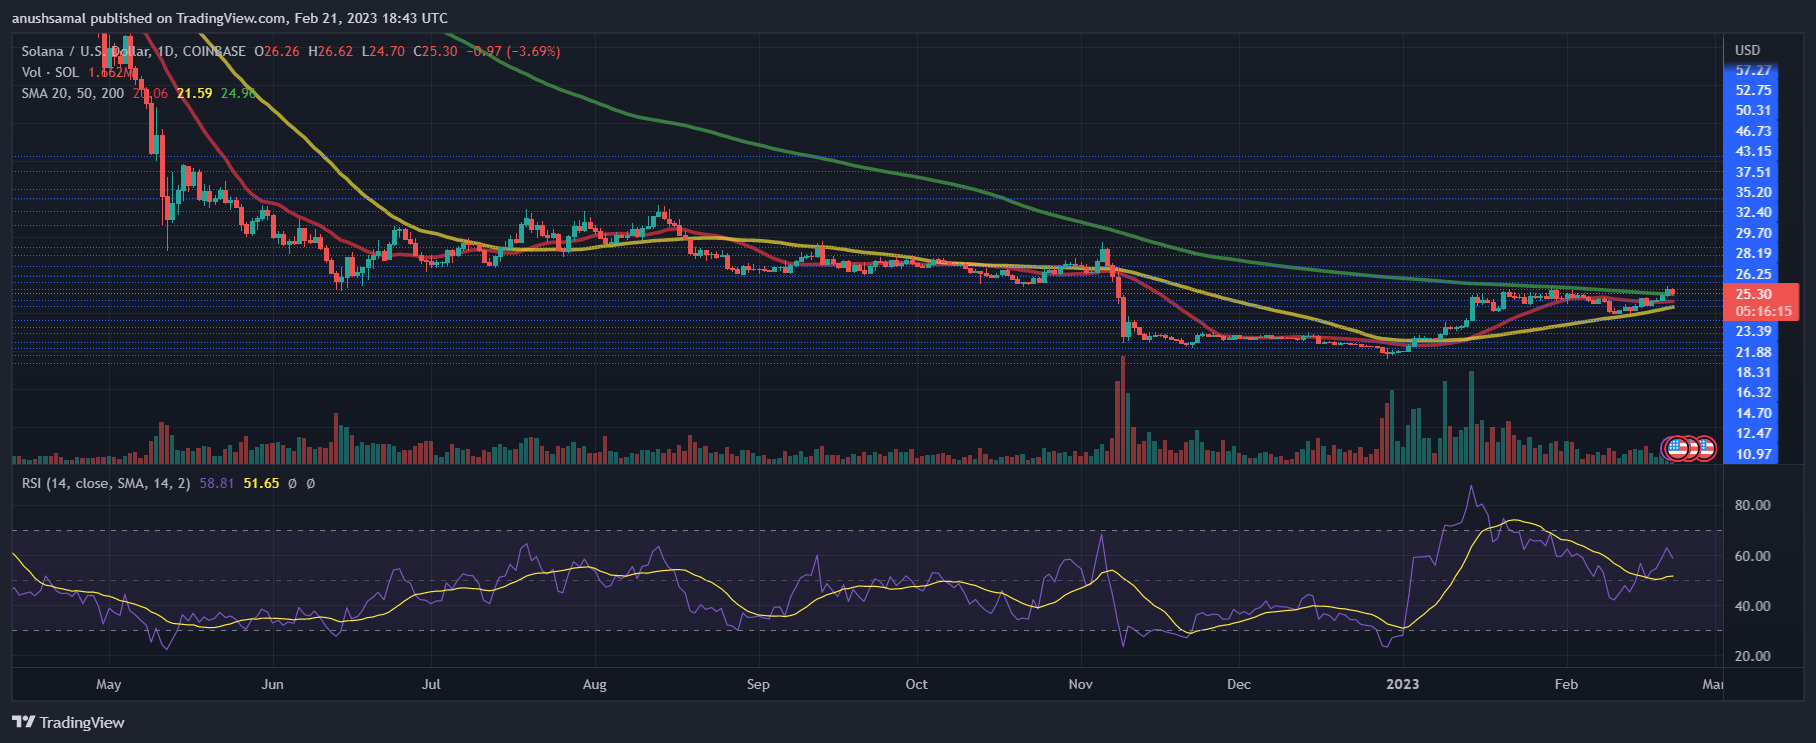
The altcoin recovered on the chart, and so did its buying strength, but as SOL lost momentum in the last 24 hours, buying strength dipped slightly. The Relative Strength Index noted a downtick, despite the indicator being above the 60 mark.
This reading indicated that even though buying pressure fell, buyers overpowered sellers. The Solana price was also above the 20-Simple Moving Average line (SMA), meaning buyers were driving the price momentum in the market.
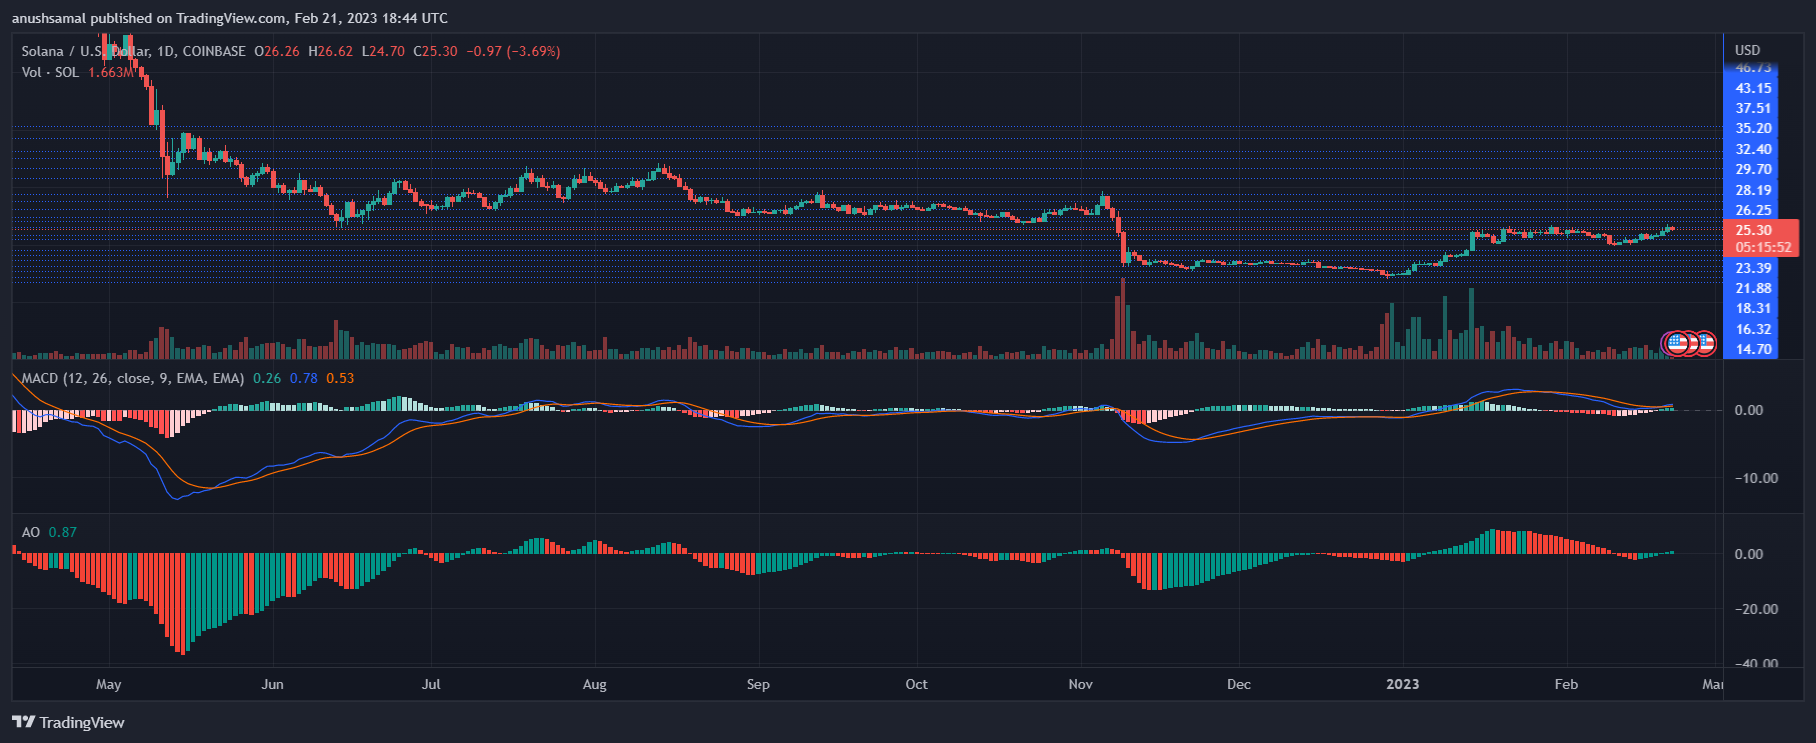
Despite a fall in value, SOL continued to depict buy signals on the one-day chart. The Moving Average Convergence Divergence indicates price momentum and a change in trend. The indicator formed green histograms tied to buy signals.
Buy signals usually indicate an increase in price over the next trading session. The Awesome Oscillator also reads the price trend.
The indicator formed green signal bars above the half-line, which signified bullish movement. Although SOL continues to look cheerful, the inability to cross the overhead resistance will cause a setback to the altcoin’s price movement.