Динамика цены XRP за последние несколько дней была напряженной и неуверенной, что заставляет трейдеров нервничать. Сейчас XRP движется в боковом тренде чуть ниже $2, сужаясь в диапазоне между $1,9 и $1,96. Для некоторых это выглядит как слабость.
Для других это выглядит так, будто нарастает восходящее давление. Один технический аналитик считает, что движение цены XRP приближается к моменту, который может переопределить всю структуру. Эту точку зрения в X разделил криптоаналитик Арчи, отметивший, что текущая консолидация является предвестником резкого пробоя, который отправит цену к новым историческим максимумам.
Почему важна текущая структура XRP
Согласно рассматриваемому техническому анализу, XRP формирует сужающуюся модель непосредственно под нисходящей линией тренда, которая выступала в качестве сопротивления с начала года. XRP показал более высокий максимум в $2,4 в начале января, откатился и затем начал сжиматься в узкий диапазон более низких максимумов на 30-минутном свечном графике.
На графике видно, как токен неоднократно уважал линию тренда, не падая ниже поддержки на уровне $1,9. Это, в свою очередь, создало то, что Арчи описывает как «катушку» прямо под линией сопротивления. Интересно, что такая структура обычно быстро разрешается, как только цена снова касается линии тренда.
Пробитие линии тренда и движение выше $2
Согласно прогнозу аналитика, следующее касание линии тренда не будет очередным отскоком. Вместо этого следующее касание приведет к чистому пробитию, которое решительно отправит XRP выше $2, что является чуть больше, чем контрольной точкой. С его точки зрения, многократные тесты сопротивления ослабили его, увеличивая вероятность пробоя, а не очередного нисходящего отскока.
На момент написания статьи альткоин торгуется на уровне $1,91, потеряв 2,6% за последние 24 часа. Однако при внимательном рассмотрении графика, которым поделился Арчи, становится понятна структура того, чего ожидать после пробития линии тренда.
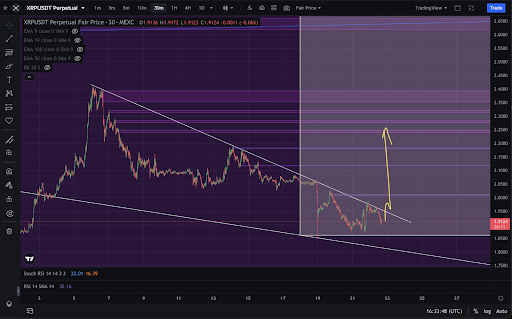
Первый уровень находится чуть выше самой нисходящей линии тренда, в районе $2,00–$2,05. В контексте графика чистый проход через этот уровень — это то, что превращает структуру из сжатия ниже сопротивления в расширение выше сопротивления.
Выше этого следующая отмеченная зона сопротивления находится чуть ниже $2,20. На графике затем показана более широкая кластерная зона сопротивления примерно между $2,35 и $2,40. Достижение и пробитие этой зоны гораздо более значимо, так как это покажет, что пробой является подлинным разворотом тренда.
На верхней границе проекции самая высокая отмеченная область находится около $2,60. Эта зона, по-видимому, является конечной восходящей целью, показанной на графике, и прочно поместит XRP на территорию price discovery (поиска цены) относительно недавней структуры.