Worldcoin [WLD] показал сильное бычье движение в понедельник, 23 марта. Покупатели защитили поддержку на уровне $0,3075 от 6 февраля и вызвали отскок на 8,46% от дневного минимума в $0,3039.
Достигнув $0,3296, WLD отступил и на момент написания торговался на уровне $0,3175. Сможет ли альткоин набрать обороты для следующего ралли, или трейдерам стоит ожидать дальнейших потерь?
Worldcoin падает ниже локальной поддержки $0,345
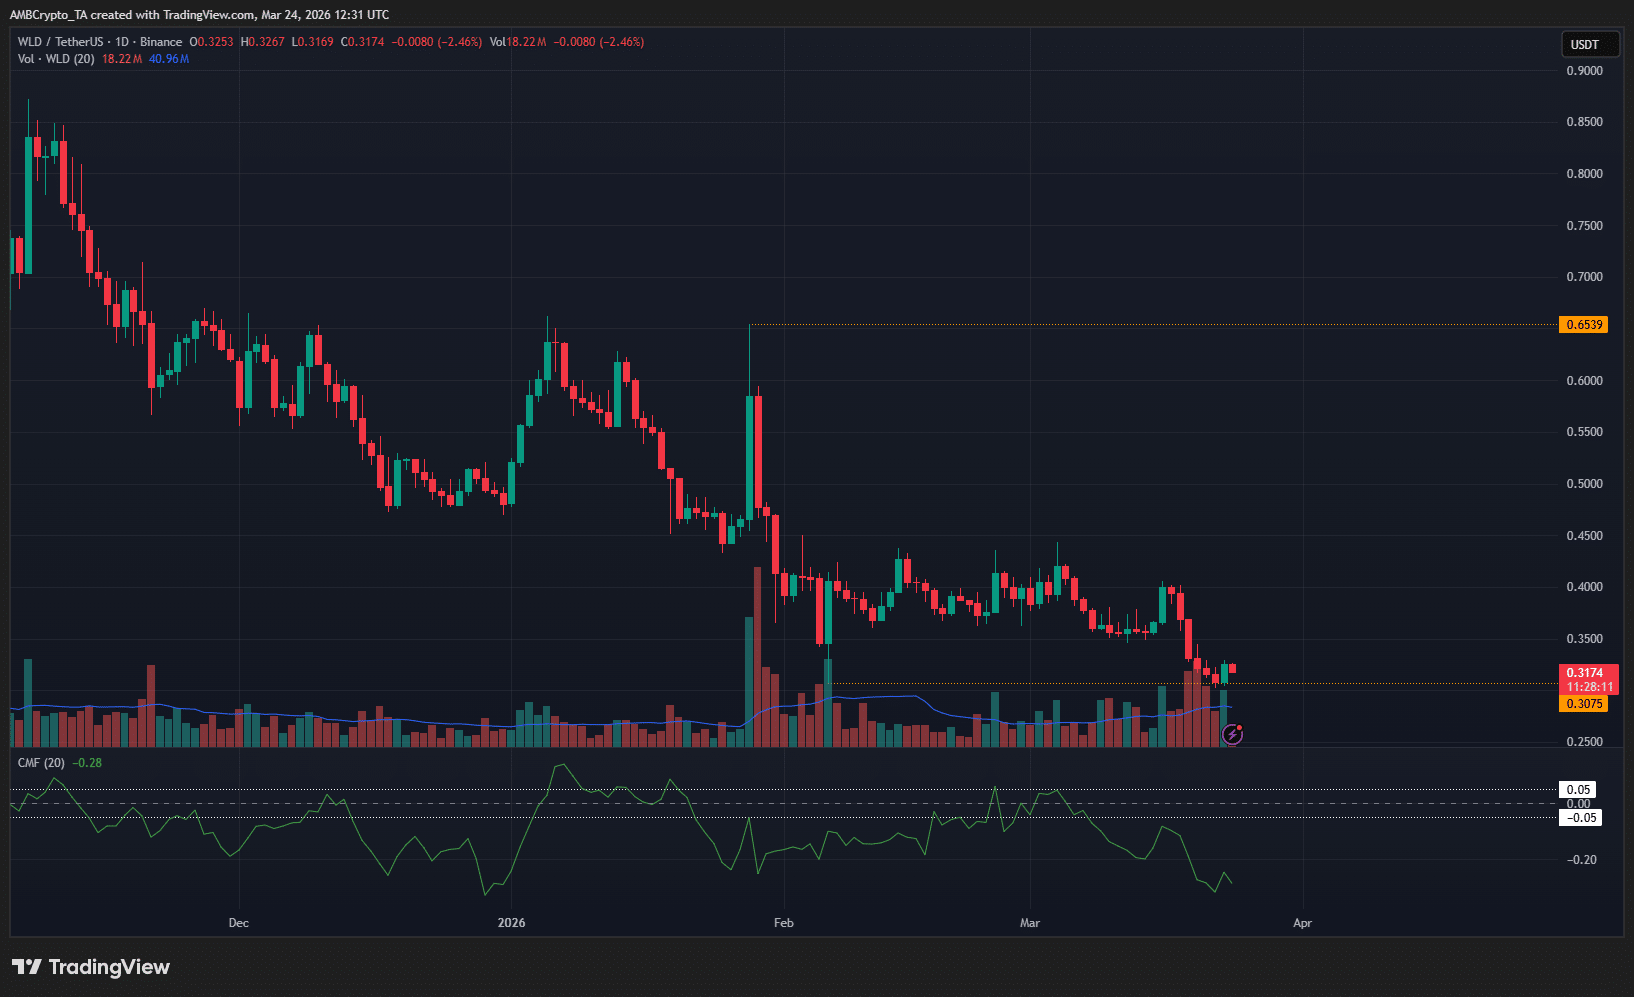

Долгосрочный тренд Worldcoin был однозначно медвежьим. Если считать от цены открытия в день краха 10/10, WLD потерял 73,57% своей стоимости менее чем за шесть месяцев.
Само по себе это не было чем-то необычным. Многие альткоины имеют схожие и даже более серьезные потери. Однако некоторые альткоины также смогли продемонстрировать краткосрочную бычью силу в марте.
Возвращение Bitcoin [BTC] выше отметки в $70 тыс. дало некоторым альткоинам импульс для отскока вверх и разворота их краткосрочных трендов в бычью сторону. Worldcoin к ним не относился.
Вместо этого WLD обновил минимумы на дневном графике. Локальная поддержка $0,345 от февраля была пробита, и падение цены временно остановилось на экстремумах краха начала февраля.
Призыв к действию для трейдеров — продавать на отскоке
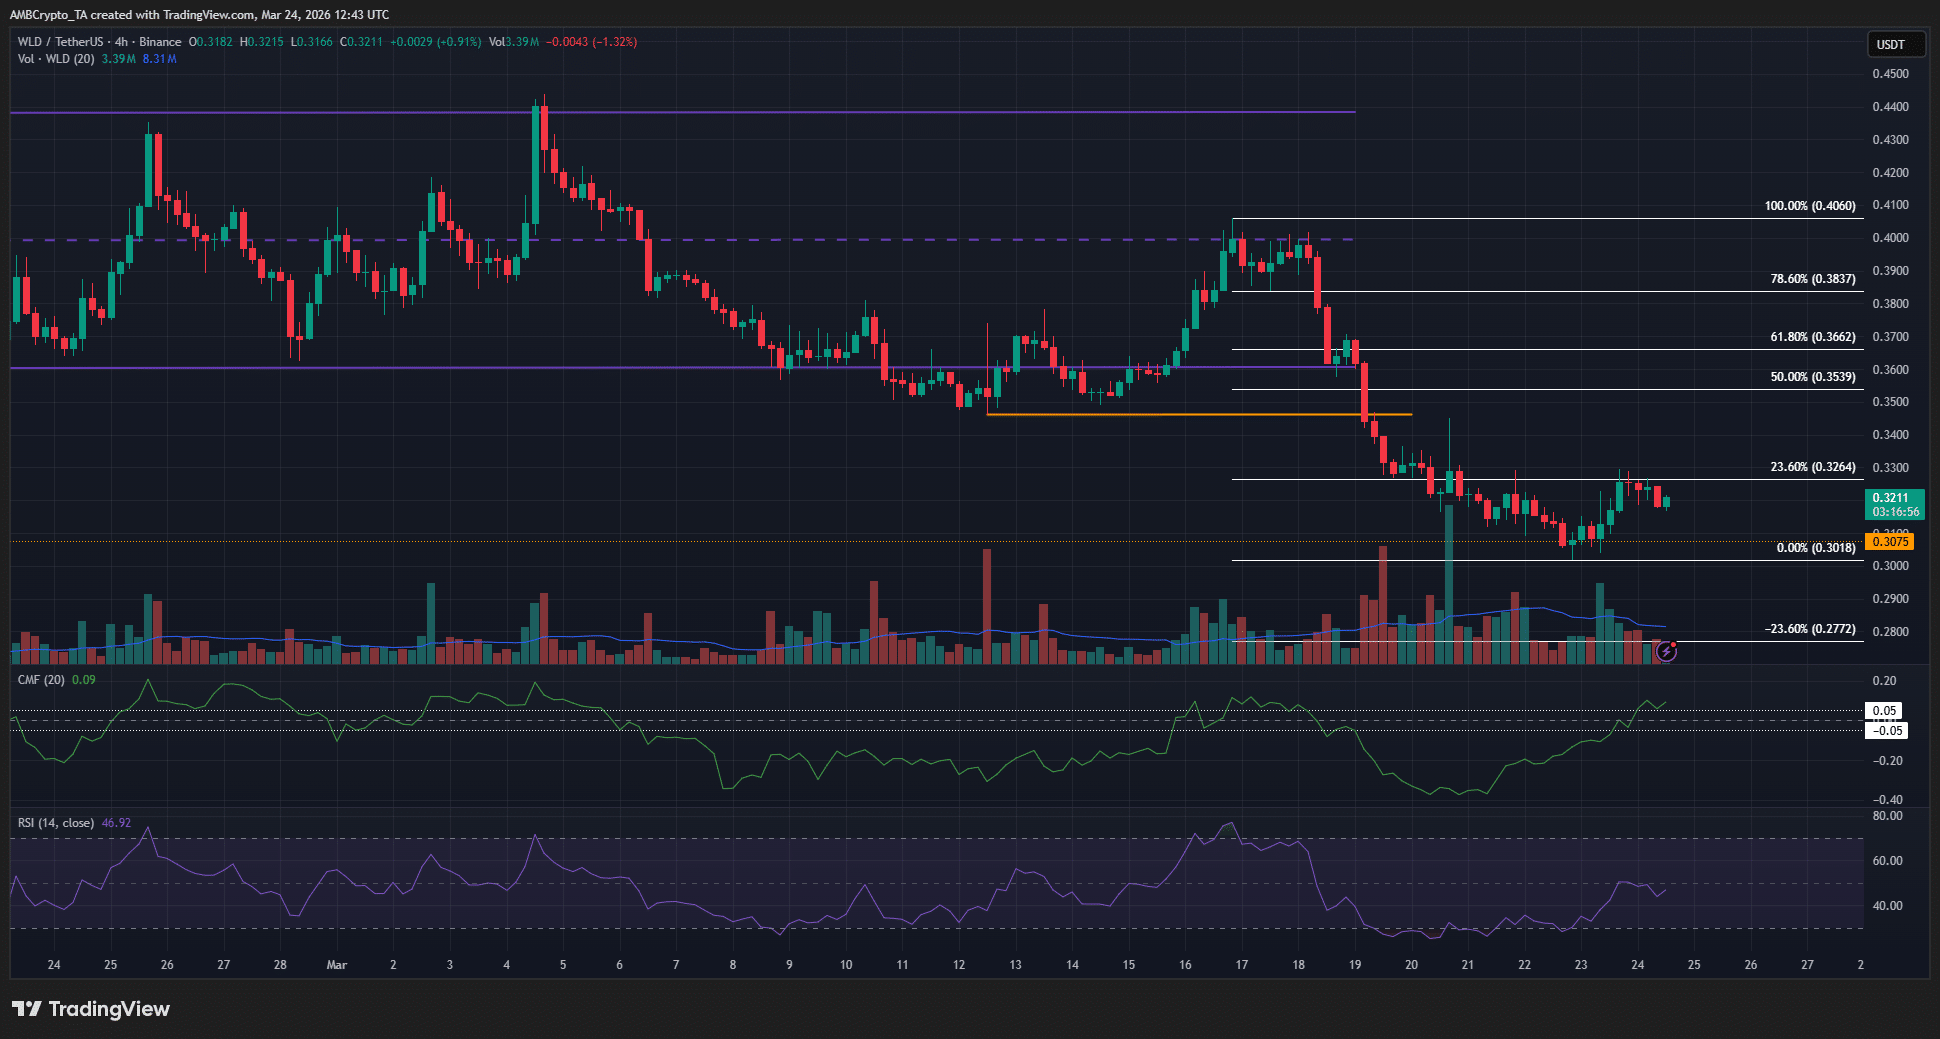

На 4-часовом графике наблюдалась медвежья структура свингов для Worldcoin. Этот медвежий разворот произошел 19 марта, когда WLD упал ниже свингового минимума на уровне $0,346.
Это импульсное движение вниз было использовано для построения уровней Фибоначчи (белые). На момент написания уровень 23,6% коррекции на отметке $0,326 выступал в качестве сопротивления.
Если он будет превращен в сопротивление, трейдеры могут ожидать роста WLD до «золотого кармана» в зоне $0,354-$0,366.
Индекс RSI находился чуть ниже нейтральной отметки 50, а индикатор CMF смог подняться выше +0,05, что указывает на сильный приток капитала. Если спрос и импульс сохранятся, Worldcoin может отскочить выше.
Однако трейдерам следует помнить о долгосрочном тренде WLD и использовать ценовой отскок к $0,366 для продажи альткоина.
Если ралли сможет пробиться выше локального максимума на уровне $0,406, свинговая структура развернется в бычью сторону и аннулирует текущее медвежье смещение.
Итоговый вывод
- Долгосрочный тренд Worldcoin, как и у Bitcoin и многих альткоинов, был медвежьим, но WLD проявил относительную слабость в последние дни.
- Эта слабость привела к медвежьему структурному сдвигу на 4-часовом графике, и трейдеры могут подождать, чтобы продать на отскоке.


