С момента отскока от региона в $60 тысяч в начале февраля, Биткоин вошел в фазу боковой консолидации. Как было описано в Неделе 06 – Структурная слабость, этот хрупкий диапазон отражает временное равновесие между истощением продавцов и локализованной поддержкой со стороны долгосрочных держателей, которые накапливали монеты в том же ценовом диапазоне в первом полугодии 2024 года.
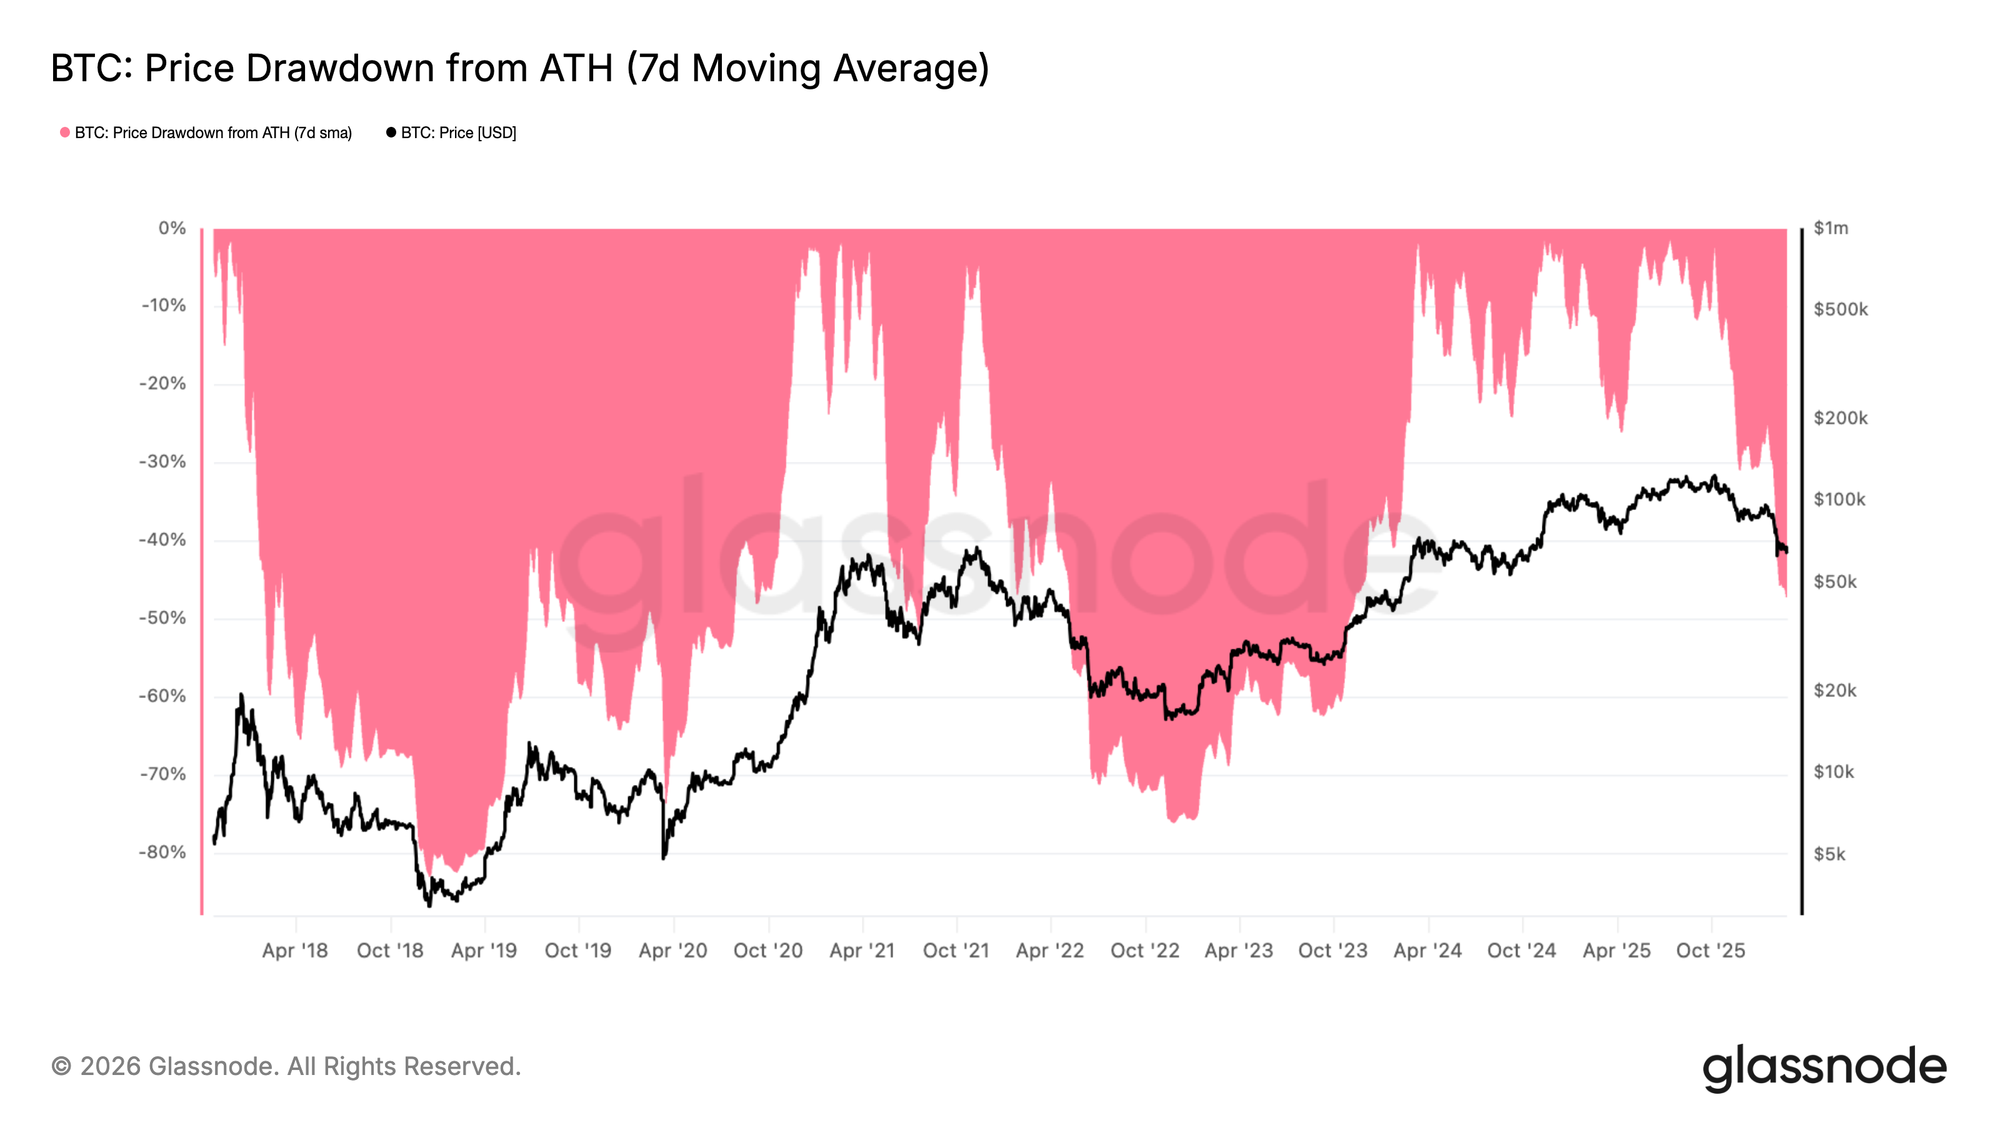
С более широкой циклической перспективы, 7-дневное скользящее среднее просадки от исторического максимума (ATH) в настоящее время составляет 47,3%, что сопоставимо с фазой ограниченного диапазона в начале мая 2022 года, которая предшествовала дальнейшему расширению нисходящего движения. Исторические аналогии предполагают, что при аналогичной глубине просадки время обычно действует как препятствие, а не как стимул для бычьего продолжения. Затяжное сжатие на этих уровнях увеличивает вероятность того, что leveraged или структурно слабые entities столкнутся с растущим стрессом балансовых отчетов.
При отсутствии решительного отвоевания более высоких ценовых уровней (>$70k) в ближайшие недели, риск возобновления сокращения остается повышенным.
Глубоко на территории медвежьего рынка
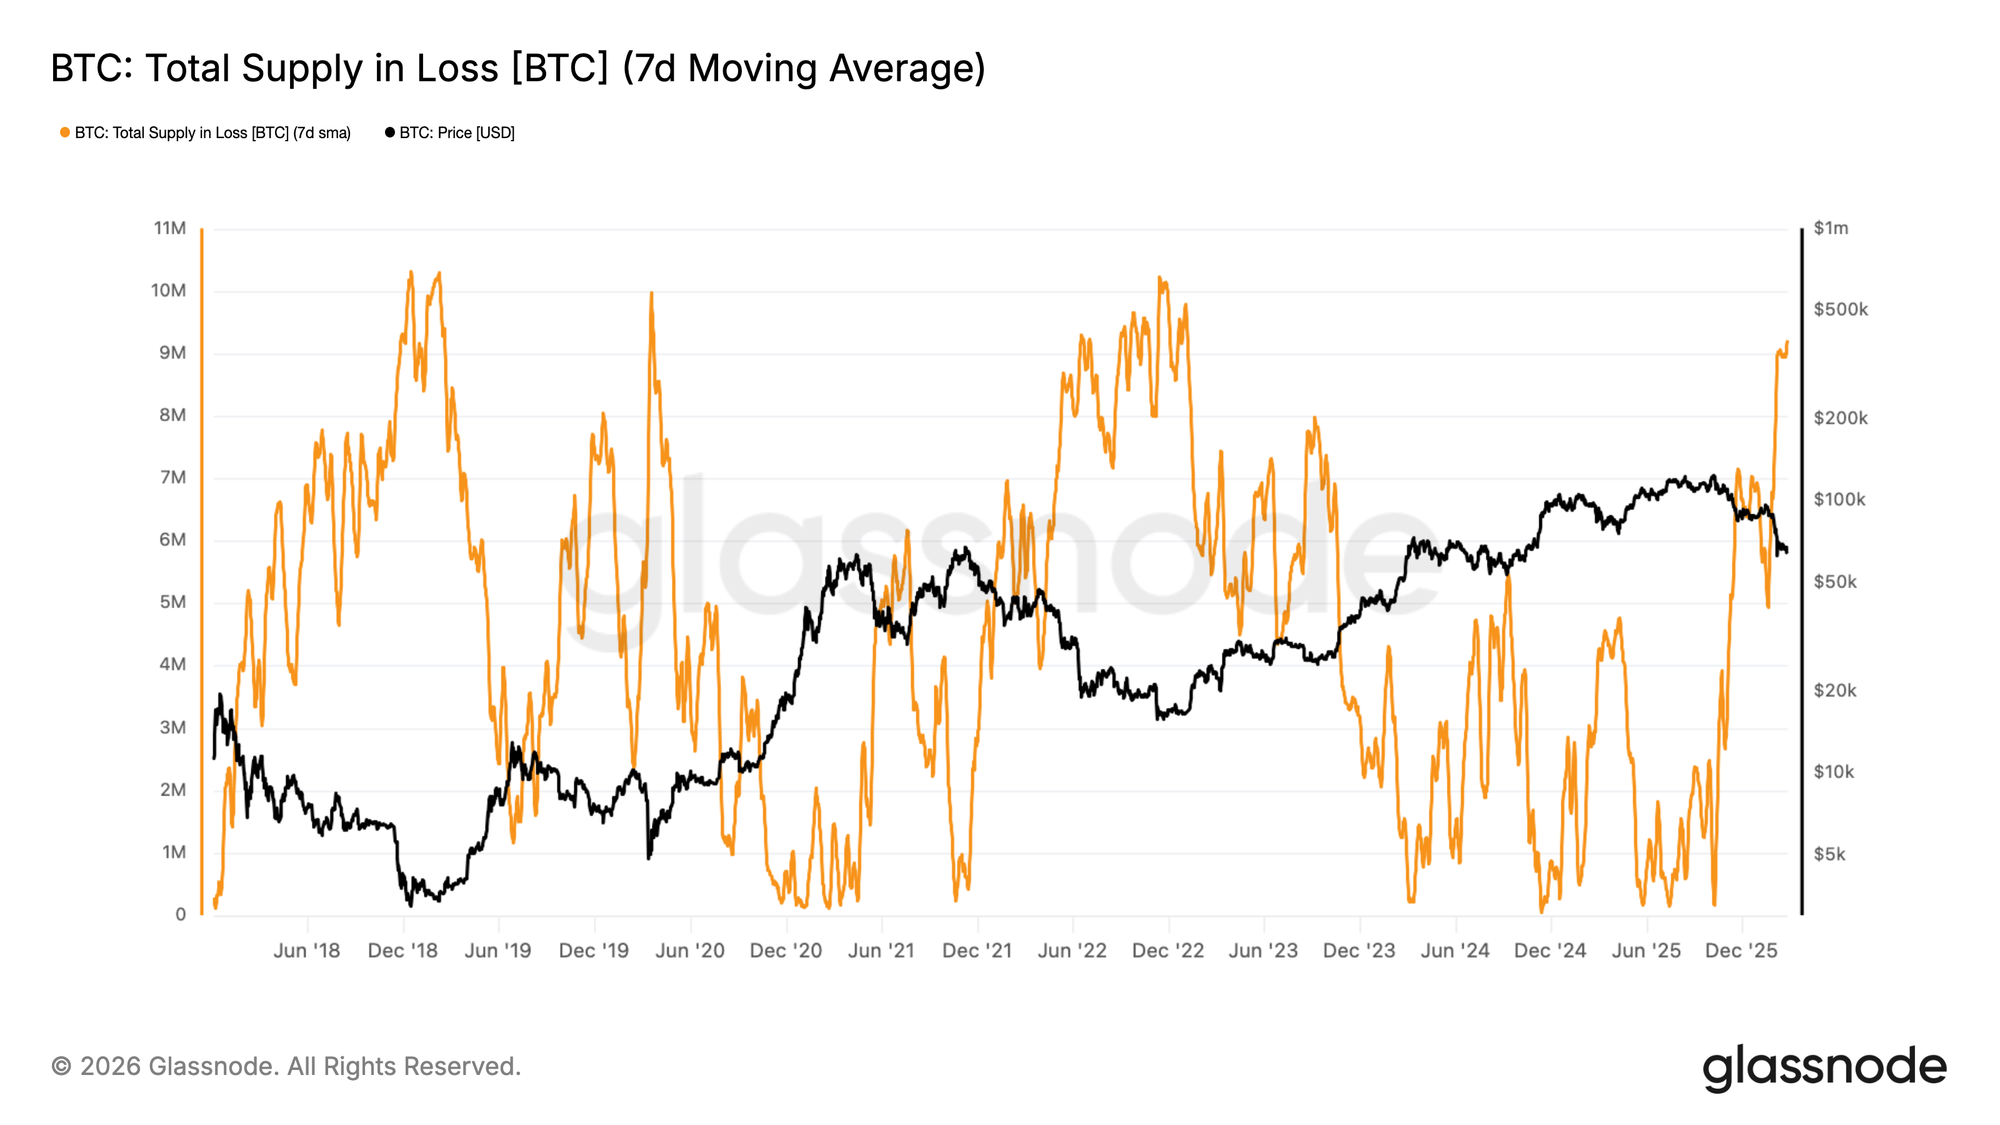
Расширяя эту оценку структурного давления, боль со стороны предложения предоставляет дополнительный взгляд на глубину медвежьего рынка. Total Supply in Loss (Общее предложение в убытке) измеряет объем монет, цена приобретения которых превышает текущую спотовую цену, служа индикатором того, насколько широко распространились нереализованные убытки.
7-дневное скользящее среднее этого показателя выросло до приблизительно 9,2 млн BTC в убытке, что указывает на то, что почти половина циркулирующего предложения сейчас удерживается в убытке. Это согласуется с предыдущими медвежьими рыночными environmentами, где просадки приближались к 50% порогу, и широкие когорты инвесторов находились под давлением.
Хотя downside risk (риск снижения) полностью не рассеялся, такие повышенные уровни предложения в убытке исторически характеризуют поздние стадии медвежьих циклов, а не их начальную фазу. В структурном плане рынок, по-видимому, ближе к потенциальному диапазону дна, чем к началу сокращения, даже несмотря на сохраняющуюся волатильность и хрупкость.
Крупные держатели остаются пассивными
На фоне этих широко распространенных нереализованных убытков, устойчивость текущего диапазона зависит от возобновления накопления. Поскольку торговля в основном велась в диапазоне от $60k до $70k на протяжении февраля, направление eventual breakout (окончательного пробоя) будет зависеть от интенсивности спроса со стороны новых покупателей.
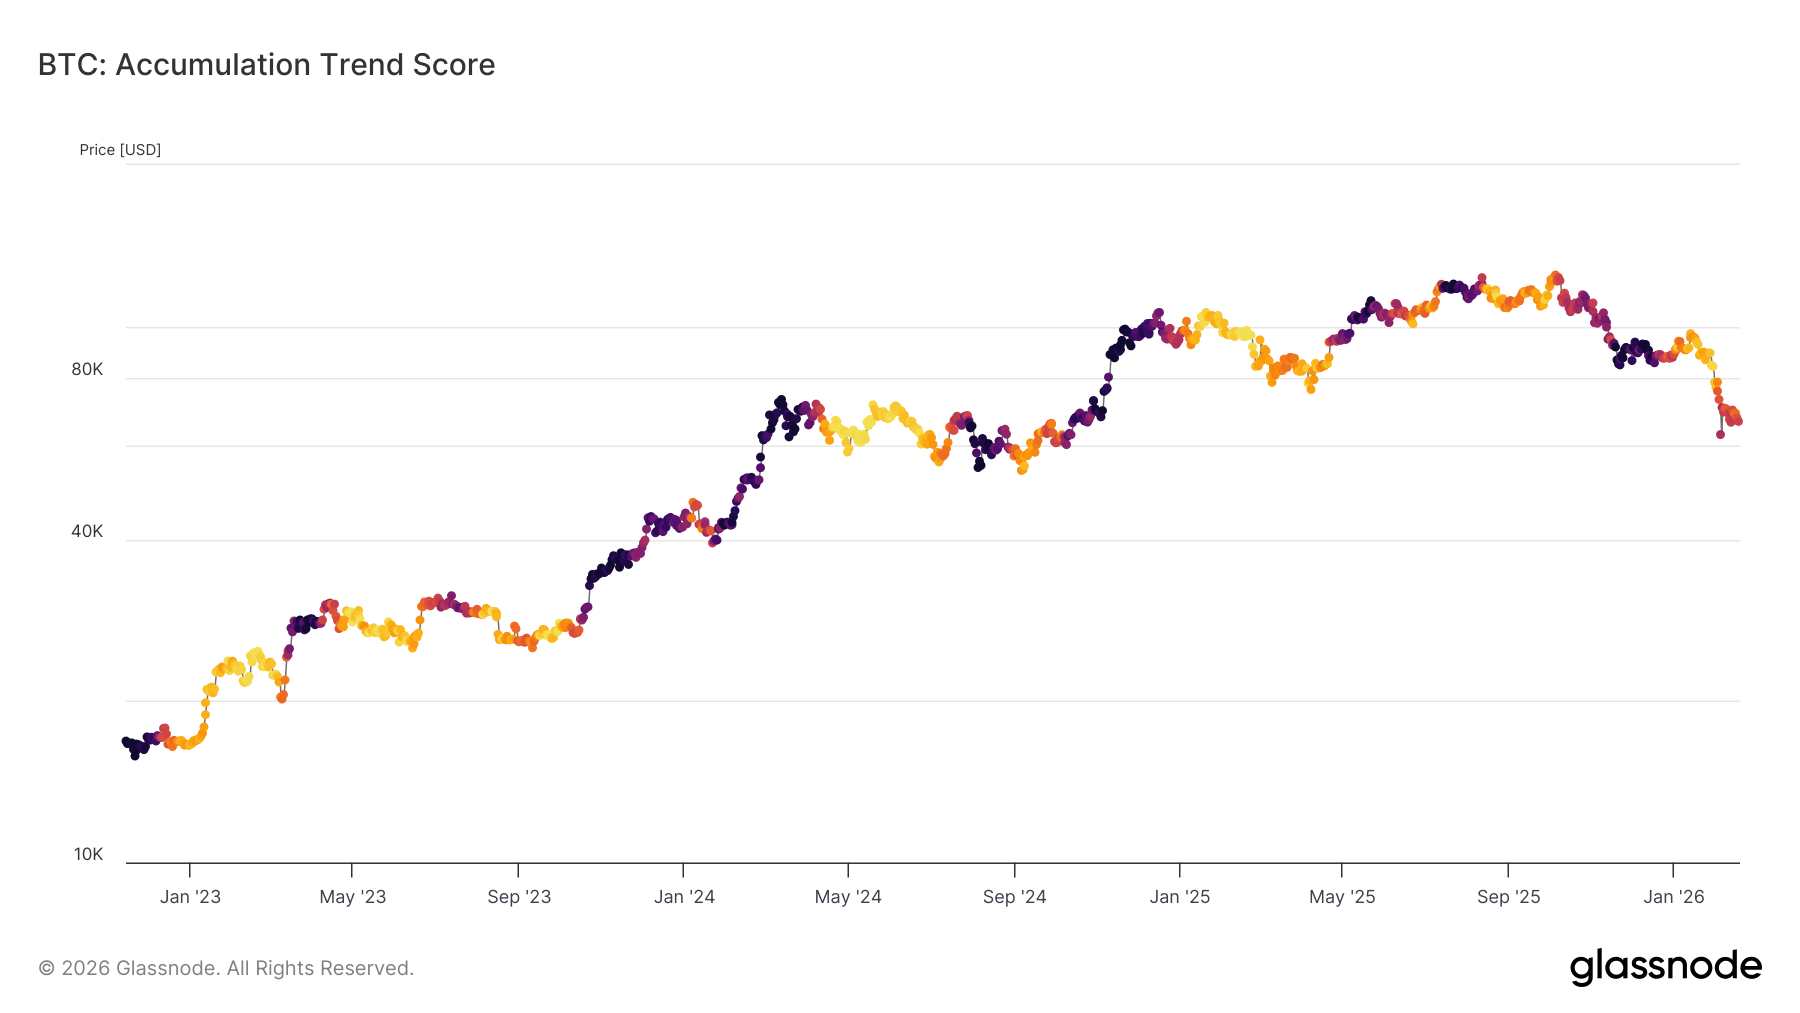
Accumulation Trend Score (Оценка тренда накопления) предлагает полезный индикатор этого поведения, измеряя относительные изменения баланса по когортам кошельков, при этом присваивая больший вес более крупным entities. С 5 февраля Accumulation Trend Score оставался ограниченным ниже 0,5, сигнализируя об отсутствии агрессивного накопления, особенно среди крупных держателей.
Это subdued participation (слабое участие) предполагает, что, несмотря на повышенное предложение в убытке, убежденные покупки еще не materialized (материализовались). Пока более крупные кошельки не перейдут к устойчивому накоплению, вероятность дальнейшего downside contraction (нисходящего сокращения) остается повышенной, прежде чем может сформироваться более durable bottoming structure (прочная структура дна).
Переход к избыточным убыткам
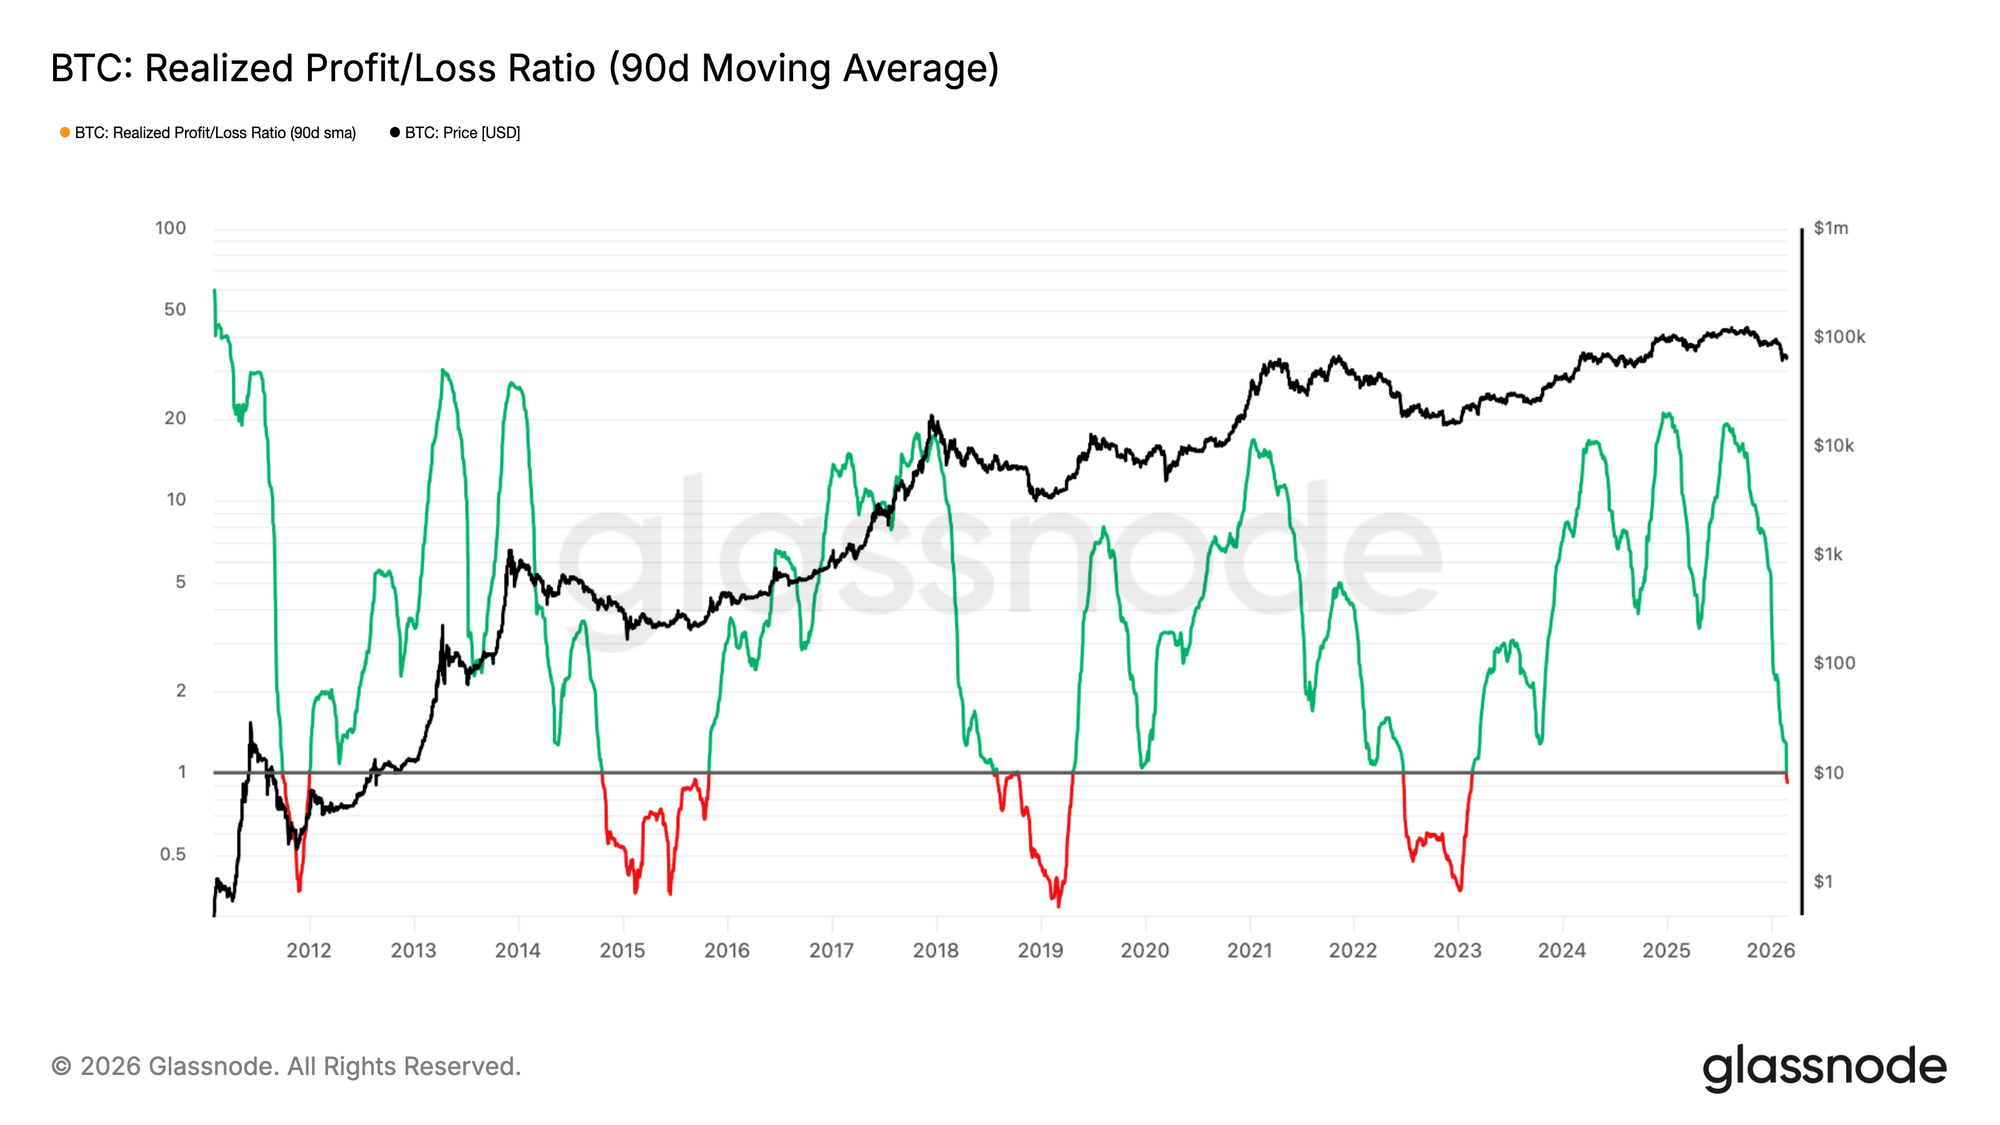
Усугубляя этот фон muted accumulation (слабого накопления), условия ликвидности ухудшились further (еще больше). 90-дневное скользящее среднее коэффициента Realized Profit/Loss Ratio (Реализованная прибыль/убыток), который сравнивает стоимость в долларах реализованной прибыли с реализованными убытками, теперь упало ниже 1,0. Этот порог является критическим, поскольку он отмечает точку, где реализация убытков начинает доминировать над фиксацией прибыли, сигнализируя о переходе в режим excess loss (избыточных убытков).
Исторически устойчивые прорывы ниже 1,0 сохранялись в течение шести месяцев или дольше, отражая prolonged periods (продолжительные периоды) слабой ликвидности со стороны покупателей и ограниченного rotation capital (ротации капитала). Только после решительного reclaim (отвоевания) этого уровня рынок typically (обычно) входил в более конструктивную фазу, характеризующуюся renewed profitability (возобновленной прибыльностью) и improving demand conditions (улучшающимися условиями спроса).
Пока коэффициент не стабилизируется и не вернется к тенденции выше 1, ликвидность остается структурно impaired (нарушенной), ограничивая вероятность durable recovery (устойчивого восстановления) в ближайшей перспективе.
Офф-чейн инсайты
Спотовый CVD Bias резко становится негативным
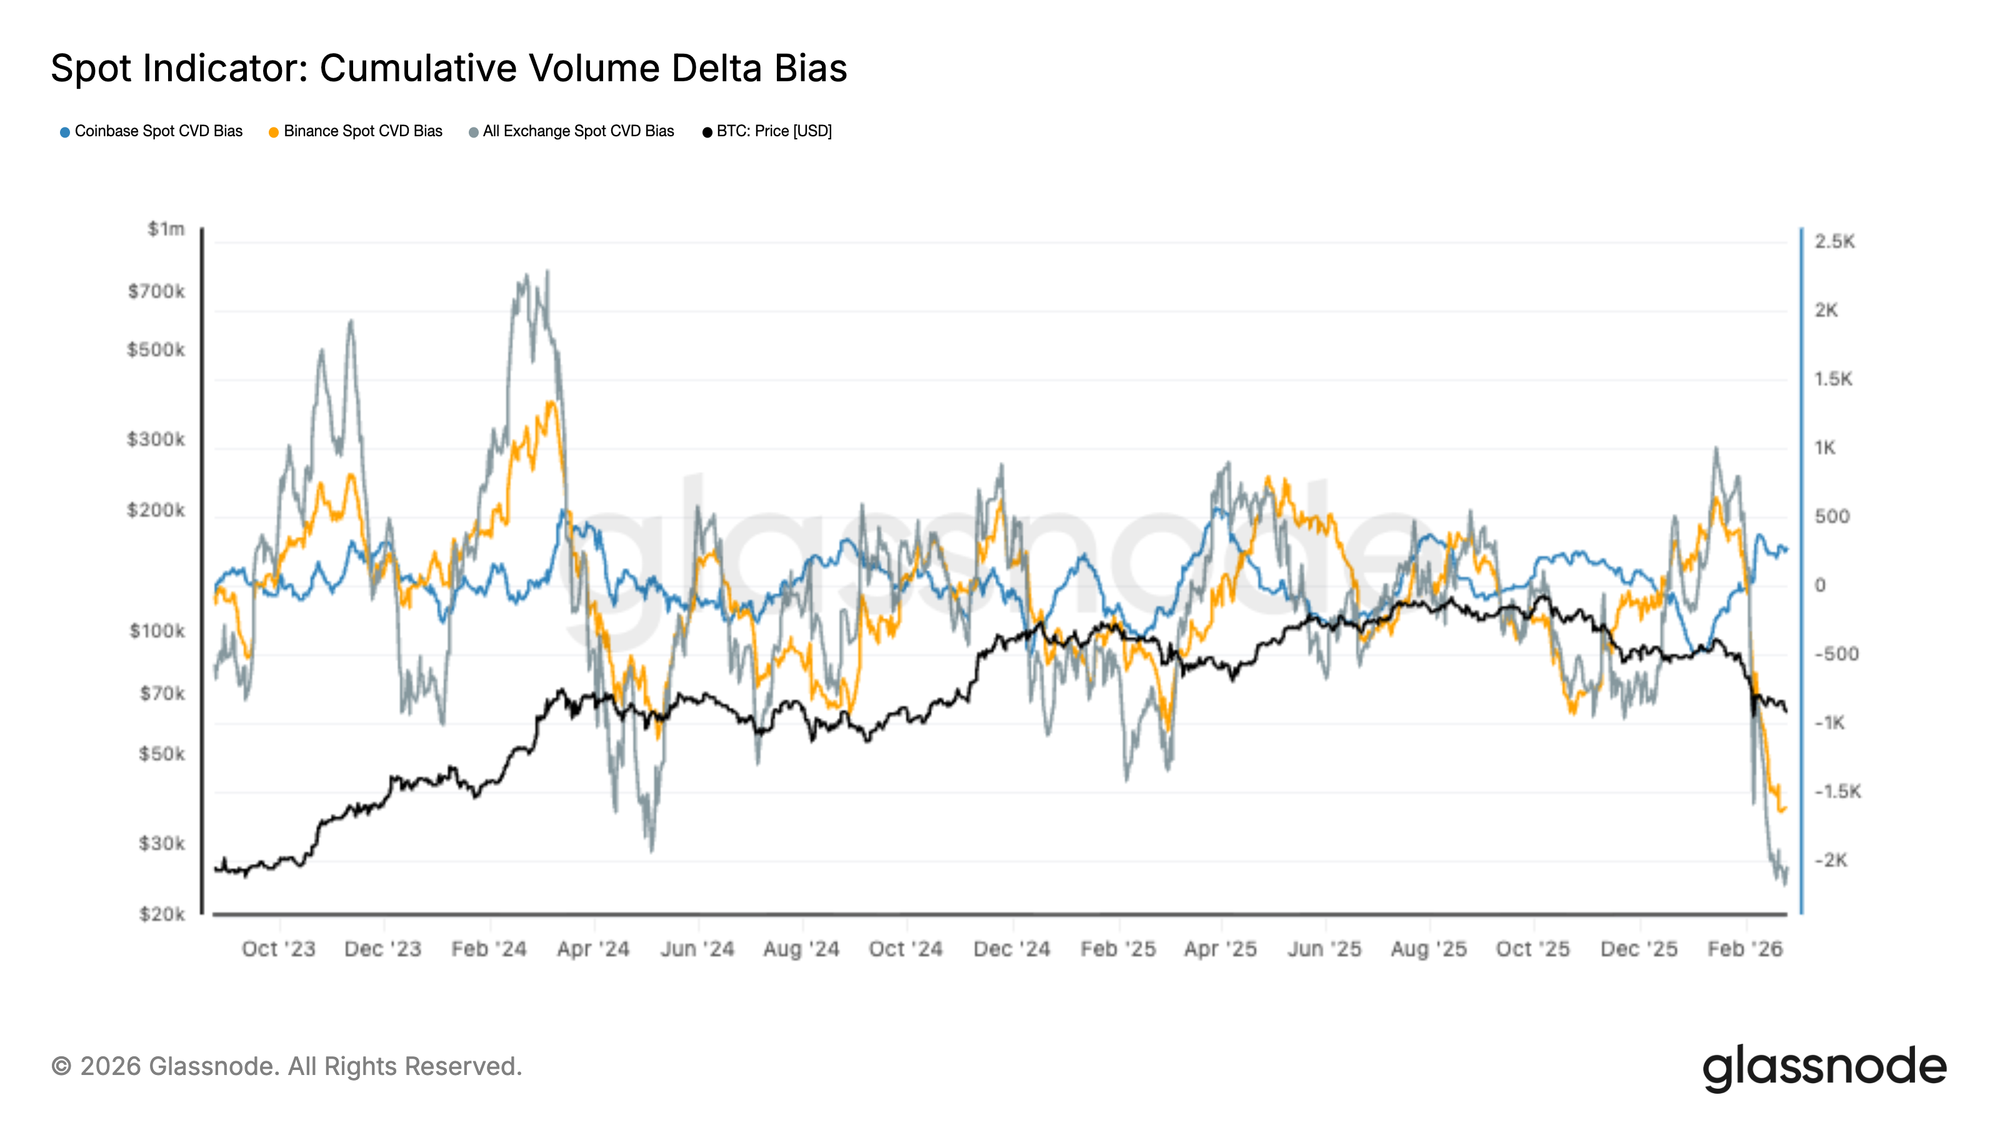
Спотовые рынки решительно перешли в доминирование sell-side (стороны продавцов), при этом Cumulative Volume Delta (CVD, Совокупная дельта объема) на всех биржах упала до новых минимумов цикла. Как потоки на Binance, так и aggregate spot flows (совокупные спотовые потоки) показывают агрессивную волну рыночных ордеров на продажу, в то время как активность на Coinbase остается comparatively muted (относительно слабой) и не может компенсировать более широкую слабость.
Недавняя просадка цены совпала с одним из самых крутых негативных импульсов CVD за последние два года, что позволяет предположить, что движение вниз движется active distribution (активным распределением), а не passive liquidity gaps (пассивными gaps ликвидности). Подобные экстремумы в конце 2023 и середине 2024 года отмечали локальные события exhaustion (истощения), хотя дальнейшее развитие зависело от derivatives positioning (позиционирования на деривативах) и broader liquidity conditions (более широких условий ликвидности).
Поскольку спотовые потоки теперь глубоко смещены в сторону продавцов, рынок кажется реактивным и хрупким. Устойчивое восстановление, вероятно, потребует четкого сдвига обратно в сторону spot bid absorption (поглощения спотовых заявок), особенно в потоках Binance и aggregate exchange flows (совокупных биржевых потоков), прежде чем можно будет подтвердить constructive accumulation (конструктивное накопление).
Потоки US Spot ETF продолжают фазу распределения
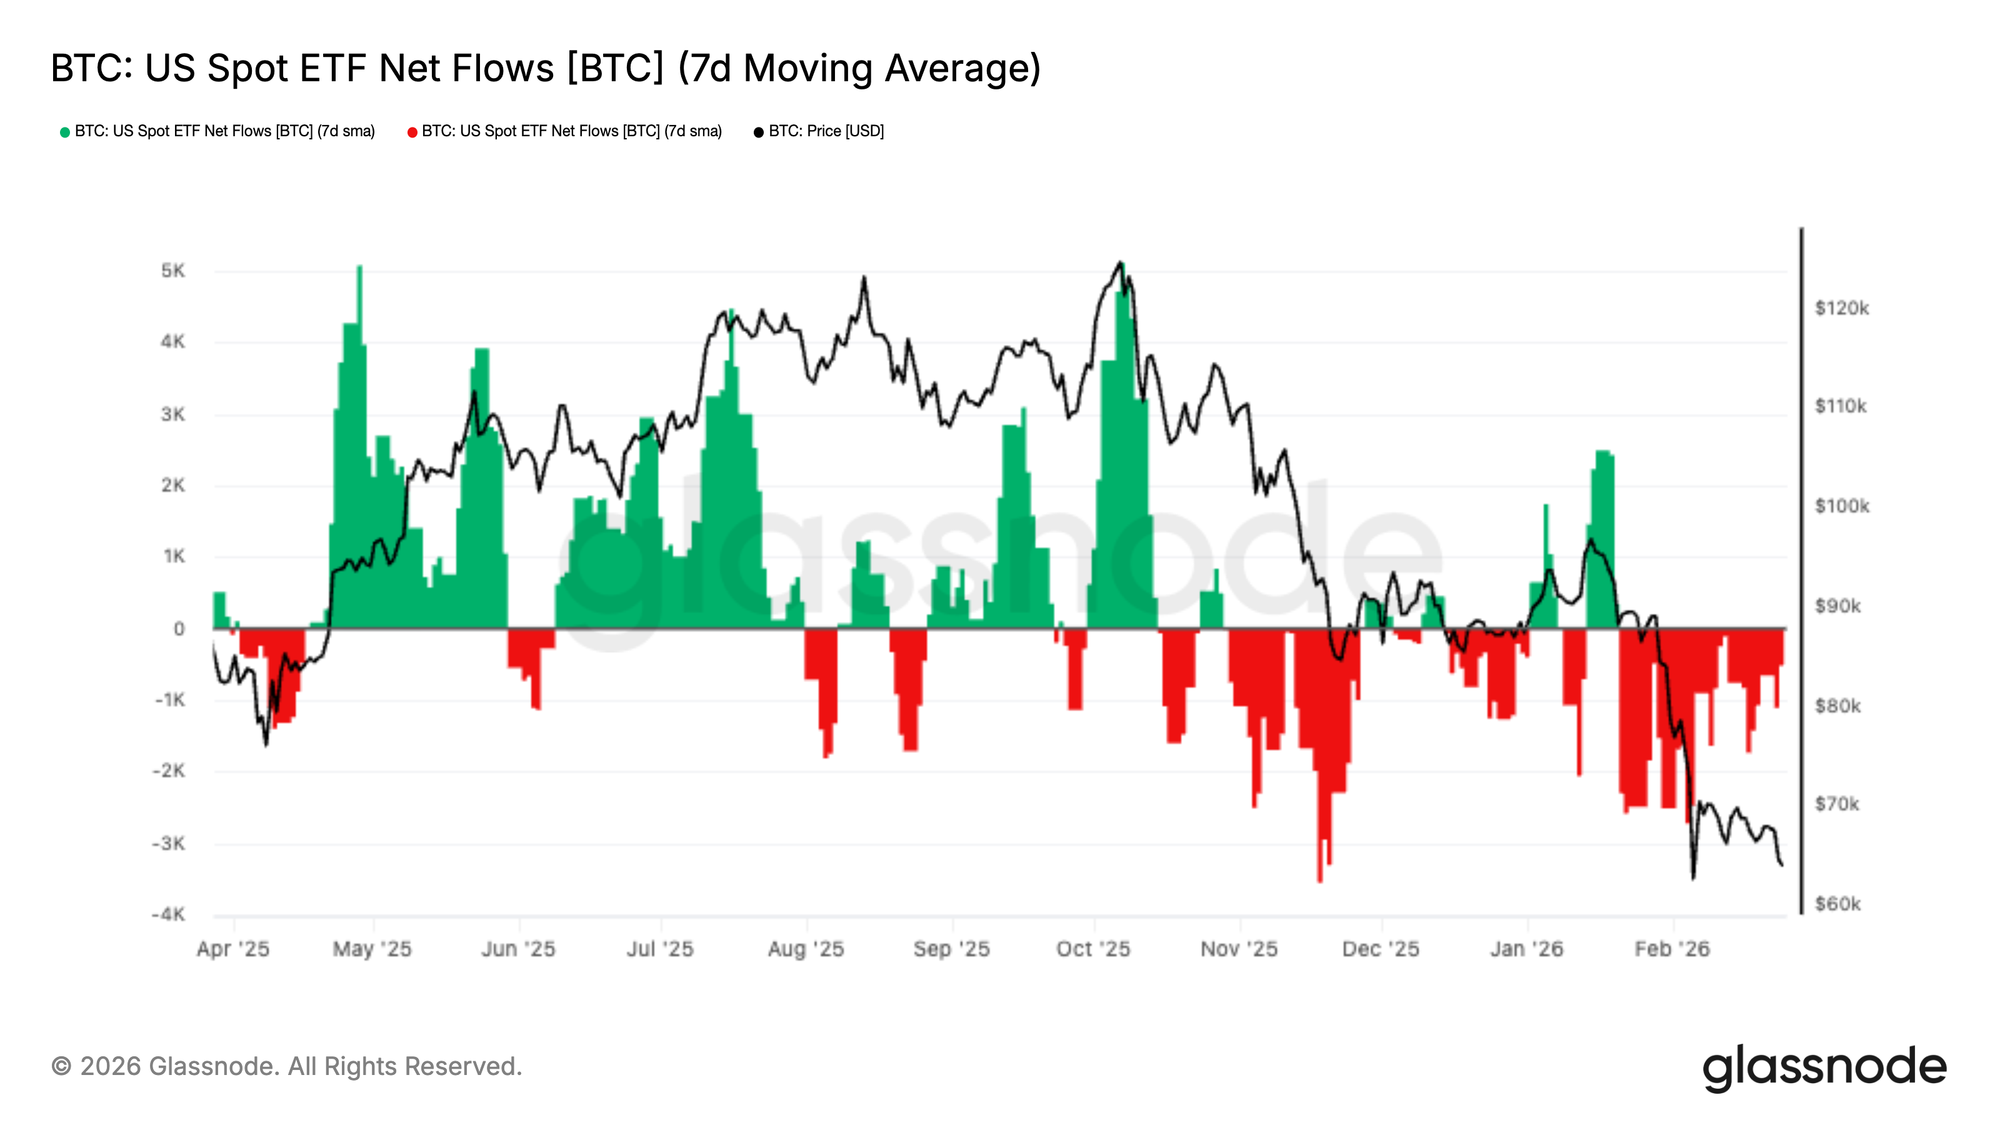
Потоки US Spot ETF остаются firmly (уверенно) на территории чистого оттока, при этом 7-дневное скользящее среднее показывает persistent series (устойчивую серию) красных столбцов с конца ноября. Последние недели увидели renewed acceleration (возобновленное ускорение) в оттоках, совпав с breakdown (продажей) BTC к диапазону $60k–$70k.
Ранее в цикле сильные импульсы притока consistently aligned (последовательно совпадали) с price expansions (расширением цены), особенно в мае и октябре. В contrast (противоположность этому), текущий режим характеризуется sustained redemption pressure (устойчивым давлением погашения) и lack of meaningful bid support (отсутствием meaningful поддержки спроса) со стороны ETF allocators (аллокаторов).
Этот shift (сдвиг) предполагает, что институциональный спрос materially cooled (значительно остыл), удаляя ключевой структурный tailwind (попутный ветер), который поддерживал предыдущие ралли. Пока потоки не стабилизируются или не вернутся к устойчивому чистому притоку, price action (ценовое действие), вероятно, останется реактивным и уязвимым для дальнейшего downside pressure (давления вниз).
Ставки финансирования остаются нейтральными
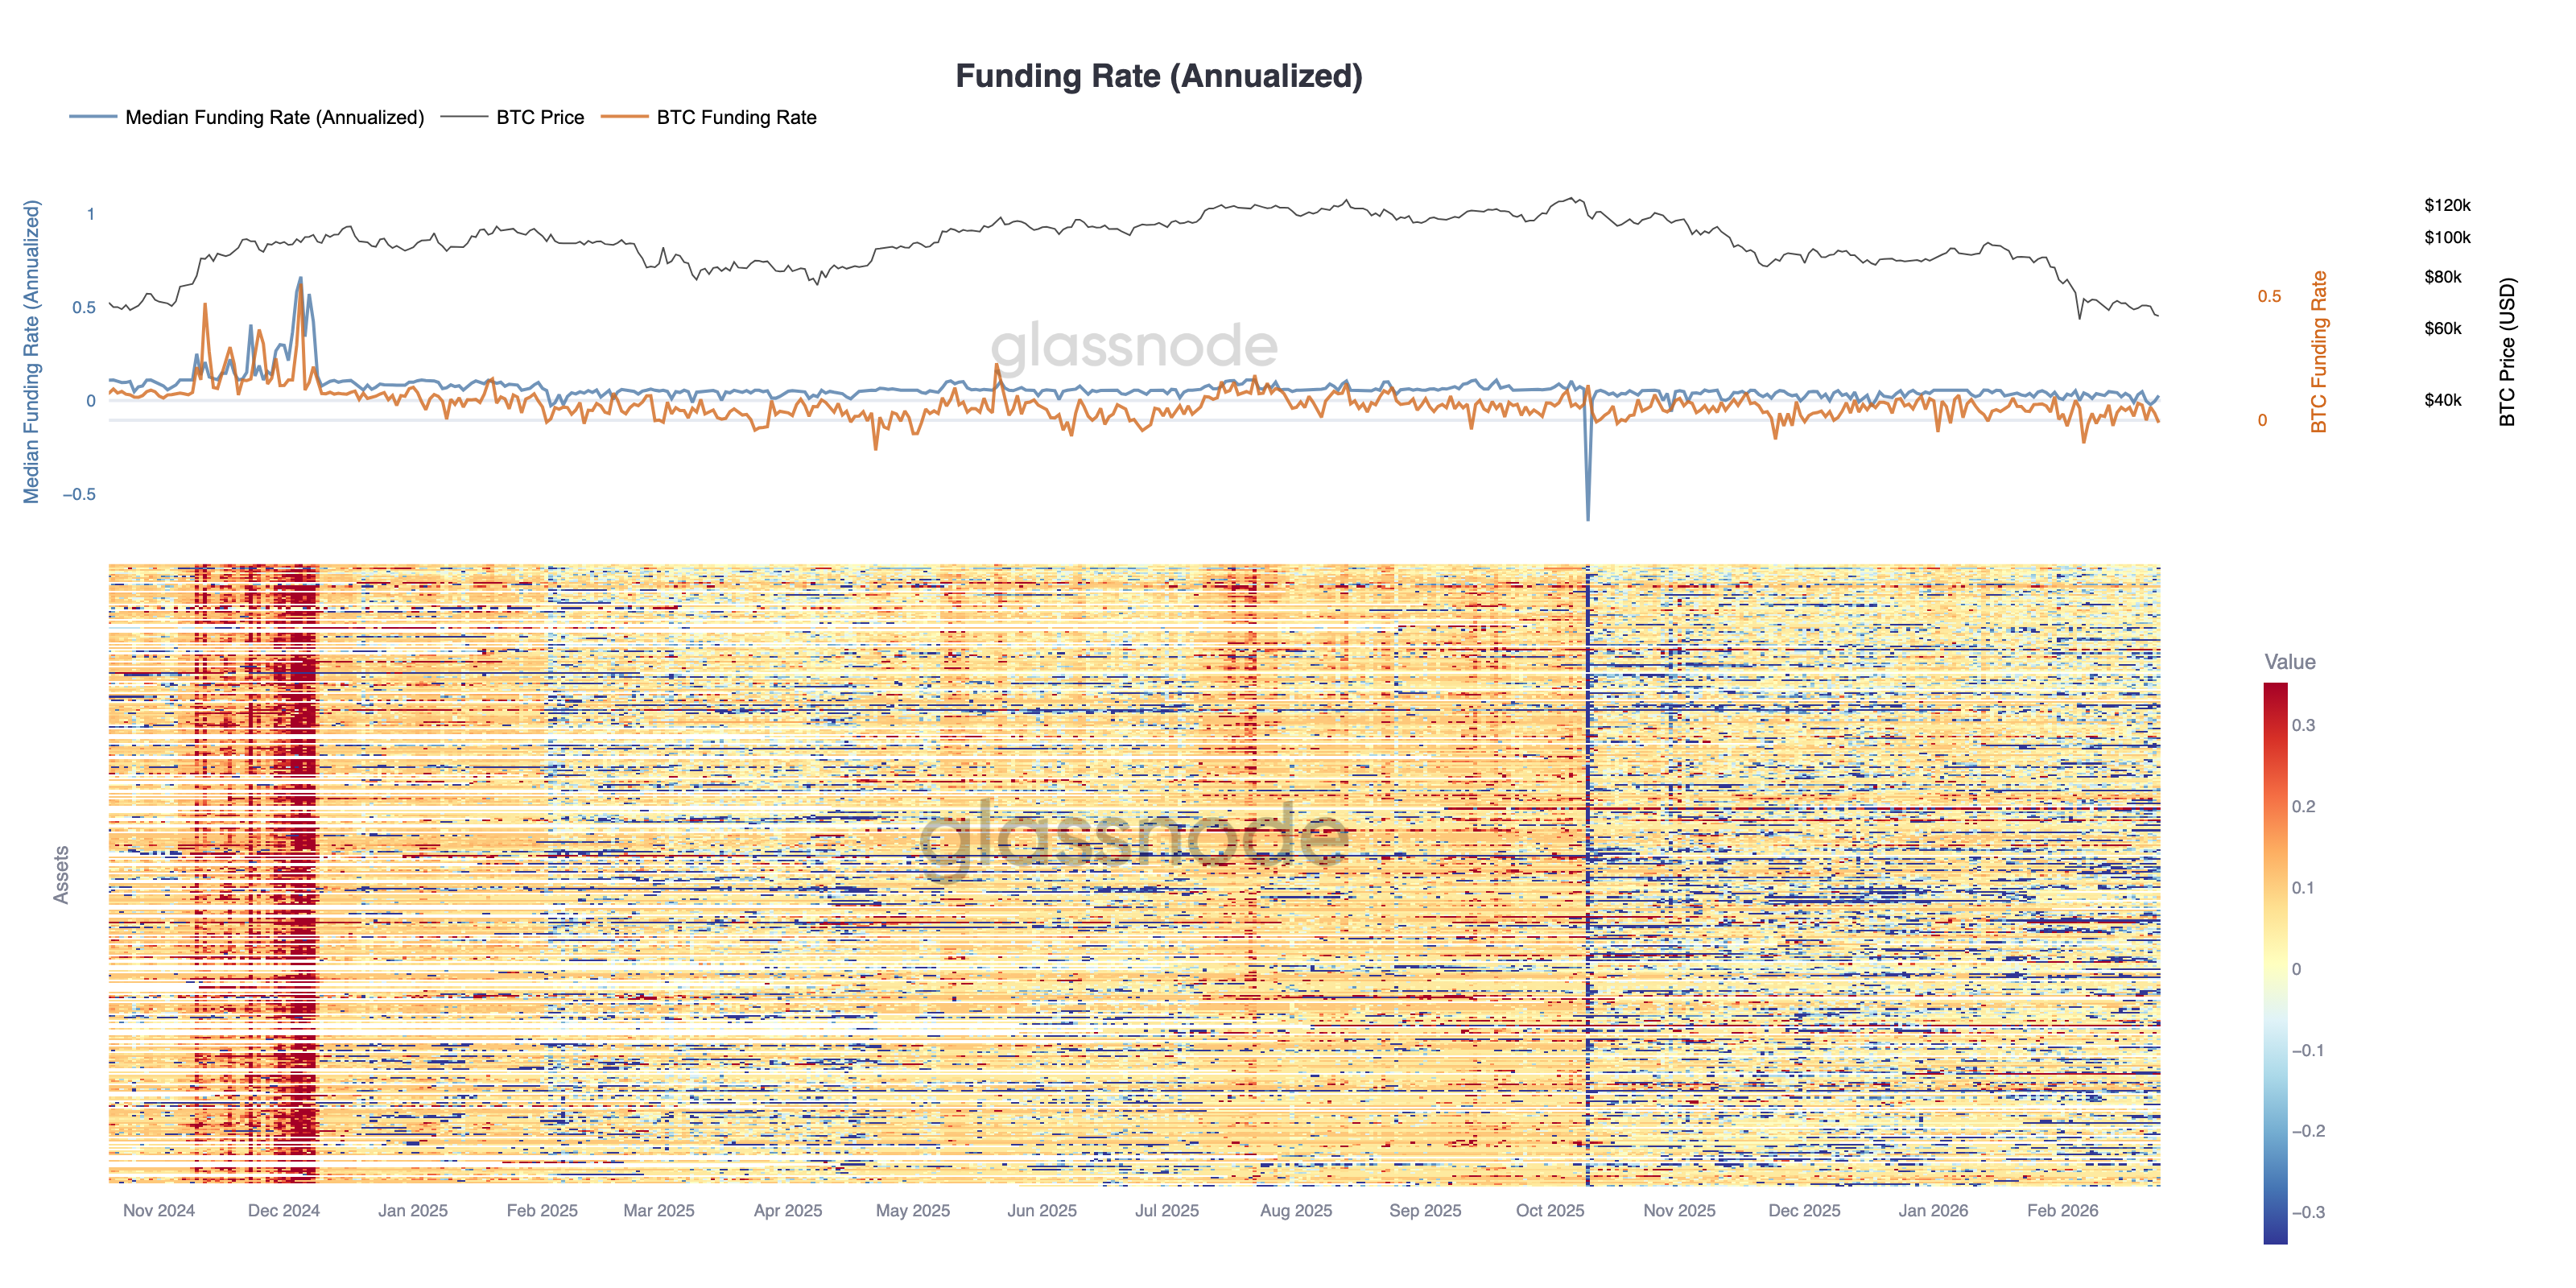
Финансирование perpetual futures (бессрочных фьючерсов) существенно нормализовалось, при этом медианная annualized rate (годовая ставка) сжалась обратно к нейтральной после устойчивых положительных показателей на протяжении большей части предыдущего ралли. Недавняя просадка цены совпала с cooling (охлаждением) спекулятивного позиционирования, поскольку leveraged long exposure (кредитное длинное exposure) постепенно unwound (сворачивается).
Кросс-активный heatmap (тепловая карта) highlights (подчеркивает) broad-based funding softness (широкую слабость финансирования), при этом многие инструменты перешли от persistent positive prints (устойчивых положительных показателей) к mixed or slightly negative territory (смешанной или слегка отрицательной территории). Это резко контрастирует с концом 2024 года, когда elevated funding (повышенное финансирование) отражало crowded long positioning (переполненное длинное позиционирование) и агрессивную directional conviction (убежденность в направлении).
Хотя отсутствие extreme negative funding (экстремального отрицательного финансирования) предполагает limited panic-driven shorting (ограниченные панические shortи), отсутствие sustained positive prints (устойчивых положительных показателей) также указывает на muted risk appetite (приглушенный аппетит к риску). Рынки деривативов теперь кажутся более сбалансированными, с reduced leverage (сниженным leverage) и менее extended positioning (растянутым позиционированием), оставляя spot flows (спотовые потоки) и structural demand (структурный спрос) в качестве ключевых драйверов для следующего directional move (движения по направлению).
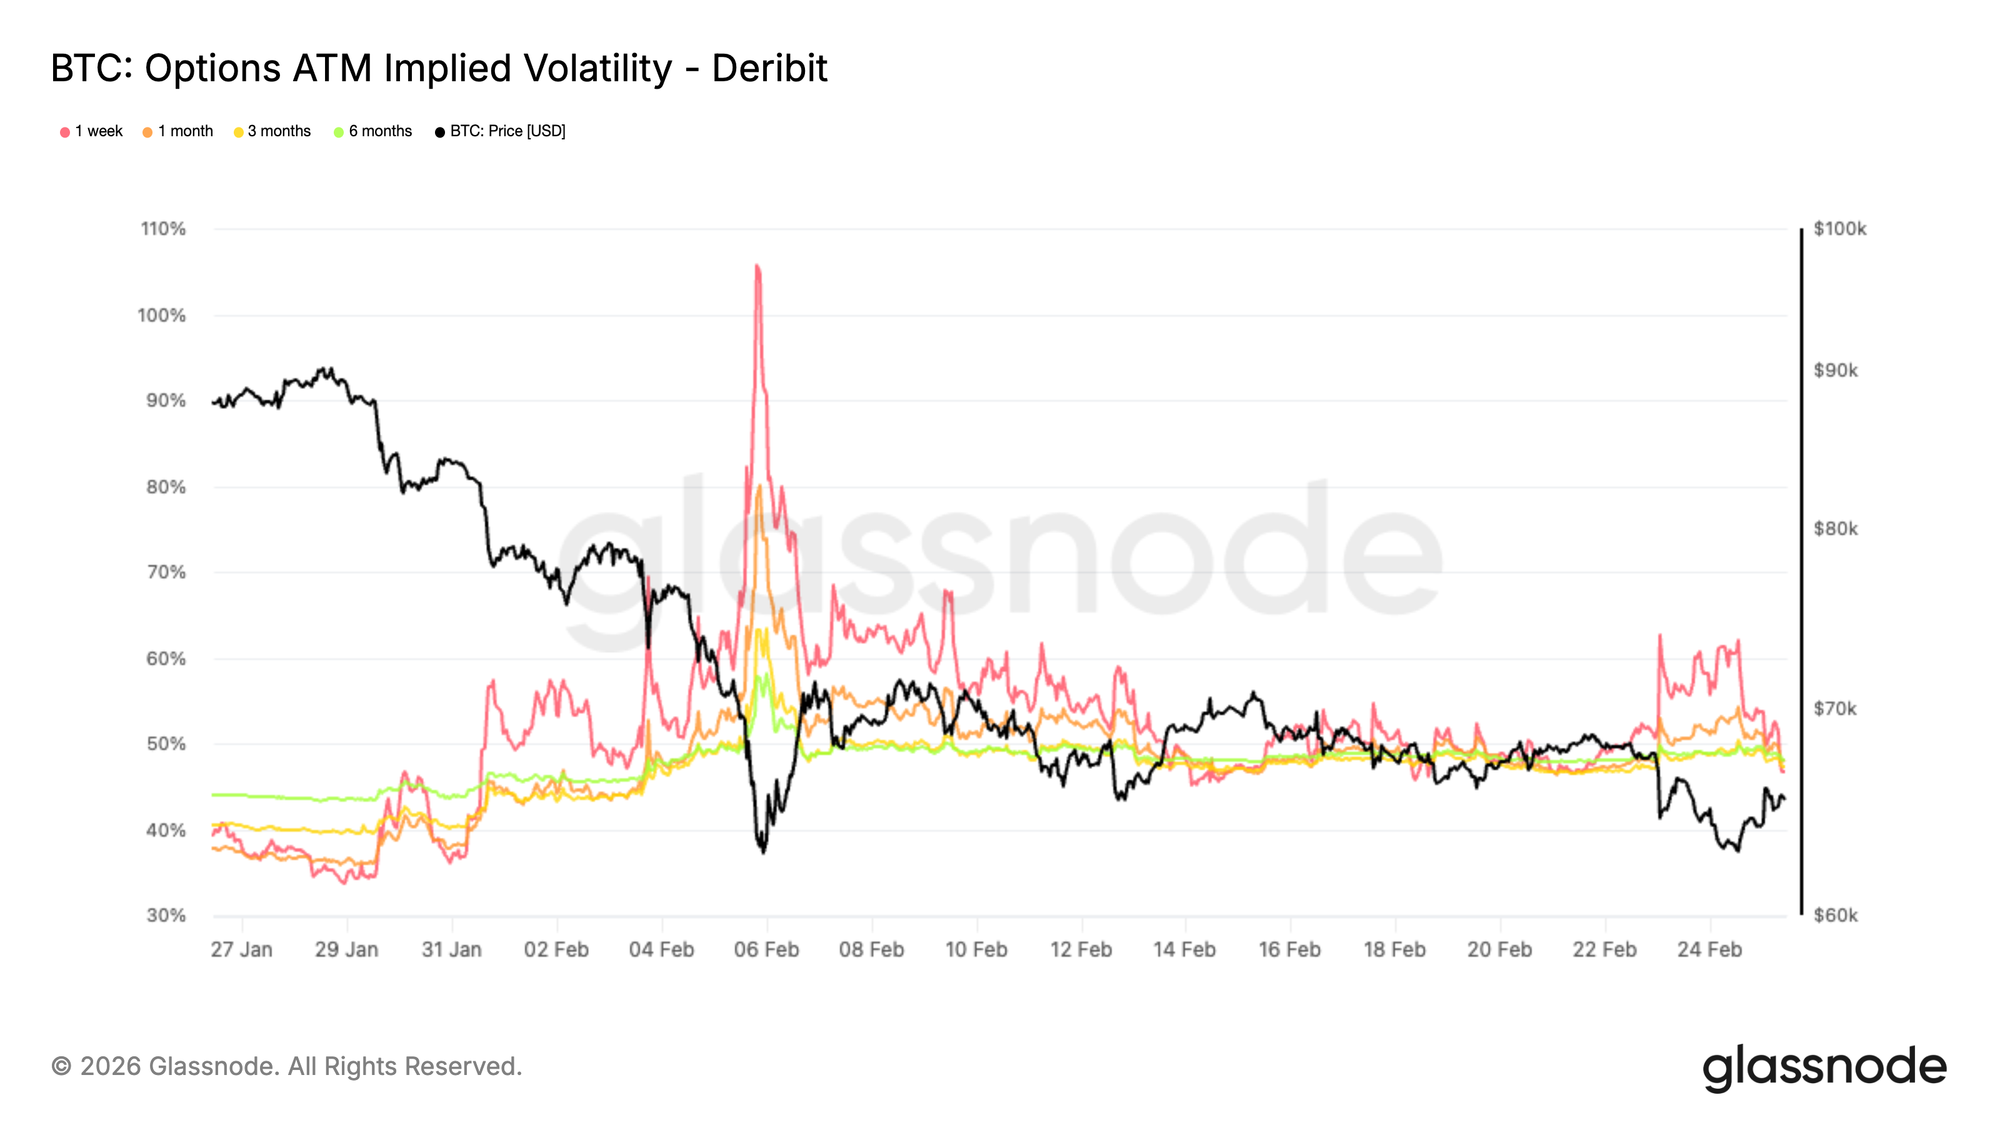
Подразумеваемая волатильность реагирует, но не расширяется
At the money (на деньгах) подразумеваемая волатильность повышена по сравнению с месяцем назад, но не экстремальна, составляя около 47 процентов по всем срокам.
В последних сессиях волатильность кратковременно spiked (подскочила), когда $BTC приблизился к уровню 62K, зоне, которая могла бы открыть движение к высоким 50-м, если бы была пробита. Однонедельная ATM волатильность подскочила с 47 процентов до 62 процентов, поскольку трейдеры бросились хеджировать, вспоминая резкий сброс ранее в этом месяце.
Это repricing (переоценка) оказалась недолговечной. Поскольку цена вернулась к 65K, однонедельная волатильность сжалась обратно до 47 процентов.
Это rapid expansion (быстрое расширение) и столь же rapid compression (быстрое сжатие) highlights (подчеркивает) высоко реактивный опционный рынок. Участники быстро платят за краткосрочную защиту near key levels (около ключевых уровней), но так же быстро unwind (сворачивают) ее, когда непосредственная угроза исчезает.
Результатом является mean reverting (возвращающаяся к среднему) волатильность фон, где всплески страха еще не переводятся в sustained volatility expansion (устойчивое расширение волатильности).
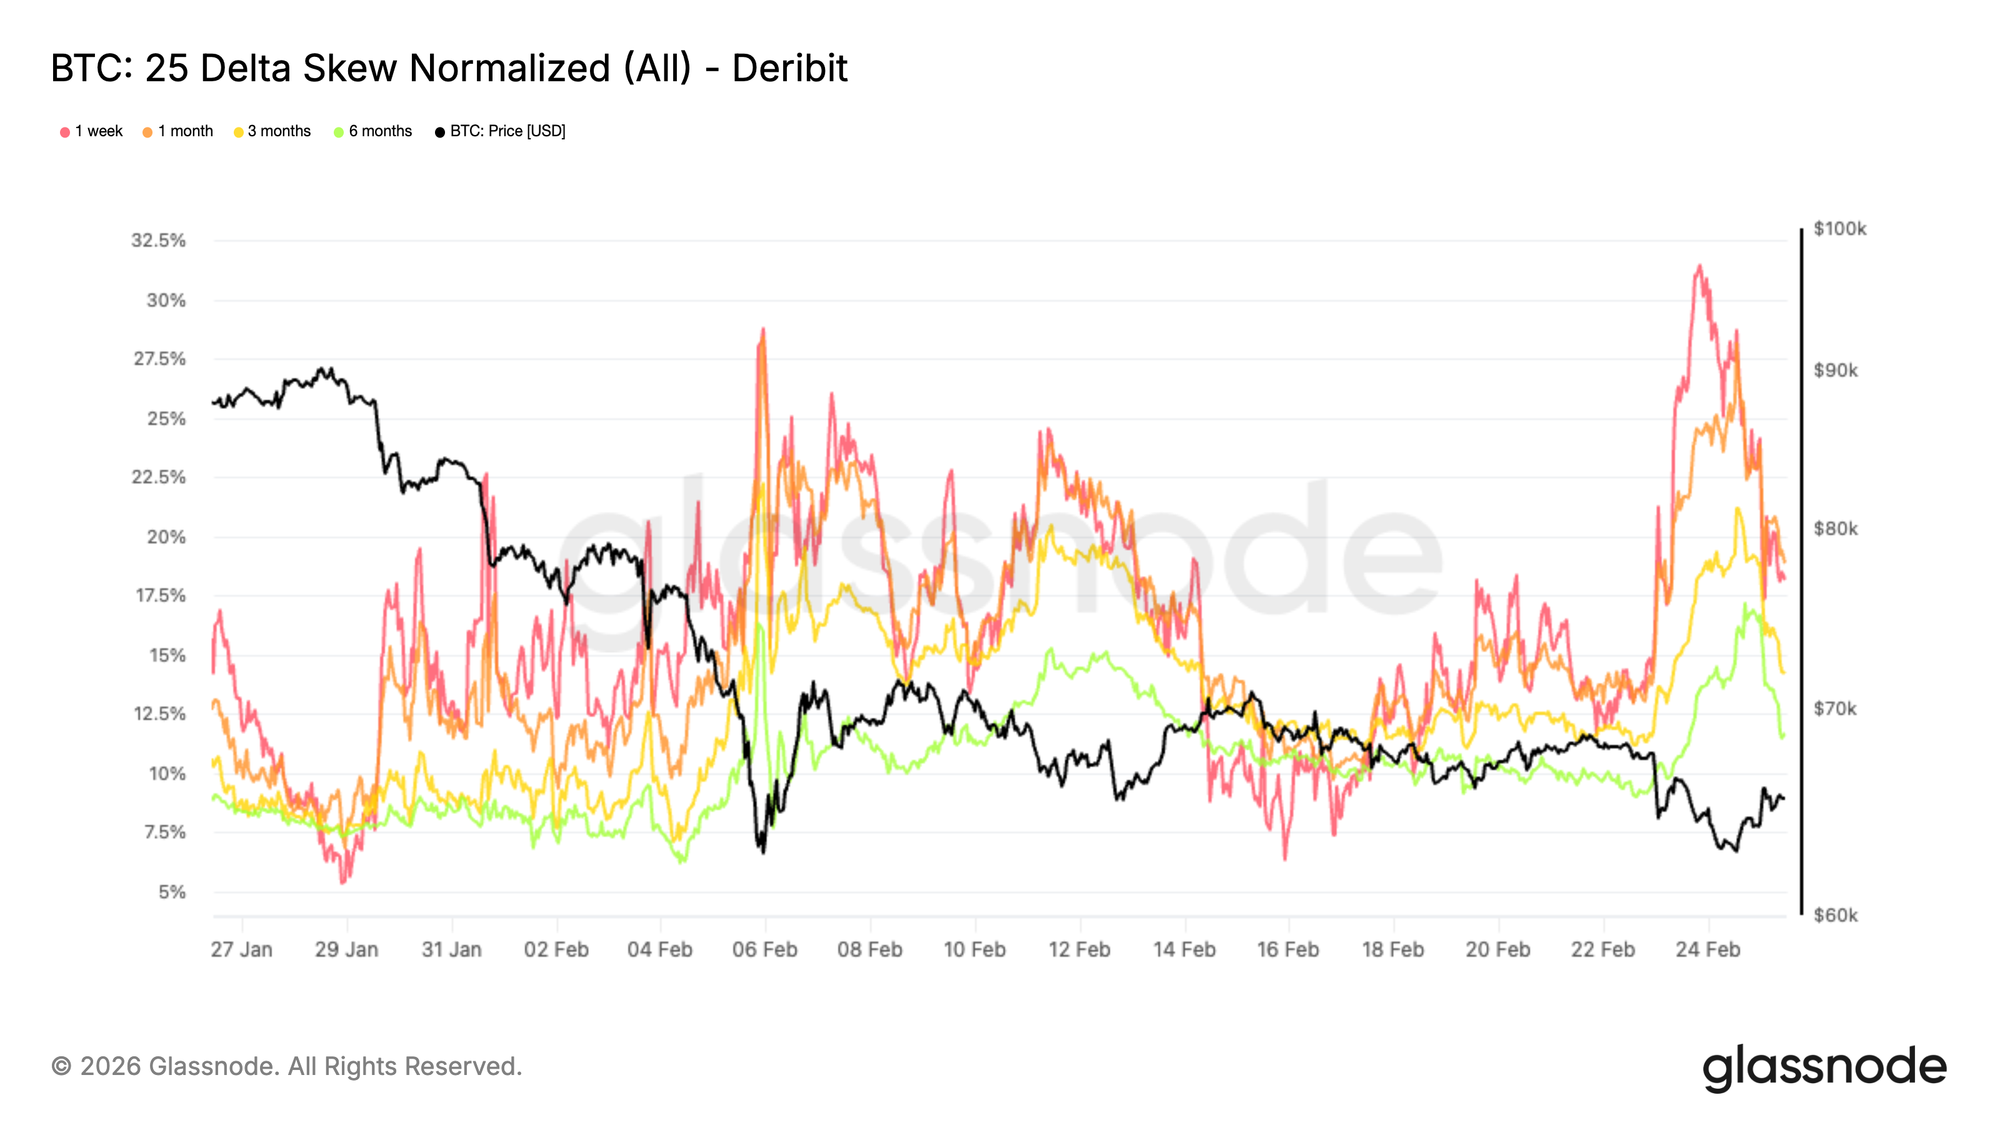
25 Delta Skew сигнализирует о возобновлении страха снижения
В то время как подразумеваемая волатильность в целом оставалась сдержанной, 25 delta skew рассказывает более оборонительную историю. Этот показатель измеряет разницу в цене между downside puts (putами на снижение) и upside calls (callами на рост), highlighting (подчеркивая), пользуется ли большим спросом защита или exposure (экспоушер) на рост.
Скос снова достиг extreme asymmetry (экстремальной асимметрии), приблизившись к уровням, последний раз наблюдавшимся 5 февраля во время резкого падения к 60K. В то время скорость и амплитуда движения застали трейдеров врасплох, вызвав late stage hedging (хеджирование на поздней стадии) и вынудив puts торговаться с премией в 28 процентов над calls.
В последних сессиях put skew поднялся к 30 процентам. Каждое испытание нижней части диапазона возрождало спрос на защиту, при этом участники использовали отскоки для восстановления downside hedges (хеджей от снижения).
Эта persistent richness (устойчивая дороговизна) в puts отражает рынок, готовый платить за страховку, усиливая clearly defensive positioning bias (явно оборонительную предвзятость позиционирования).
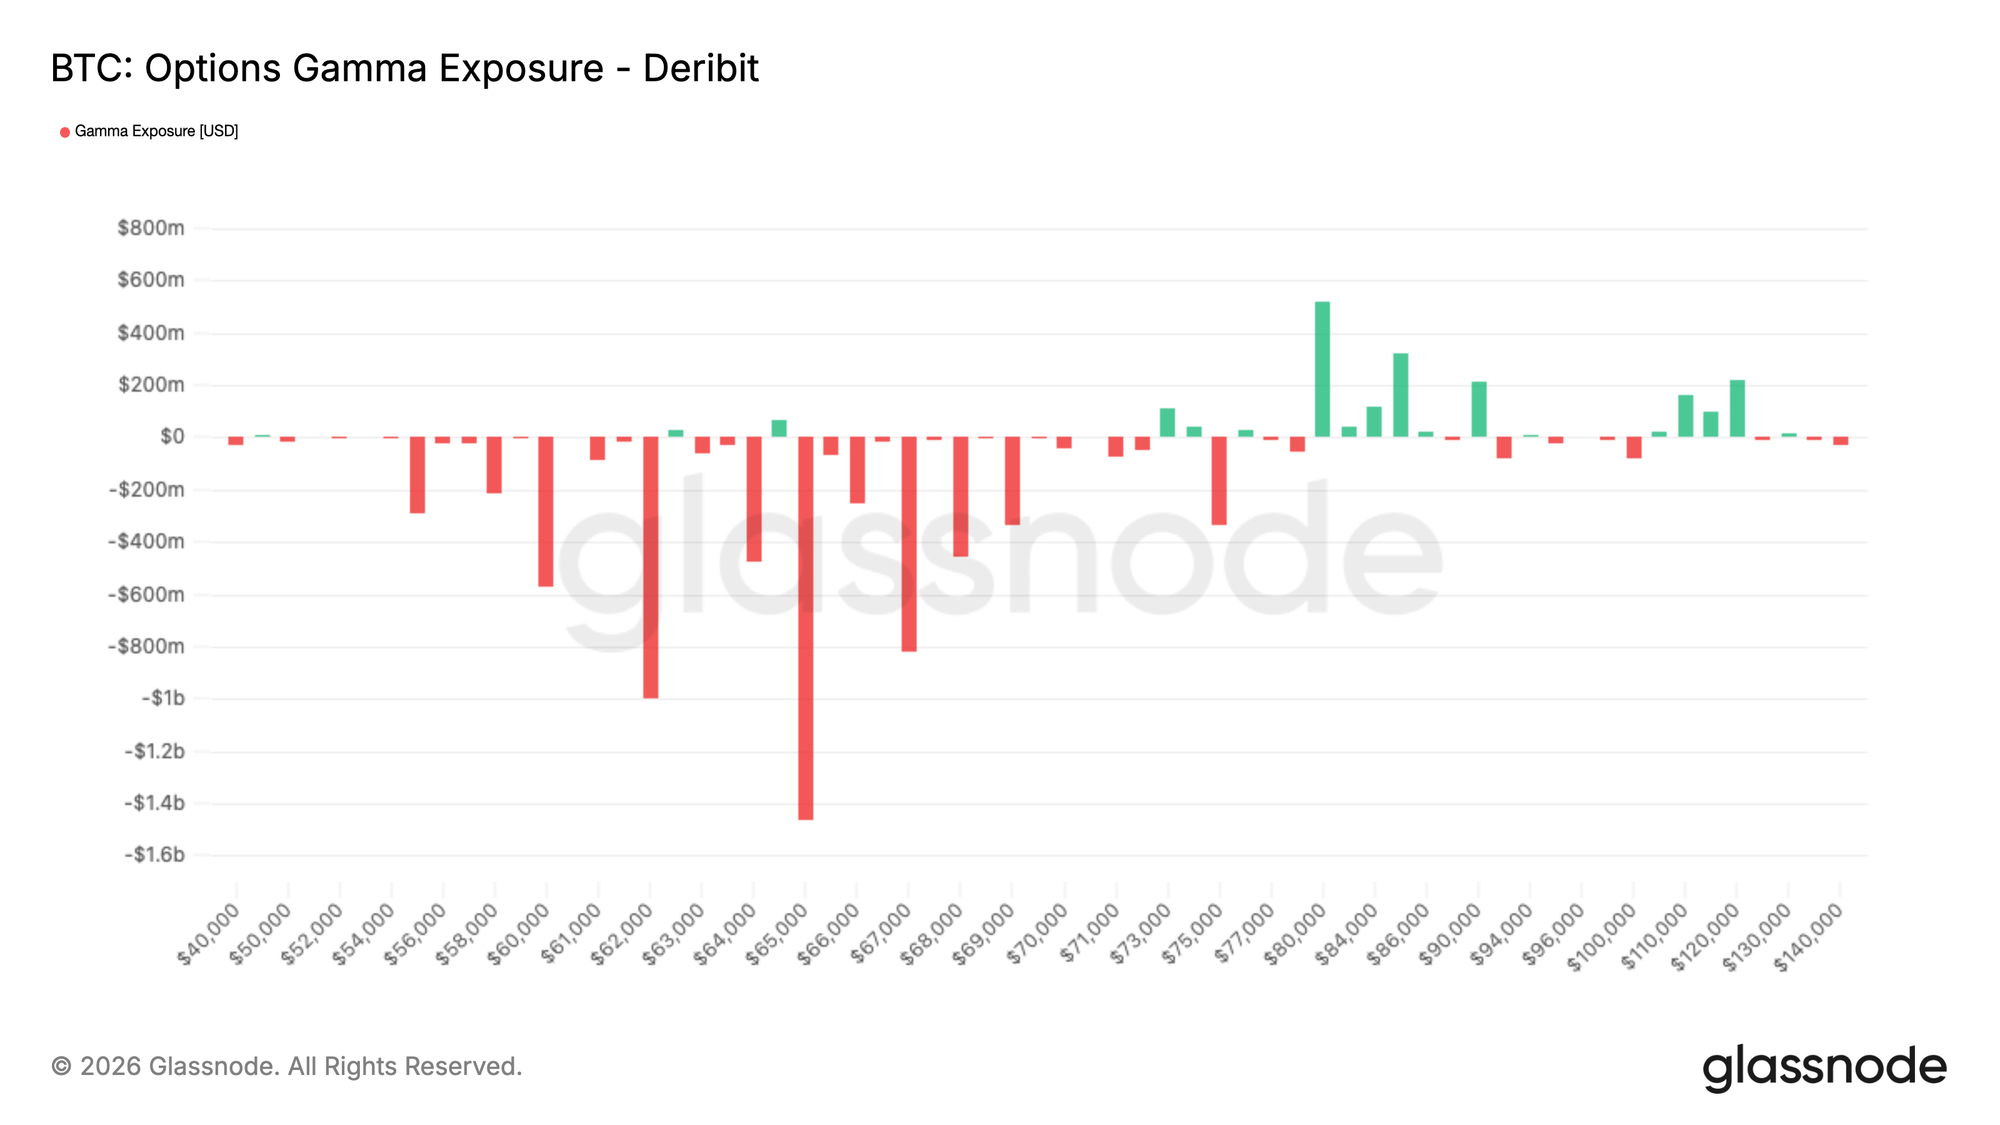
Экспоушер гаммы опционов остается нетто-шортовым
Этот устойчивый спрос на защиту mirrored (отражается) в текущем гамма-позиционировании. По всем срокам экспирации рынок находится внутри широкого short gamma corridor (коридора короткой гаммы) между 70K и 55K, оставляя структуру inherently fragile (внутренне хрупкой) в пределах этого диапазона.
Страйк 65K выделяется, с примерно 1,5 миллиардами долларов negative dealer gamma (негативной гаммы дилера), сконцентрированной там. Этот карман полностью истекает в эту пятницу, что делает его особенно relevant (актуальным) в краткосрочной перспективе. Движение ниже к экспирации может вызвать accelerated hedging flows (ускоренные потоки хеджирования), поскольку дилеры продают фьючерсы, чтобы оставаться delta neutral (дельта-нейтральными). В то же время, после прохождения экспирации эти хеджи unwind (сворачиваются). Дилеры выкупали бы фьючерсы обратно, что может механически ослабить давление и создать временное relief (облегчение).
Дальше, экспирации конца марта несут примерно 650 миллионов долларов negative gamma (негативной гаммы) на 62K и 830 миллионов долларов на 60K, расширяя structural sensitivity (структурную чувствительность) на предстоящие недели.
Short gamma (Короткая гамма) не определяет направление, но увеличивает вероятность того, что движения,一旦 начавшись, становятся более резкими и самоусиливающимися.
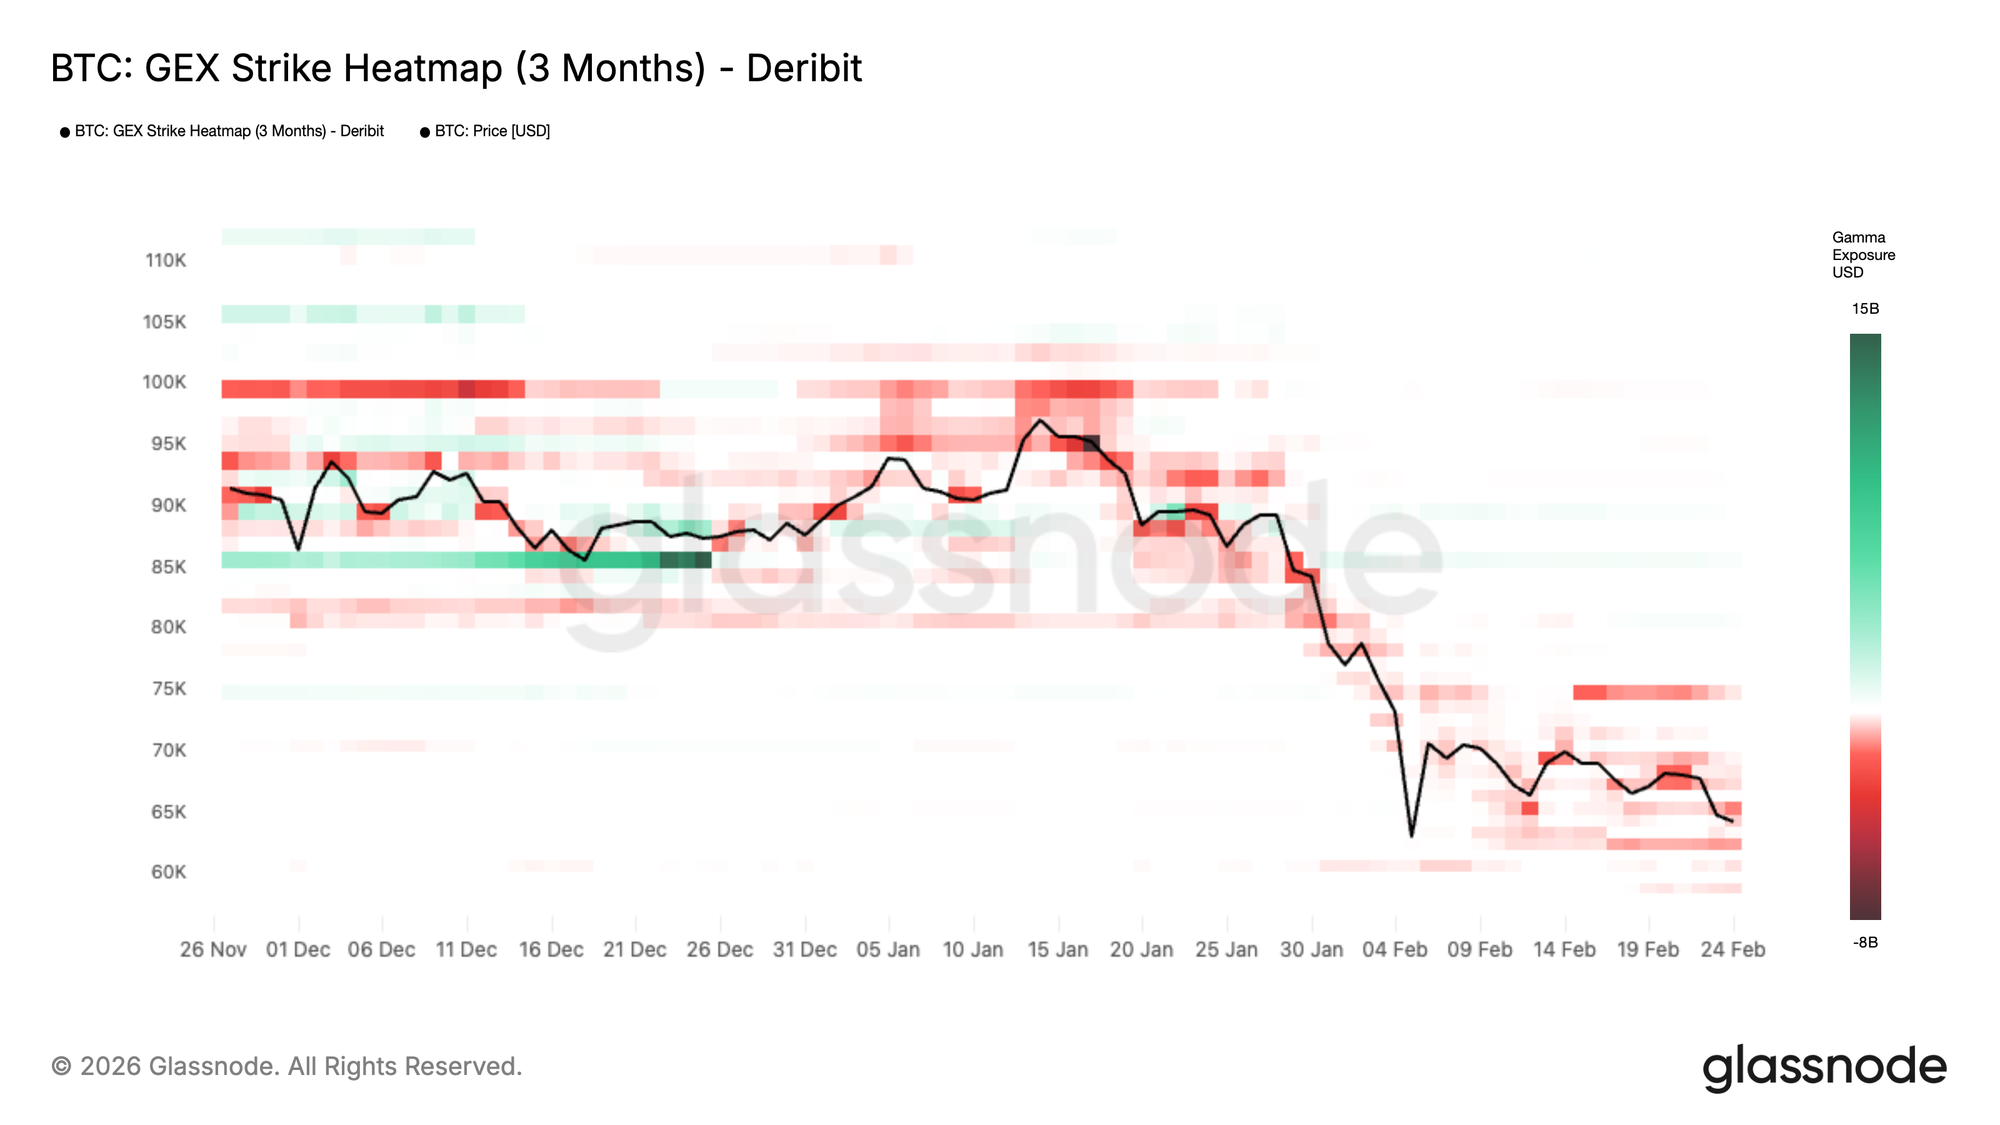
GEX Heatmap подчеркивает структурные сдвиги режима
В то время как текущее позиционирование показывает net short gamma environment (среду чистой короткой гаммы), GEX Heatmap помогает поместить это в более широкий структурный контекст.
Этот график отслеживает, как экспоушер гаммы дилера evolved (развивался) за последние три месяца, highlighting (подчеркивая) зоны, где волатильность механически подавляется или усиливается.
В декабре появились clear positive gamma bands (четкие полосы положительной гаммы) вокруг 85K, показанные зеленым. Они действовали как классические gamma walls (стены гаммы). Дилеры были структурно long gamma (длинными по гамме), имели стимул продавать силу и покупать слабость. Этот поток dampened volatility (гасил волатильность) и помогал anchor price (якорить цену) в tight range (узком диапазоне). Стена не сломалась. Она просто сошла на нет по истечении срока действия опционов на конец года, удалив стабилизирующий эффект и позволив структуре reset (сброситься).
Более recently (недавно) heatmap (тепловая карта) сместилась в сторону более глубоких red bands (красных полос) во время спада с января по февраль. Expanding negative gamma (Расширяющаяся негативная гамма) вокруг и ниже спота сигнализировала о режиме, где хеджирование дилеров reinforced (усиливало) движение, позволяя волатильности expand (расширяться), а momentum (импульсу) – accelerate (ускоряться).
Заключение
Биткоин остается в структурно оборонительной фазе консолидации. Хотя цена продолжает находить поддержку в пределах зоны спроса $60k–$69k, он-чейн compression profit (сжатие прибыли), weak breadth (слабая широта) и moderated large-holder accumulation (умеренное накопление крупными держателями) highlight (подчеркивают) хрупкую убежденность beneath the surface (под поверхностью).
Давление spot sell (спотовых продаж) и устойчивые оттоки ETF подтверждают, что structural demand (структурный спрос) остается constrained (ограниченным), даже несмотря на то, что позиционирование на деривативах reset (сбросилось) и паническое хеджирование faded (сошло на нет). Рынок стабилизируется, но еще не укрепляется.
Для emergence (появления) устойчивого восстановления вверх потребуются renewed spot absorption (возобновленное поглощение на споте), sustained large-entity accumulation (устойчивое накопление крупными entities) и clear shift (четкий сдвиг) в институциональных потоках. До тех пор range-bound price action (ценовое действие в диапазоне) между ключевыми valuation anchors (якорями оценки) остается dominant structural theme (доминирующей структурной темой).
Отказ от ответственности: Этот отчет не предоставляет каких-либо инвестиционных рекомендаций. Все данные предоставляются исключительно в информационных и образовательных целях. Ни одно инвестиционное решение не должно основываться на информации, предоставленной здесь, и вы solely responsible (единолично несете ответственность) за свои собственные инвестиционные решения.
Балансы бирж, представленные здесь, получены из comprehensive database (всеобъемлющей базы данных) адресных меток Glassnode, которые собираются как через официально опубликованную информацию бирж, так и через proprietary clustering algorithms (фирменные алгоритмы кластеризации). Хотя мы стремимся обеспечить максимальную точность в представлении биржевых балансов, важно отметить, что эти цифры могут не всегда охватывать всю entirety (полноту) резервов биржи, особенно когда биржи refrain from disclosing (воздерживаются от раскрытия) своих официальных адресов. Мы призываем пользователей exercise caution and discretion (проявлять осторожность и осмотрительность) при использовании этих метрик. Glassnode не несет ответственности за любые discrepancies (расхождения) или potential inaccuracies (потенциальные неточности).
Пожалуйста, прочитайте наше Transparency Notice (Уведомление о прозрачности) при использовании биржевых данных.