Автор: Клод, Deep Chao TechFlow
Введение Deep Chao: Коэффициент CAPE индекса S&P 500 достиг 39, что является самым высоким уровнем со времен пузыря доткомов в 2000 году; «Индикатор Баффетта» превысил 230%, установив новый исторический рекорд; десять крупнейших компонентов индекса составляют более 35% его веса, что является максимальной концентрацией в современной истории рынка. Множество индикаторов оценки одновременно сигнализируют о перегреве, но на Уолл-стрит мнения резко разделились: одни считают, что рост прибылей от ИИ оправдывает премию, другие видят в этом классический признак вершины пузыря.
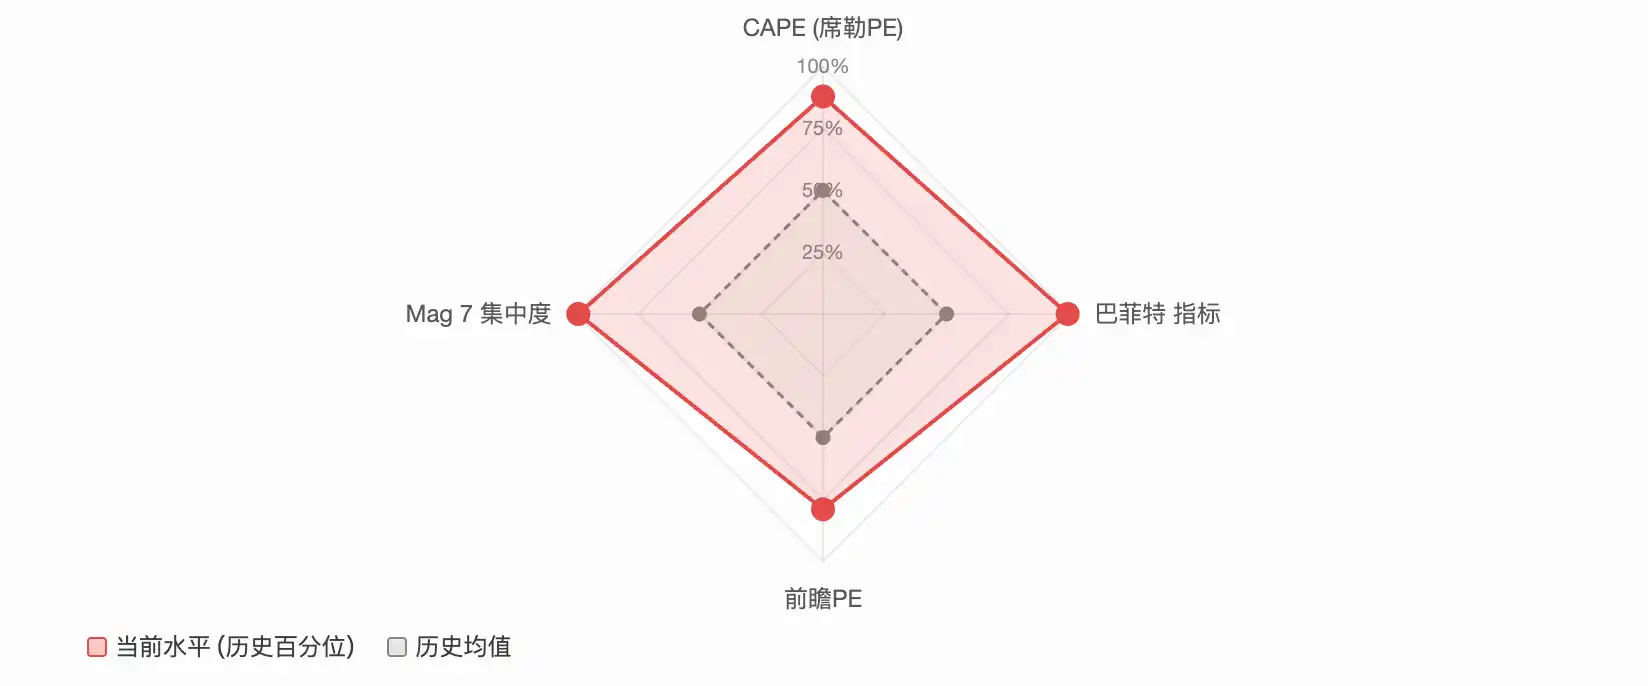
S&P 500 находится в редком состоянии: почти все основные индикаторы оценки одновременно сигнализируют об опасности.
CAPE (циклически скорректированное отношение P/E) приближается к 40, что является самым высоким уровнем со времен пузыря доткомов; «Индикатор Баффетта» (отношение рыночной капитализации к ВВП) превысил 230%, обновив исторический рекорд; десять крупнейших компонентов составляют более 35% веса индекса, а концентрация рынка находится на беспрецедентном в современной финансовой истории уровне. Пост в сообществе Reddit r/stocks охарактеризовал текущий рынок как «самое перегретое состояние в истории», собрав более 2100 лайков и 640 комментариев. Обсуждение сосредоточено на одном ключевом вопросе:
Это сигнал о вершине бычьего рынка или начало новой парадигмы, движимой ИИ?
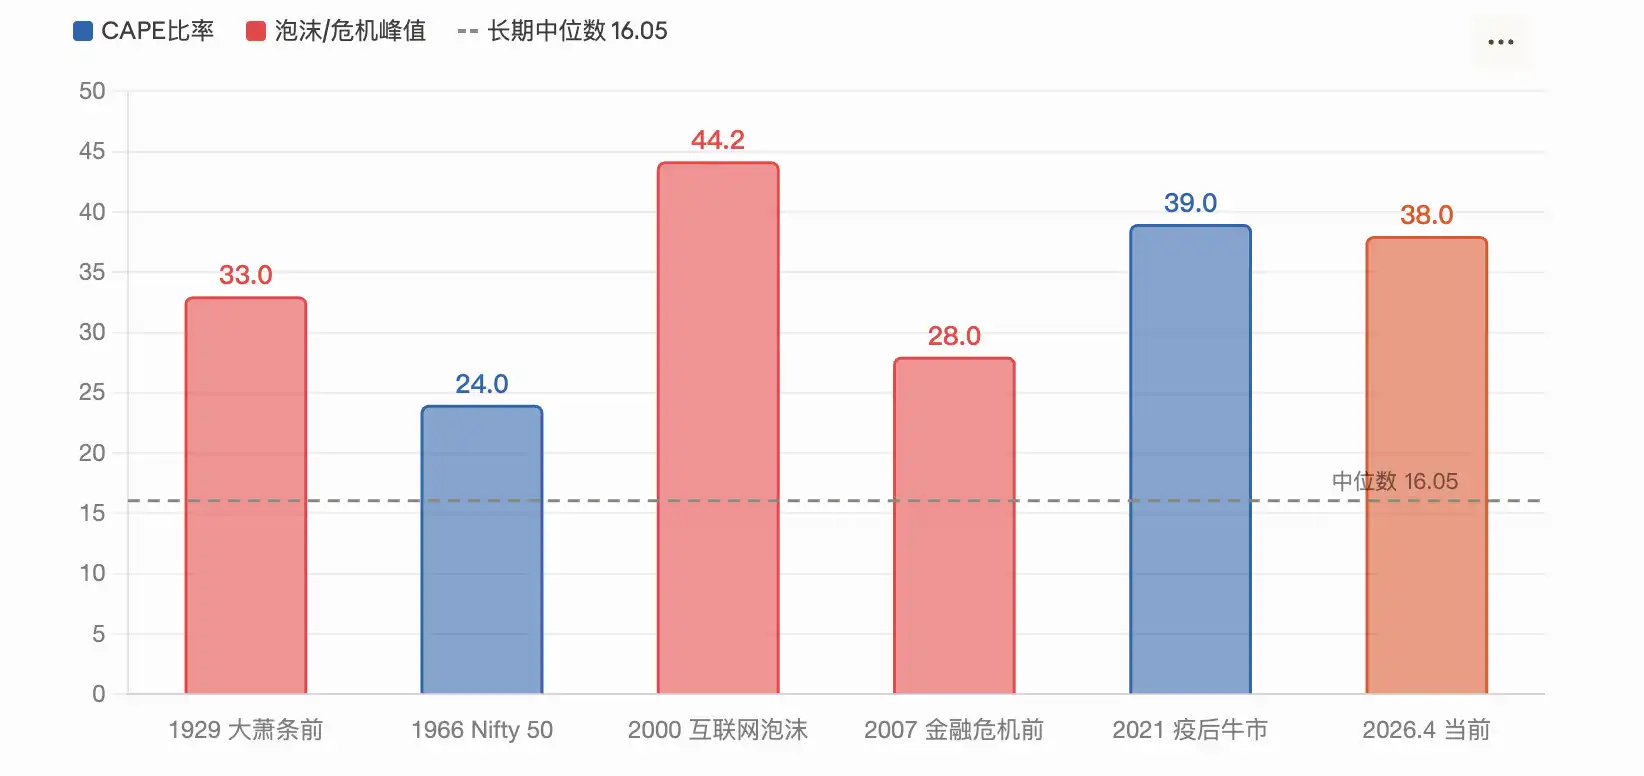
Коэффициент CAPE достиг 39, уступая только пику пузыря доткомов 2000 года
Циклически скорректированное отношение P/E (CAPE) — это показатель оценки, разработанный лауреатом Нобелевской премии по экономике Робертом Шиллером. Он рассчитывает отношение цены к прибыли на основе средней прибыли за последние 10 лет с поправкой на инфляцию, чтобы устранить влияние краткосрочных экономических циклов.
Согласно отчету Motley Fool за март, коэффициент CAPE для S&P 500 в феврале достиг 39,2. По данным GuruFocus на 1 апреля, этот показатель составил 38,66. Оба значения являются вторыми по величине в истории, уступая только пику пузыря доткомов в 2000 году (44,2), в то время как долгосрочная медиана составляет всего 16,05.
Исторически CAPE достигал подобных высот лишь дважды: в конце 1920-х годов (после чего последовала Великая депрессия) и в 2000 году (после лопнувшего пузыря доткомов S&P 500 упал на 49% за два с половиной года). Согласно исследовательской модели Шиллера, текущий уровень CAPE соответствует будущей годовой доходности всего около 2%.
Анализ Motley Fool указывает, что сам Шиллер выражал обеспокоенность, когда CAPE превышал 25, отмечая, что с 1881 года было лишь три периода, когда он превышал этот уровень: 1929, 1999 и примерно 2007 годы.
Тем не менее, отчет IndexBox также признает, что высокий CAPE не обязательно означает неминуемый обвал, поскольку после того, как этот показатель превысил 30 в конце 2023 года, рынок вырос еще более чем на 40%.
«Индикатор Баффетта» превысил 230%, установив рекорд за полвека
Баффетт в интервью журналу Fortune в 2001 году назвал отношение рыночной капитализации к ВВП «единственным лучшим показателем оценки». Тогда он suggested, что диапазон 75%-90% является разумным, а превышение 120% означает переоцененность рынка.
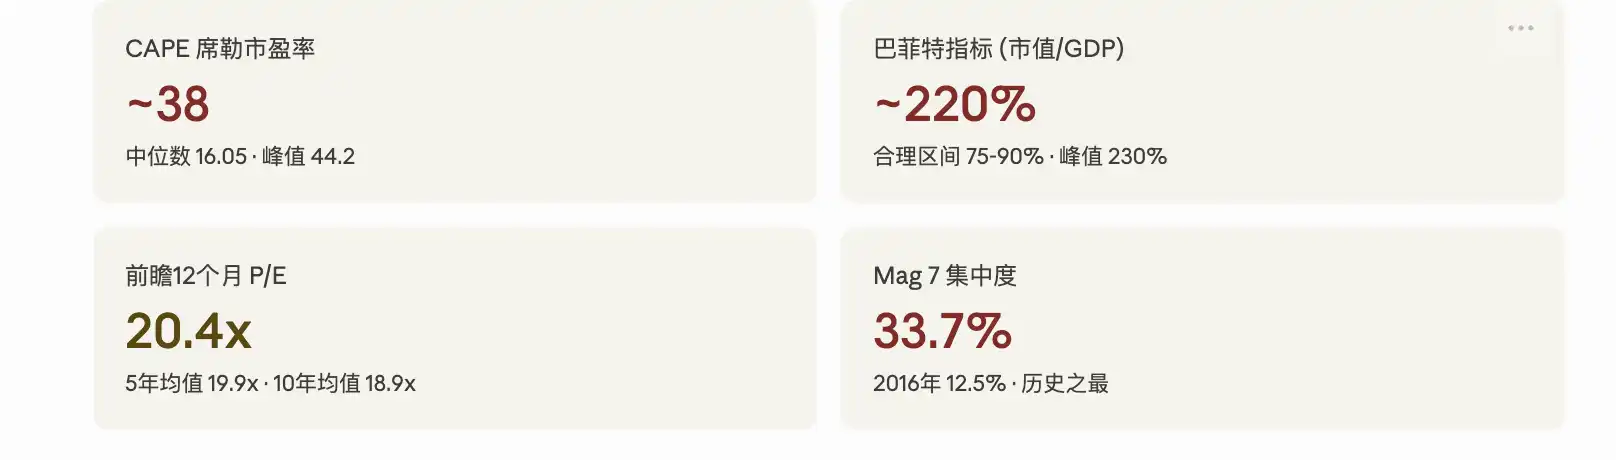
Согласно данным Advisor Perspectives, к началу 2026 года этот показатель一度 достиг 230,3%, что является самым высоким уровнем за всю историю наблюдений, превышая линию тренда примерно на 2,09 стандартных отклонения и определяясь как «серьезно переоцененный». Последние данные за март снизились до 227,5%, оставаясь вторым по величине значением в истории. На основе этого соотношения GuruFocus прогнозирует, что годовая доходность американских акций в следующие 8 лет составит примерно -0,3%.
По данным GuruFocus на 14 апреля, этот показатель составляет 219,5%. Критики указывают, что этот показатель не fully учитывает два структурных изменения: firstly, прибыльность американских компаний значительно выросла по сравнению с исторической нормой, и secondly, крупные американские компании все чаще получают доход из-за рубежа (что увеличивает рыночную капитализацию, но не отражается в отечественном ВВП). Но сторонники считают, что даже после устранения тренда текущие показатели остаются в экстремальном историческом диапазоне.
Концентрация рынка достигла максимума в современной истории, доля «Великолепной семерки» превысила 30%
Оценка — лишь одно измерение проблемы. Структурные риски рынка同样 вызывают беспокойство.
По данным AhaSignals на 13 апреля, десять крупнейших компонентов S&P 500 составляют 35,59% веса индекса, пятерка крупнейших — 25,97%, а «Великолепная семерка» (Magnificent 7) — 30,44%. Сводный индекс риска концентрации (ACRI), рассчитанный этой организацией, составляет 81/100, что находится на «критическом» уровне. По данным Motley Fool за апрель, доля Mag 7 в S&P 500 выросла с 12,5% в 2016 году до нынешних 33,7%.
В отчете CNBC за декабрь 2025 года цитируется предупреждение главного инвестиционного директора Kathmere Capital Ника Райдера: инвесторы по-прежнему чрезмерно сконцентрированы на Mag 7, он рекомендует充分 диверсифицировать портфель beyond американских акций роста крупной капитализации. Президент Yardeni Research Эд Ярдени в то же время рекомендовал инвесторам снижать долю Mag 7 и увеличивать долю «остальных 493» (Impressive 493).
Реальный риск, связанный с концентрацией, заключается в том, что когда несколько акций определяют движение индекса, их падение непропорционально сильно тянет за собой весь рынок. Первый квартал 2026 года уже partially подтвердил это. Согласно отчету 24/7 Wall St, Microsoft, Amazon и Nvidia с начала года упали примерно на 20%, 9% и 6% соответственно, что способствовало падению взвешенного по рыночной капитализации S&P 500 почти на 4%, в то время как равновзвешенный S&P 500 (RSP) за тот же период slightly вырос.
Два лагеря противостоят друг другу: «История повторяется» или «На этот раз все иначе»
Оценка этих данных привела к резкому расколу в суждениях на Уолл-стрит.
Ядро аргументации медведей — возврат к среднему значению оценки. Соучредитель GMO Джереми Грэнtham в своем последнем исследовании четко определил текущий рынок как крупный пузырь, движимый ИИ. Он指出, что фактические доходы от инвестиций в ИИ намного не соответствуют масштабам капитальных затрат, OpenAI прогнозирует, что ее собственные операционные убытки в 2026 году составят 17 миллиардов долларов, а в 2027 году увеличатся до 35 миллиардов долларов. GMO считает, что классические сигналы вершины пузыря (крах спекулятивных акций, значительное outperformance качественных акций) еще не проявились в полной мере, но это означает лишь, что пузырь еще не достиг пика, а не то, что его не существует.
Циклический анализ IO Fund также склоняется к осторожности. В отчете организации指出, что 2026 год одновременно находится на пересечении 60-летнего цикла Ганна и 4-летнего президентского цикла, и каждая акция из Mag 7 сформировала вершину в период с июля 2025 года по февраль 2026 года, в то время как индекс обновлял последние максимумы, ключевые компоненты уже quietly снижались, что является «классическим предупреждающим сигналом конца бычьего рынка».
Быки же强调 фундаментальные показатели прибыли. Согласно данным FactSet за апрель, форвардное отношение P/E S&P 500 на 12 месяцев составляет 20,4x, что хотя и выше 10-летнего среднего значения 18,9x, но снизилось по сравнению с 22x в конце 2025 года. Аналитики прогнозируют рост прибыли S&P 500 на 17,6% за 2026 год, и если эти ожидания оправдаются, высокая оценка может быть partially оправдана.
Суждение директора по глобальным макроисследованиям Fidelity Юрриена Тиммера相对 умеренное: с начала конфликта с Ираном максимальная просадка S&P 500 составила менее 10%, такая просадка в среднем происходит раз в год в истории. Ожидания прибыли все еще растут годовыми темпами 17% и пока не пострадали существенно от геополитических заголовков.
Команда по управлению инвестициями Morgan Stanley также в своем прогнозе на 2026 год指出, что большинство бычьих рынков длятся от 5 до 7 лет, и бычьи рынки, вступающие в четвертый год, в истории всегда показывали положительную доходность. Доля неамериканских акций в портфеле банка выросла до исторического максимума.
BlackRock заявила, что рост акций технологического сектора в 2025 году в основном был driven ростом прибыли, а не расширением оценки, и текущая оценка является разумной based на ожиданиях роста.
Наложение геополитических потрясений: война с Ираном и риск стагфляции
Помимо споров об оценке, макросреда добавляет дополнительную неопределенность.
Конфликт с Ираном подтолкнул цены на нефть выше $100 за баррель, а S&P 500 в марте一度跌破 200-дневной скользящей средней. Согласно отчету FinancialContent, ФРС на мартовском заседании сохранила «ястребиную паузу», обновленная диаграмма точечных прогнозов по ставкам предполагает лишь одно дополнительное снижение в оставшуюся часть 2026 года. UBS в отчете от 17 марта охарактеризовала недавнюю волатильность как «необходимую перезагрузку завышенной оценки», а не начало медвежьего рынка, сохранив целевую цену на конец года в 7700 пунктов.
Goldman Sachs повысила вероятность рецессии в следующие 12 месяцев примерно до 30%. Это резонирует с предупреждениями индикаторов оценки: если экономический спад совпадет с высокой оценкой, среднее историческое падение S&P 500 с пика до trough составляет 32%. Но если прибыль продолжит расти (консенсус-прогноз FactSet составляет 17%), значительные коррекции в истории往往 были ограниченными по amplitude и быстро восстанавливались.
Для инвесторов противоречивость сигналов уже вполне очевидна. Долгосрочные индикаторы оценки почти все сигнализируют об опасности, но краткосрочные и среднесрочные данные о прибыли остаются сильными. Рынок подошел к перекрестку, где «оценка говорит нет», а «прибыль говорит да». Результат зависит от того, смогут ли капитальные затраты на ИИ превратиться в устойчивую прибыль и перейдут ли геополитические потрясения в最终 в рецессию.


