Рынок никогда не лжёт, он просто молчит.
Когда цена задерживается в ключевой зоне, и быки, и медведи ждут ответа.
На прошлой неделе биткоин завершил широкий диапазон колебаний в ключевой зоне 79 500 – 80 600 долларов, как мы и прогнозировали, подтвердив эффективность технической логики рынком. Однако подтверждение — это лишь начало. Истинная игра начинается на этой неделе.
Дневная корректирующая структура BTC стоит на распутье трёх возможных путей: станет ли она стартовой точкой новой восходящей волны или же промежуточной стадией более глубокой коррекции? Волновая разметка может дать рамки, но окончательное слово всегда за ценой. Что касается HYPE, его семисегментная структура чётко прослеживается, и преодоление уровня 45,76 доллара или отскок от него станут ключевыми переменными, за которыми стоит следить на этой неделе.
В сегодняшней статье мы продолжим анализировать с точки зрения множества таймфреймов, систематизируя структуры, определяя направления и готовя планы действий. Стратегия готова, ритм держим свой.
Ключевые тезисы для торговли на этой неделе:
• Анализ структуры движения BTC на разных таймфреймах (подробности в Части 1)
• Прогноз по BTC на неделю и стратегии для среднесрочных и краткосрочных операций (подробности в Части 2)
• Анализ дневной структуры движения HYPE (подробности в Части 3)
• Прогноз по HYPE на неделю и краткосрочная торговая стратегия (подробности в Части 4)
Проверка рыночных прогнозов и стратегий прошлой недели:
• Проверка прогноза по движению BTC: В прошлой статье мы отмечали, что следует внимательно следить за результатом борьбы между быками и медведями в ключевой зоне 79 500 – 80 600 долларов и предполагали высокую вероятность широкого диапазона колебаний. Текущее движение рынка в целом подтвердило наш предыдущий прогноз.
1. Анализ структуры движения биткоина на разных таймфреймах
1. Анализ дневной структуры движения BTC: (Три варианта волновой разметки для будущего движения BTC)
Биткоин _ График дневных свечей:
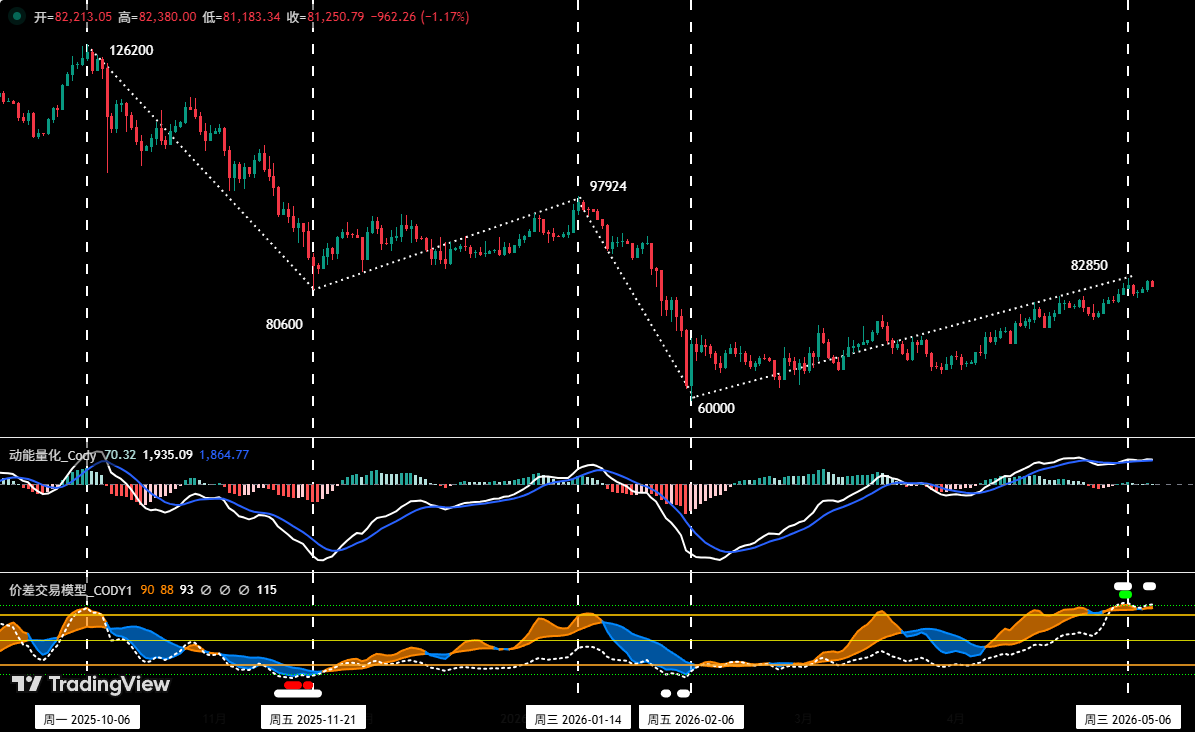
Рисунок 1
Как показано на (Рисунке 1), с момента достижения максимума в 126 200 долларов в октябре 2025 года биткоин вошёл в корректирующий цикл продолжительностью около 7 месяцев (216 дней), и в отношении будущего движения на рынке существуют явные разногласия. Сторонники медвежьего сценария считают, что нисходящий тренд ещё не завершился, и после окончания недавнего отскока цена продолжит корректироваться, пробив минимум в 60 000 долларов. Быки же полагают, что коррекция, начавшаяся от уровня 126 200 долларов, уже завершилась на отметке 60 000 долларов, и тренд коррекции развернулся. Отскок, начавшийся в феврале, является стартом новой восходящей тенденции. Далее мы, основываясь на правилах волновой теории, проанализируем эту дневную корректирующую структуру и предложим три технических варианта развития событий для вашего рассмотрения.
1. Сценарий 1: Коррекция завершена, запускается новая восходящая волна (Версия быков)
Согласно этой точке зрения: дневная коррекция, начавшаяся от предыдущего максимума 126 200 долларов, завершилась трёхволновой структурой A-B-C, где волна C закончилась на уровне 60 000 долларов, и в настоящее время формируется большая волна I (то есть стартовая волна роста).
• Волна A (нисходящая): 126 200 долларов (06.10.2025) – 80 600 долларов (21.11.2025), длительность 46 дней, максимальное падение ~36%.
• Волна B (коррекционная/отскок): 80 600 долларов (21.11.2025) – 97 924 доллара (14.01.2026), длительность 54 дня, максимальный рост ~21,5%.
• Волна C (нисходящая): 97 924 доллара (14.01.2026) – 60 000 долларов (06.02.2026), длительность 23 дня, максимальное падение ~38,7%.
• Большая волна I (стартовая волна роста): 60 000 долларов (06.02.2026) – настоящее время, длительность 94 дня, максимальный рост за период ~38,1%, всё ещё формируется.
• Потенциальная большая волна II (корректирующая волна): корректирующая волна, которая запустится после завершения роста большой волны I. Её минимум не пробьёт уровень 60 000 долларов.
2. Сценарий 2: Сложная пятиволновая корректирующая структура, текущая стадия — отскок волны D (Версия медведей, вариант 1)
Согласно этой точке зрения: дневная коррекция, начавшаяся от предыдущего максимума 126 200 долларов, может завершиться пятиволновой структурой A-B-C-D-E, и в настоящее время формируется отскок волны D.
• Волна A (нисходящая): 126 200 долларов (06.10.2025) – 80 600 долларов (21.11.2025), длительность 46 дней, максимальное падение ~36%.
• Волна B (коррекционная/отскок): 80 600 долларов (21.11.2025) – 97 924 доллара (14.01.2026), длительность 54 дня, максимальный рост ~21,5%.
• Волна C (нисходящая): 97 924 доллара (14.01.2026) – 60 000 долларов (06.02.2026), длительность 23 дня, максимальное падение ~38,7%.
• Волна D (коррекционная/отскок): 60 000 долларов (06.02.2026) – настоящее время, длительность 94 дня, максимальный рост за период ~38,1%, всё ещё формируется.
• Потенциальная волна E (нисходящая): корректирующая волна, которая запустится после завершения отскока волны D. Её минимум может пробить уровень 60 000 долларов.
3. Сценарий 3: Коррекционная структура большего уровня (например, недельного), текущая стадия — отскок волны B (Версия медведей, вариант 2)
Согласно этой точке зрения: дневная коррекция, начавшаяся от предыдущего максимума 126 200 долларов, может являться частью более крупной трёхволновой корректирующей структуры A-B-C большего уровня, и в настоящее время формируется отскок волны B.
• Волна A (нисходящая): 126 200 долларов (06.10.2025) – 60 000 долларов (06.02.2026), длительность 112 дней, максимальное падение ~52,5%.
• Волна B (коррекционная/отскок): 60 000 долларов (06.02.2026) – настоящее время, длительность 94 дня, максимальный рост за период ~38,1%, всё ещё формируется.
• Потенциальная волна C (нисходящая): корректирующая волна, которая запустится после завершения отскока волны B. Её минимум может пробить уровень 60 000 долларов.
4. Итог:
• С точки зрения временных правил волновой теории и гармоничности формы, в Сценарии 2 волны B и D являются коррекционными/отскоками одного уровня, однако текущая длительность отскока волны D (94 дня) уже существенно превышает длительность отскока волны B (54 дня). Таким образом, чрезмерное удлинение волны D во временном измерении нарушает сбалансированность волновой структуры, что значительно снижает вероятность реализации данного сценария.
• Исходя из вышеизложенного анализа, если исключить Сценарий 2, то вероятность выбора рынком Сценария 1 (быки) и Сценария 3 (медведи) соответственно возрастает. Что касается того, какой из них более вероятен, это требует комплексной оценки большего числа параметров, которую мы проведём в следующем еженедельном обзоре.
2. Глубокий анализ структуры движения BTC на часовом таймфрейме: (анализ на таймфрейме 4 часа)
Биткоин _ График 4-часовых свечей
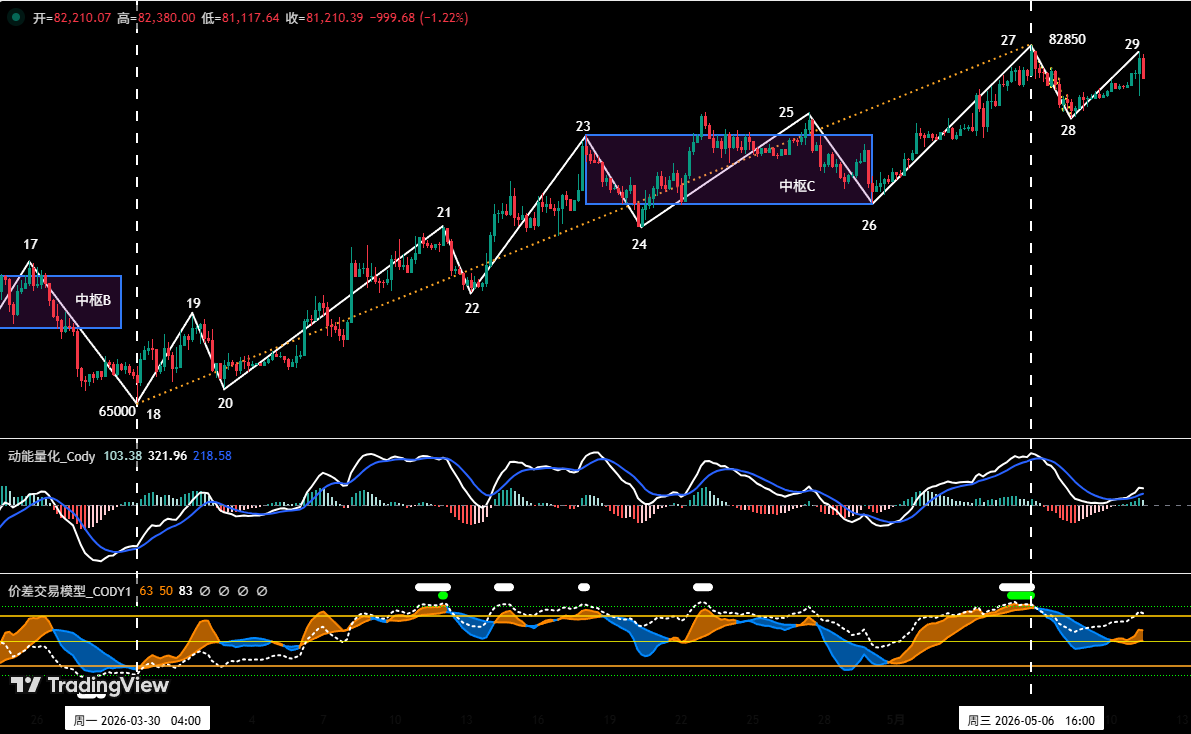
Рисунок 2
Как показано на (Рисунке 2), цена в настоящее время находится выше зоны консолидации C и формирует сегмент 28-29.
• Если цена надёжно закрепится выше поддержки верхней границы зоны консолидации C (примерно 78 500 долларов), сохранится модель широкого диапазона колебаний на высоких уровнях.
• Если цена надёжно пробивает поддержку нижней границы зоны консолидации C (примерно 75 000 долларов), возможно, начнётся дневная коррекция.
2. Прогноз по биткоину на неделю и торговая стратегия
1. Прогноз движения BTC на неделю:
Ключевой тезис недели: Ключ к движению на этой неделе заключается в наблюдении за результатом борьбы между быками и медведями за верхнюю и нижнюю границы зоны консолидации C. Результат этой борьбы может служить важным основанием для суждения о том, сможет ли цена продолжить отскок или же развернётся в сторону коррекции.
2. Ключевые уровни сопротивления:
• Первая зона сопротивления: 83 500 ~ 84 500 долларов (зона интенсивных торгов прошлых периодов)
• Вторая зона сопротивления: 89 000 ~ 90 500 долларов (предыдущая платформа консолидации)
3. Ключевые уровни поддержки:
• Первый уровень поддержки: 78 500 ~ 79 500 долларов (вблизи верхней границы зоны консолидации)
• Второй уровень поддержки: 73 500 ~ 75 000 долларов (важный уровень поддержки прошлых периодов)
• Третий уровень поддержки: 69 500 ~ 70 500 долларов (важный уровень поддержки прошлых периодов)
4. Торговая стратегия на неделю (исключая влияние внезапных новостей)
1. Среднесрочная стратегия:
Биткоин _ График дневных свечей: (Модель мониторинга позиций)
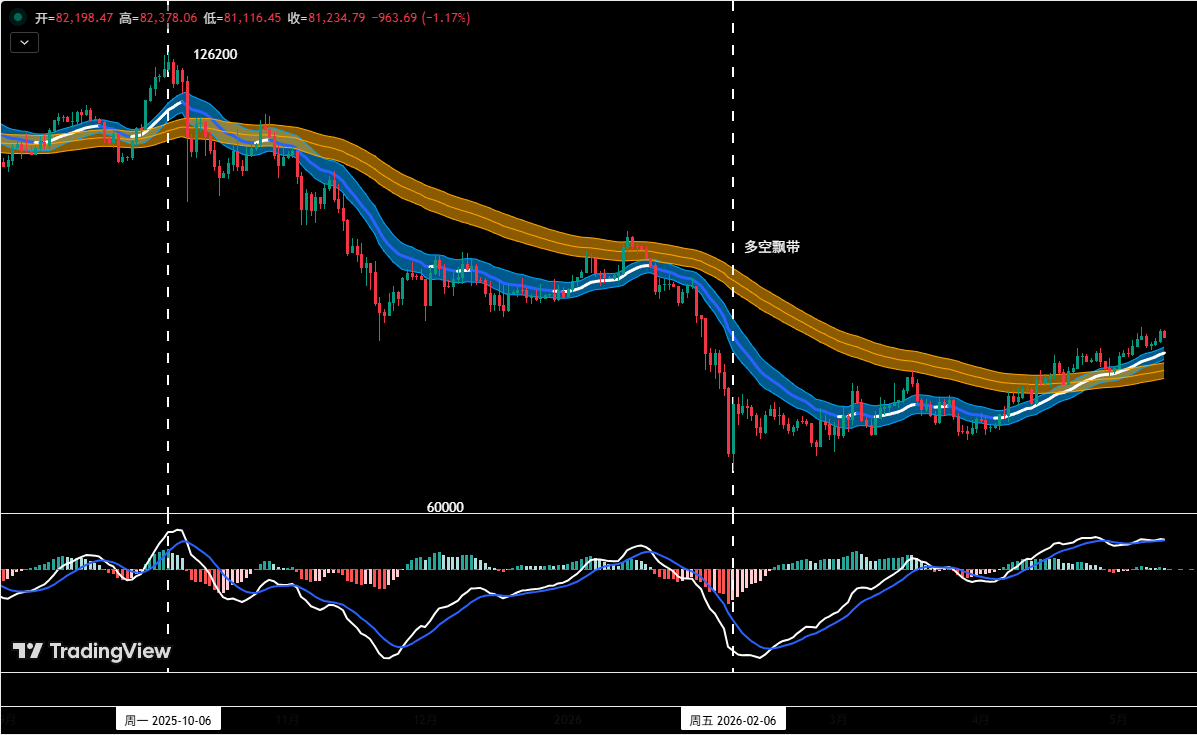
Рисунок 3
Модель мониторинга позиций: Как показано на (Рисунке 3), согласно торговым правилам, среднесрочное направление рынка ещё не определено. На этой неделе для среднесрочных позиций сохраняется стратегия наблюдения без открытия позиций. Терпеливо ждём прояснения направления перед входом на рынок, избегаем покупки на пиках и продажи на дне.
2. Краткосрочная стратегия: Используя 30% капитала, устанавливая стоп-лосс, и ориентируясь на уровни поддержки и сопротивления, ищем возможности для получения «разницы в цене» (используя таймфреймы 30 минут / 60 минут в качестве операционных периодов).
3. Для динамичного реагирования на сложную эволюцию рынка в рамках краткосрочных операций мы заранее подготовили два конкретных плана действий A/B.
• План A: Надёжное закрепление выше уровня, покупка на откатах по тренду.
• Открытие позиции: Когда цена надёжно закрепится выше зоны 78 500 ~ 79 500 долларов и в сочетании с сигналом дна от количественной модели, можно открывать длинную позицию объёмом до 20%.
• Управление рисками: Начальный стоп-лосс устанавливается ниже 78 500 долларов.
• Закрытие позиции: Когда отскок достигнет важной зоны сопротивления и в сочетании с сигналами модели, можно постепенно фиксировать прибыль.
• План B: Надёжный пробой поддержки, продажа на отскоках.
• Открытие позиции: Когда цена надёжно пробивает поддержку зоны 73 500 ~ 75 000 долларов в сочетании с сигналом вершины от модели, можно открывать короткую позицию объёмом до 30%.
• Управление рисками: Начальный стоп-лосс устанавливается выше 76 500 долларов.
• Закрытие позиции: Когда падение достигнет важного уровня поддержки в сочетании с сигналами модели, можно постепенно фиксировать прибыль.
3. Анализ дневной структуры движения HYPE:
HYPE_ График дневных свечей
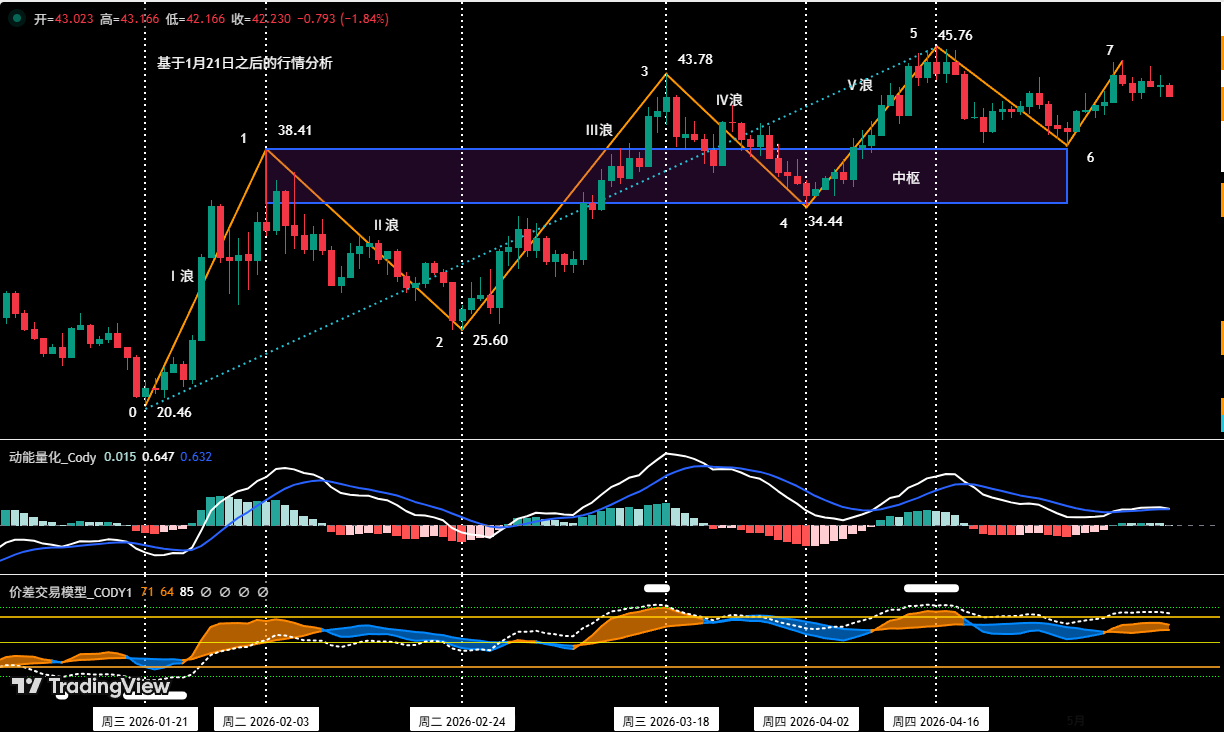
Рисунок 4
1. Как показано на (Рисунке 4), восходящее движение HYPE, начавшееся с минимума 20,46 доллара 21 января, на дневном графике можно разделить на семисегментную структуру: 0-1, 1-2, 2-3, 3-4, 4-5, 5-6, 6-7. В первых пяти сегментах цена постоянно обновляла максимумы, формируя структуру растущей консолидации; в последних двух сегментах, поскольку точка 7 (44,79 доллара) находится ниже цены точки 5 (45,76 доллара), на данный момент это рассматривается как корректирующая структура.
2. На (Рисунке 4) видно, что поскольку сегменты 1-2, 2-3, 3-4 перекрывают друг друга, они совместно формируют «восходящую зону консолидации».
4. Прогноз по HYPE на неделю и краткосрочная торговая стратегия
1. Прогноз движения HYPE на неделю:
Ключевой тезис по HYPE на неделю:
• Основное внимание — наблюдать, сможет ли цена в последующем движении преодолеть предыдущий максимум 45,76 доллара. Если пробьёт, то текущее движение всё ещё находится в рамках дневной восходящей структуры.
• Следить за борьбой между быками и медведями вблизи границ зоны консолидации.
2. Краткосрочная стратегия по HYPE на неделю:
• Краткосрочные операции на этой неделе будут строиться вокруг ключевых ценовых уровней — верхней границы зоны консолидации (38,41 доллара) и нижней границы зоны консолидации (34,44 доллара) — и их пробоев/удержаний.
• Стратегия покупки: Если цена откатится к уровню около 38,41 доллара, найдёт там поддержку, появятся признаки стабилизации и одновременно сработают сигналы дна от двух моделей, можно рассмотреть лёгкую пробную покупку. Объём позиции обязательно должен быть ниже 30%, строго соблюдается дисциплина стоп-лосса.
• Стратегия продажи: Если цена надёжно пробивает поддержку около 34,44 доллара и одновременно срабатывают сигналы вершины от двух моделей, можно рассмотреть лёгкую пробную продажу. Объём позиции обязательно должен быть ниже 30%, строго соблюдается дисциплина стоп-лосса.
5. Особые указания:
1. При открытии позиции: Немедленно установить начальный уровень стоп-лосса.
2. При достижении прибыли 1%: Переместить стоп-лосс на цену открытия позиции (точку безубыточности), обеспечивая безопасность основного капитала.
3. При достижении прибыли 2%: Переместить стоп-лосс на уровень, соответствующий прибыли 1%.
4. Непрерывное отслеживание: В дальнейшем, каждый раз когда цена приносит дополнительную прибыль в 1%, стоп-лосс синхронно перемещается на 1%, динамично защищая и фиксируя прибыль.
Финансовые рынки瞬息万变, все анализы рыночной ситуации и торговые стратегии требуют динамической корректировки. Все мнения, аналитические модели и операционные стратегии, упомянутые в данной статье, основаны на личном техническом анализе и предназначены исключительно для личного использования в качестве торгового журнала, не являясь инвестиционной рекомендацией или основанием для действий. Рынки несут риски, инвестиции требуют осторожности. Не принимайте решений на основе данной статьи.