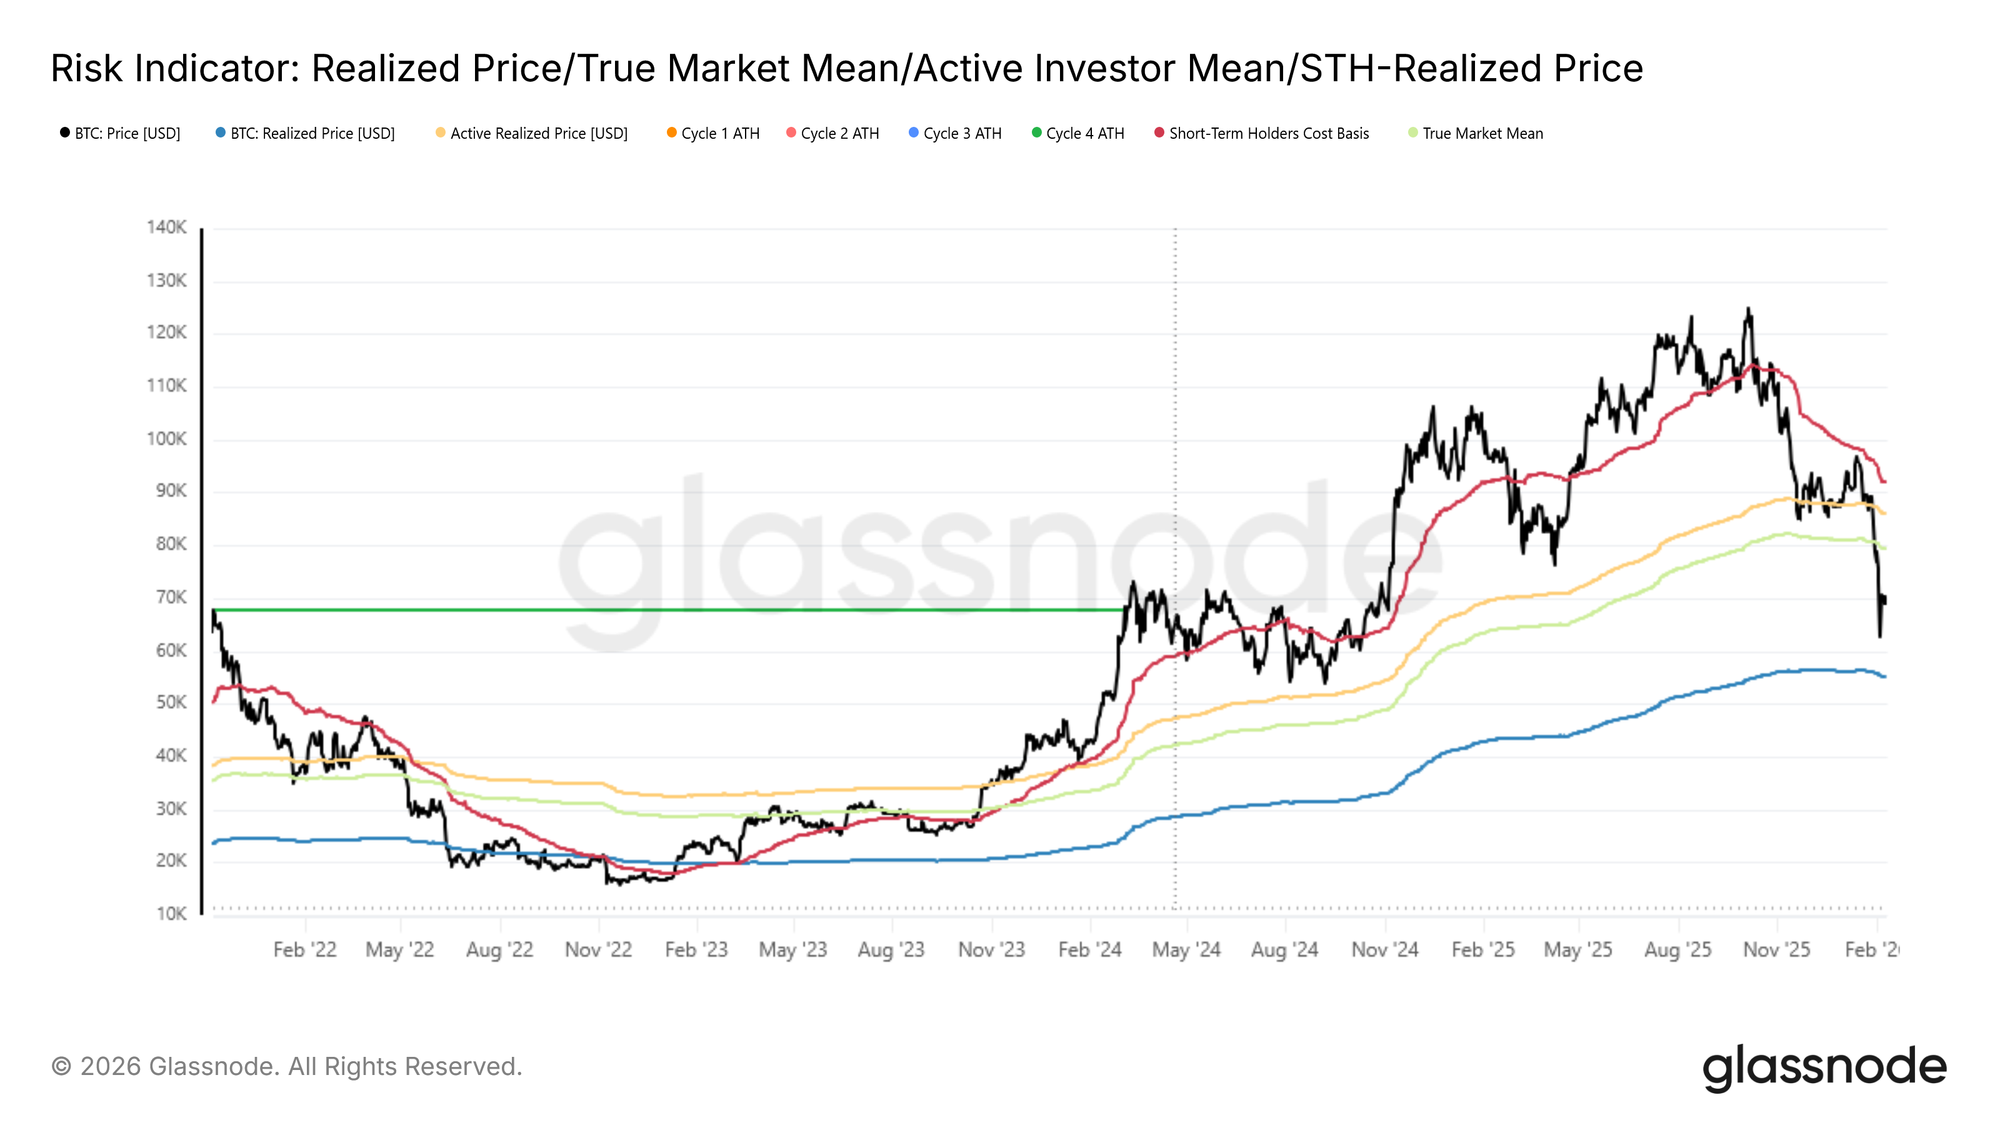
С момента достижения нового исторического максимума в начале октября Bitcoin прошел через три различные структурные фазы. Первой была резкая контракция, когда цена быстро снижалась к Истинной Рыночной Средней (True Market Mean) — уровню, который неоднократно тестировался в конце ноября 2025 года. За этим последовал продолжительный период консолидации, в течение которого цена удерживалась чуть выше этого порога до конца января 2026 года. Совсем недавно рынок вступил в третью фазу, характеризующуюся решительным пробоем ниже Истинной Рыночной Средней, что ускорило движение к региону $60 тыс.
Новый торговый диапазон
Преобладающий диапазон в упомянутой третьей фазе, в настоящее время ограниченный Истинной Рыночной Средней около $79,2 тыс. и Реализованной Ценой (Realized Price) около $55 тыс., очень напоминает структурную среду, наблюдавшуюся в первой половине 2022 года.
Аналогично второму кварталу 2022 года, ожидается, что цена продолжит колебаться в коридоре между Реализованной Ценой и Истинной Рыночной Средней, поскольку для появления новых покупателей и постепенного накопления предложения требуется время и дальнейшее сжатие.
Значимое изменение режима в краткосрочной перспективе, вероятно, потребует неординарного катализатора: либо решительного восстановления уровня Истинной Рыночной Средней около $79,2 тыс., что сигнализировало бы о возобновлении структурной силы, либо системного дисбаланса, подобного LUNA или FTX, который вынудил бы цену опуститься ниже Реализованной Цены около $55 тыс. При отсутствии таких экстремальных событий, затяжная фаза поглощения в рамках диапазона остается наиболее вероятным путем для рынка в среднесрочной перспективе.
Защита старого диапазона накопления
До сих пор давление со стороны продавцов в значительной степени поглощалось в том же осцилляторном диапазоне, который определял большую часть первой половины 2024 года, между $60 тыс. и $72 тыс. Эта повторяющаяся защита свидетельствует о растущей уверенности среди покупателей, готовых накапливать активы в этом коридоре. В конструктивном сценарии устойчивое поглощение в этом диапазоне может повторить предыдущие сильные фазы накопления, закладывая прочную основу для следующего импульсного роста.
Однако долговечность этой структуры в конечном итоге зависит от интенсивности и устойчивости спроса. То, насколько агрессивно покупатели будут входить в рынок в зоне $60–72 тыс., определит, останется ли рынок в рамках диапазона и стабилизируется, или же ослабление поглощения откроет путь к более глубокому снижению.
Риск нависающего предложения
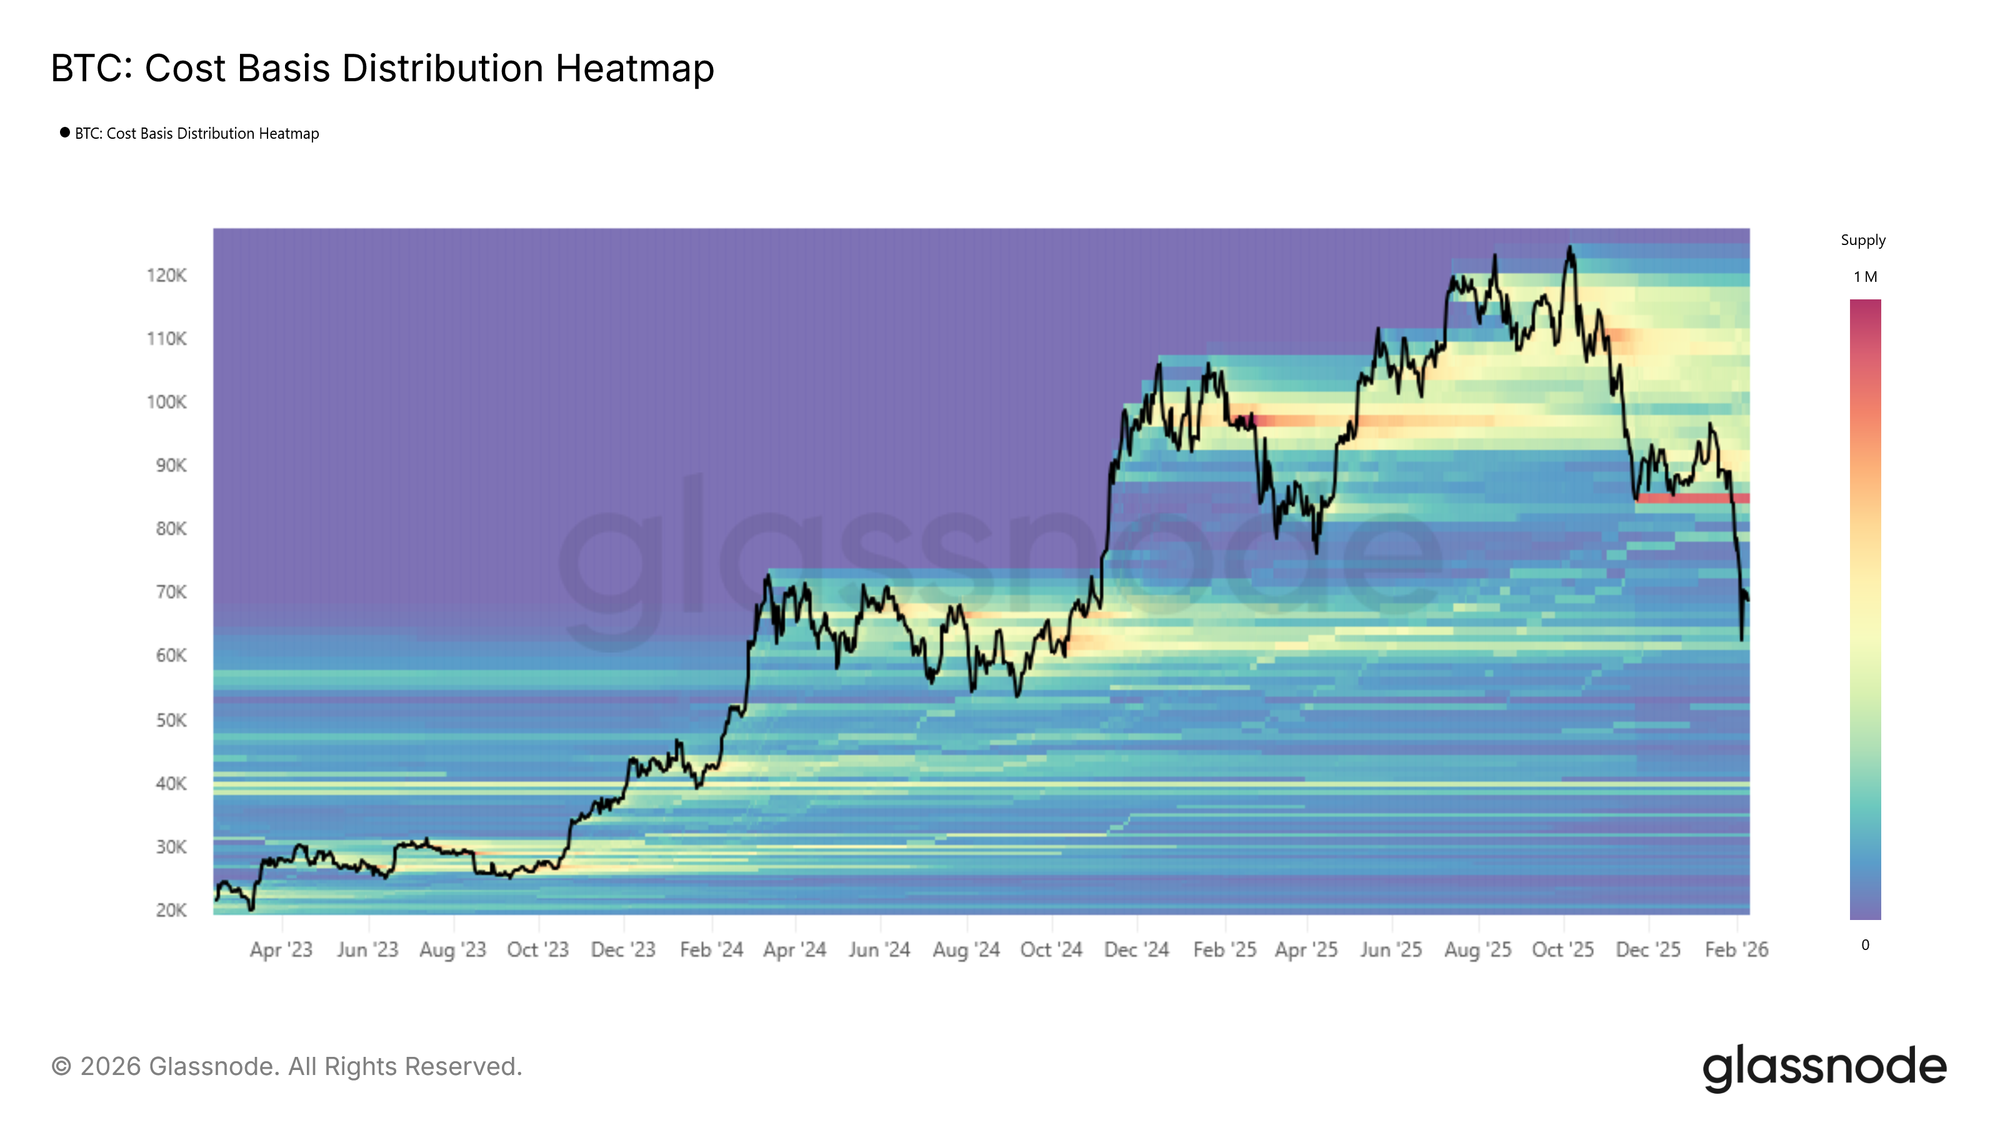
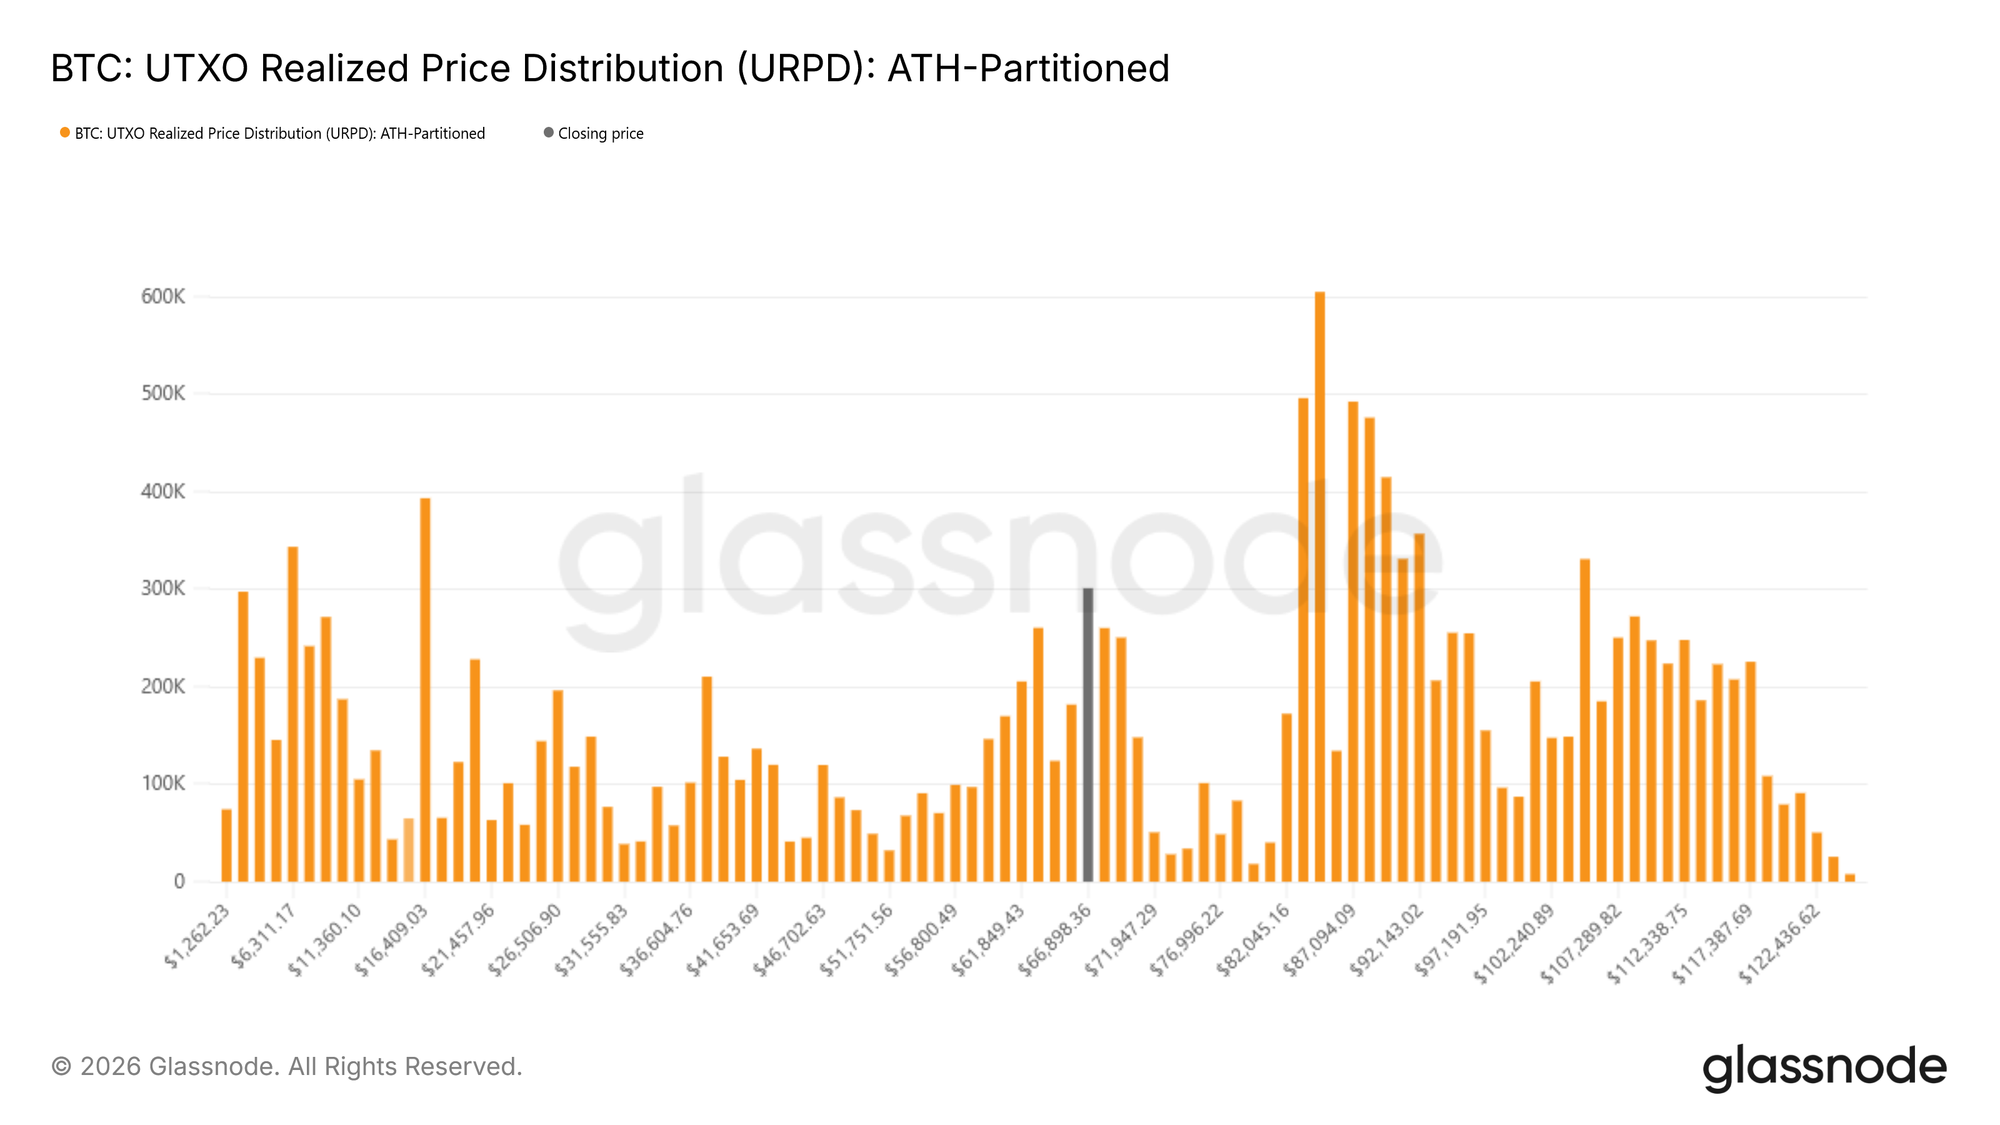
Чтобы оценить, усиливается ли спрос в коридоре $60–72 тыс., мы обращаемся к данным о распределении себестоимости. Распределение Реализованной Цены UTXO (URPD) предоставляет детализированное представление о предложении на основе цены, по которой монеты последний раз двигались, что позволяет нам идентифицировать дискретные кластеры накопления. Текущие показатели показывают, что цена до сих пор находила поддержку в плотной полосе предложения, сформированной в первой половине 2024 года, сконцентрированной между $60 тыс. и $72 тыс. Это говорит о том, что предыдущие покупатели в этом диапазоне активно защищают свои позиции.
Однако нависающее предложение структурно остается значительным. Значительные кластеры расположены между $82–97 тыс. и $100–117 тыс., представляя когорты, которые сейчас несут существенные нереализованные убытки. Эти зоны могут выступать в качестве скрытого давления со стороны продавцов, особенно если prolonged time under water (длительное нахождение "под водой") или возобновленная нисходящая волатильность спровоцируют дальнейшую капитуляцию.
Отслеживание вершин медвежьего рынка
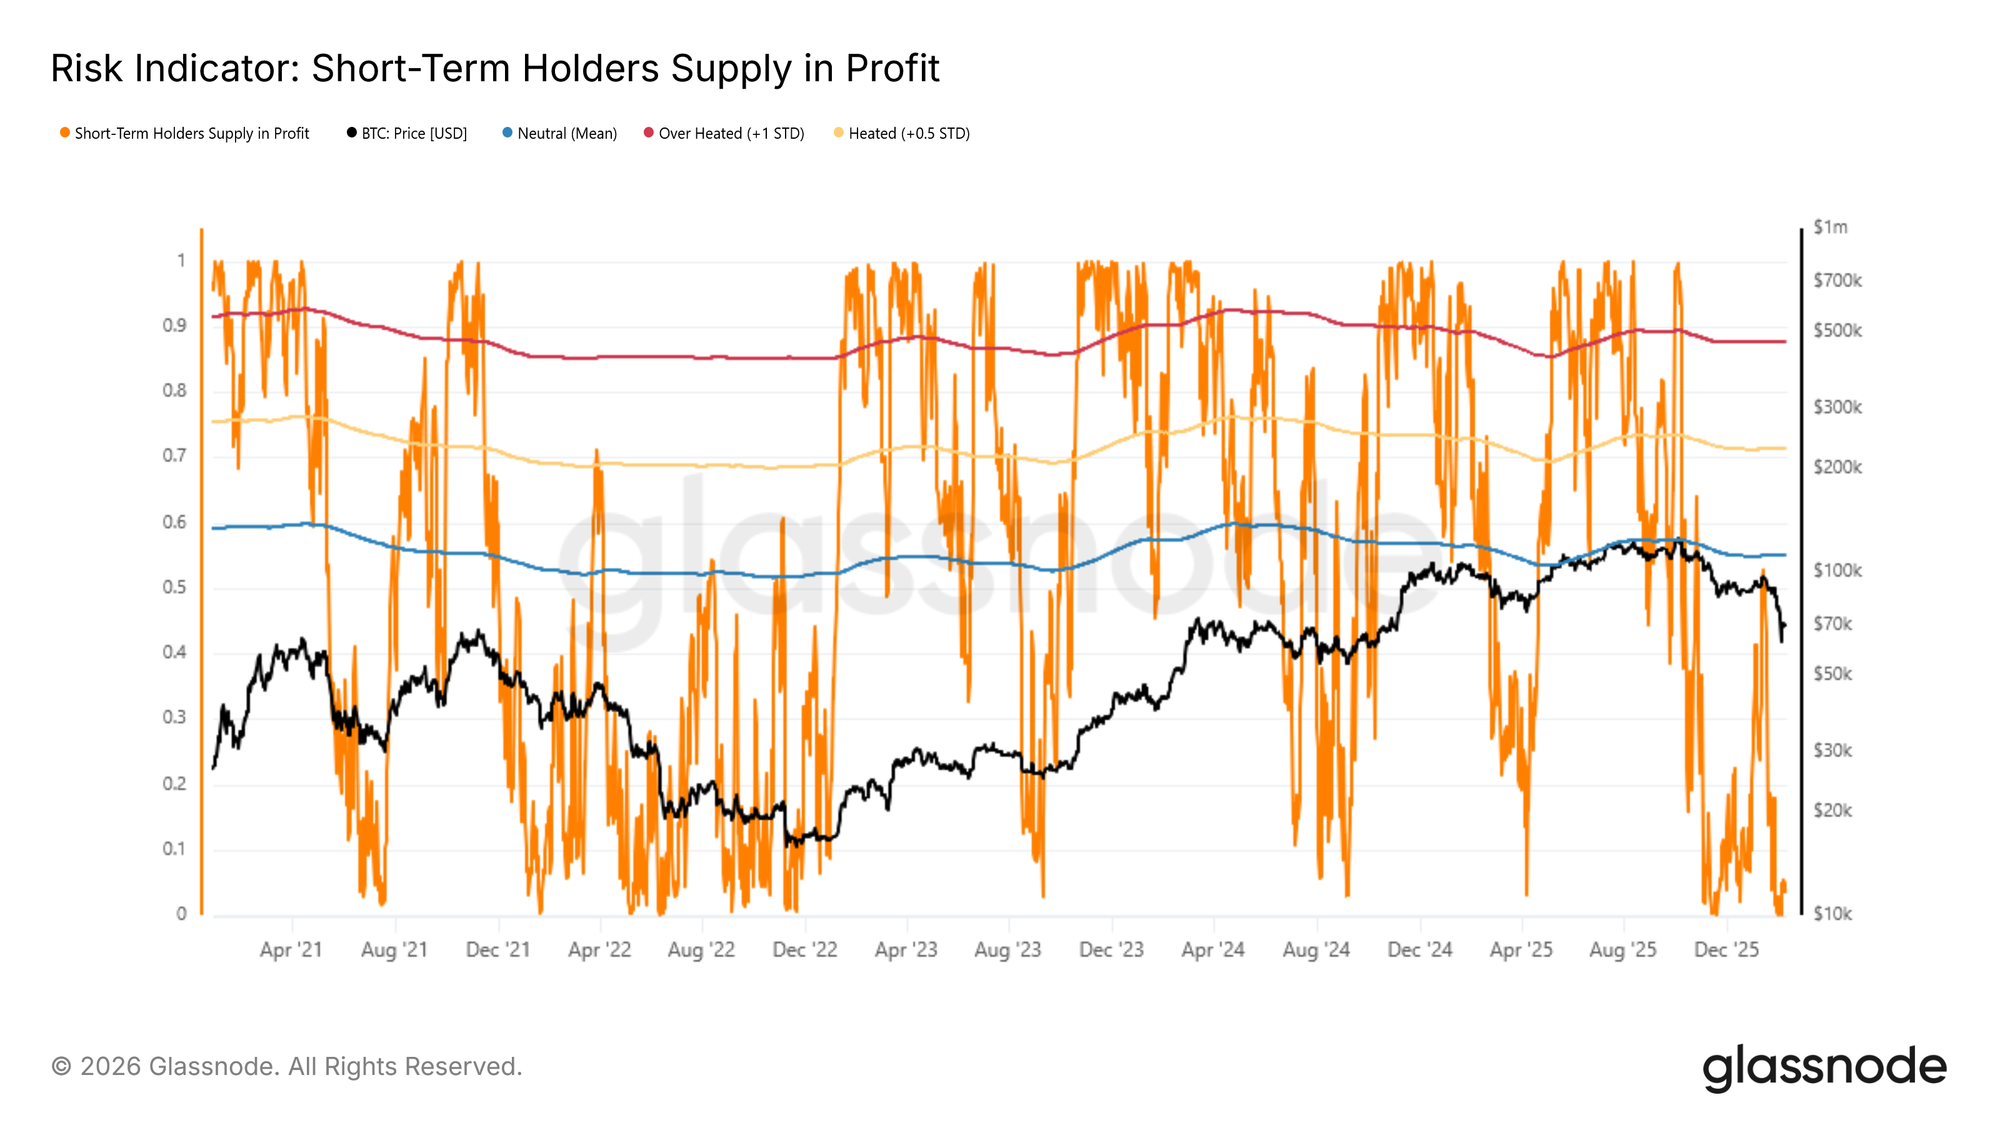
В рамках этой диапазонной структуры определение тактических точек перелома становится критически важным. Предполагая, что среднесрочный коридор по-прежнему определяется Реализованной Ценой (внизу) и Истинной Рыночной Средней (наверху), мониторинг динамики локальных ралли становится особенно важным в медвежьем режиме. Исторически сложилось, что на ранних стадиях медвежьих рынков контртрендовые ралли ограничиваются тем, что недавние покупатели распределяют активы на strength (силе). Таким образом, резкое расширение их нереализованной прибыли часто предшествует формированию локальных вершин.
Метрика "Прибыльность предложения краткосрочных держателей" (Short-Term Holders Supply in Profit) предоставляет полезный индикатор этих колебаний. Когда она находится в своем статистически выведенном "нагретом среднем" диапазоне, от исторического среднего значения до +0,5 стандартных отклонений, отскоки медвежьего рынка часто останавливались. В настоящее время этот показатель находится near 4.9%, что указывает на то, что большинство недавних покупателей остаются "под водой". Эта subdued profitability (подавленная прибыльность) подчеркивает структурно хрупкую среду, где восходящий импульс может struggle to sustain (с трудом поддерживаться) без meaningful demand expansion (значительного расширения спроса).
Офф-чейн инсайты
Потоки цифровых активов казначейств
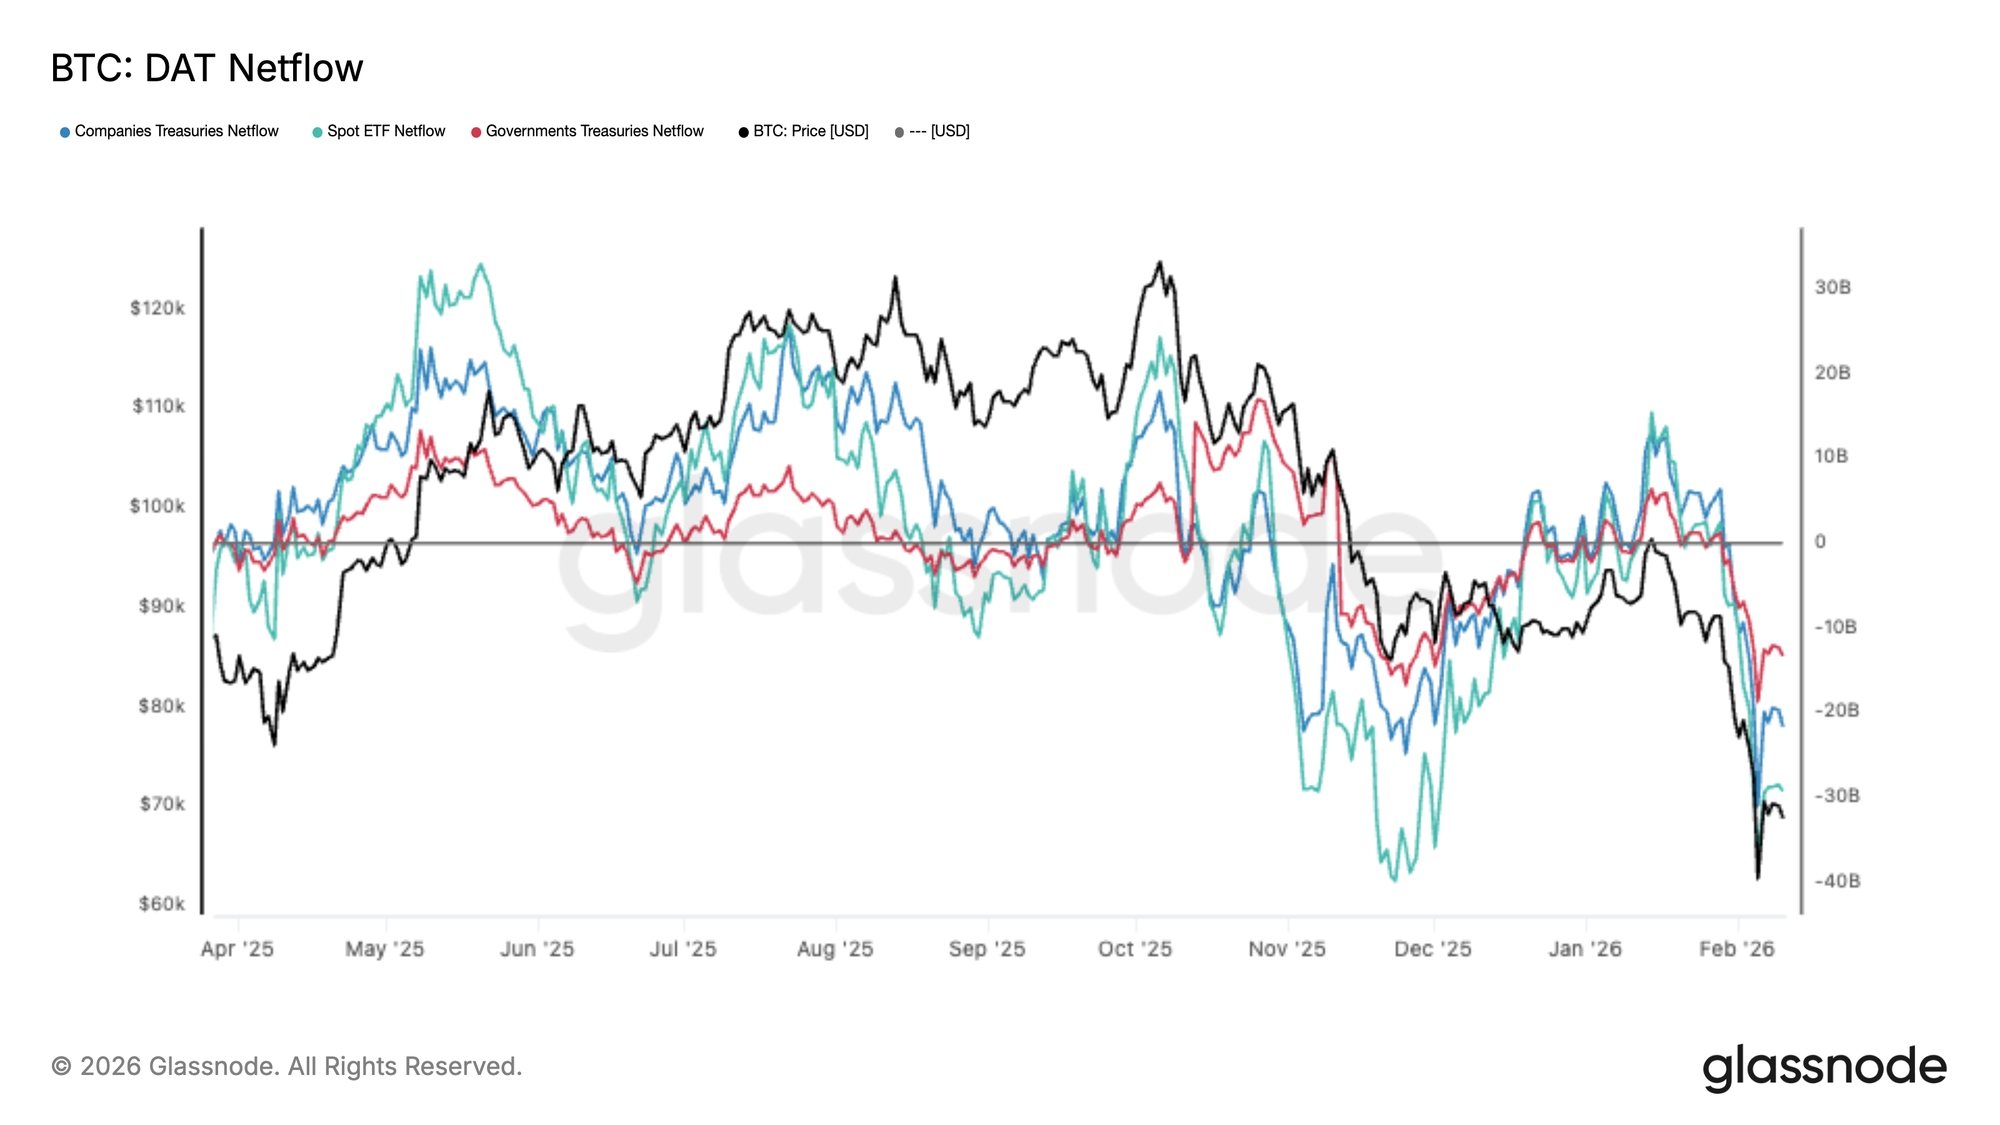
Потоки Digital Asset Treasury (DAT) резко стали отрицательными: спотовые ETF, корпоративные и государственные казначейства зафиксировали одновременные чистые оттоки, поскольку Bitcoin торгуется на новых локальных минимумах. Казначейства ETF являются основным драйвером этого движения, в то время как корпоративные и суверенные потоки подтверждают, что давление продавцов является широким, а не изолированным. Это выравнивание сигнализирует о четком сдвиге в сторону derisking (снижения рисков), когда маржинальный институциональный спрос отступил, и предложение доминирует в краткосрочном order flow (потоке ордеров).
Масштаб этих оттоков подчеркивает "тяжелые" спотовые условия, при которых поглощение struggle to keep pace (с трудом поспевает) за дистрибуцией. Синхронизированный характер движения, а не отражение тактической ротации within a single cohort (внутри одной когорты), suggests a market-wide pullback in treasury exposure (указывает на обще рыночное сокращение экспозиции казначейств). До тех пор, пока потоки DAT не стабилизируются, price action (ценовое действие) остается чувствительным к continued selling pressure (продолжающемуся давлению продавцов), при этом волатильность, вероятно, будет определяться тем, как быстро новые покупатели придут, чтобы уравновесить текущую волну институциональной дистрибуции.
Вялый спотовый объем
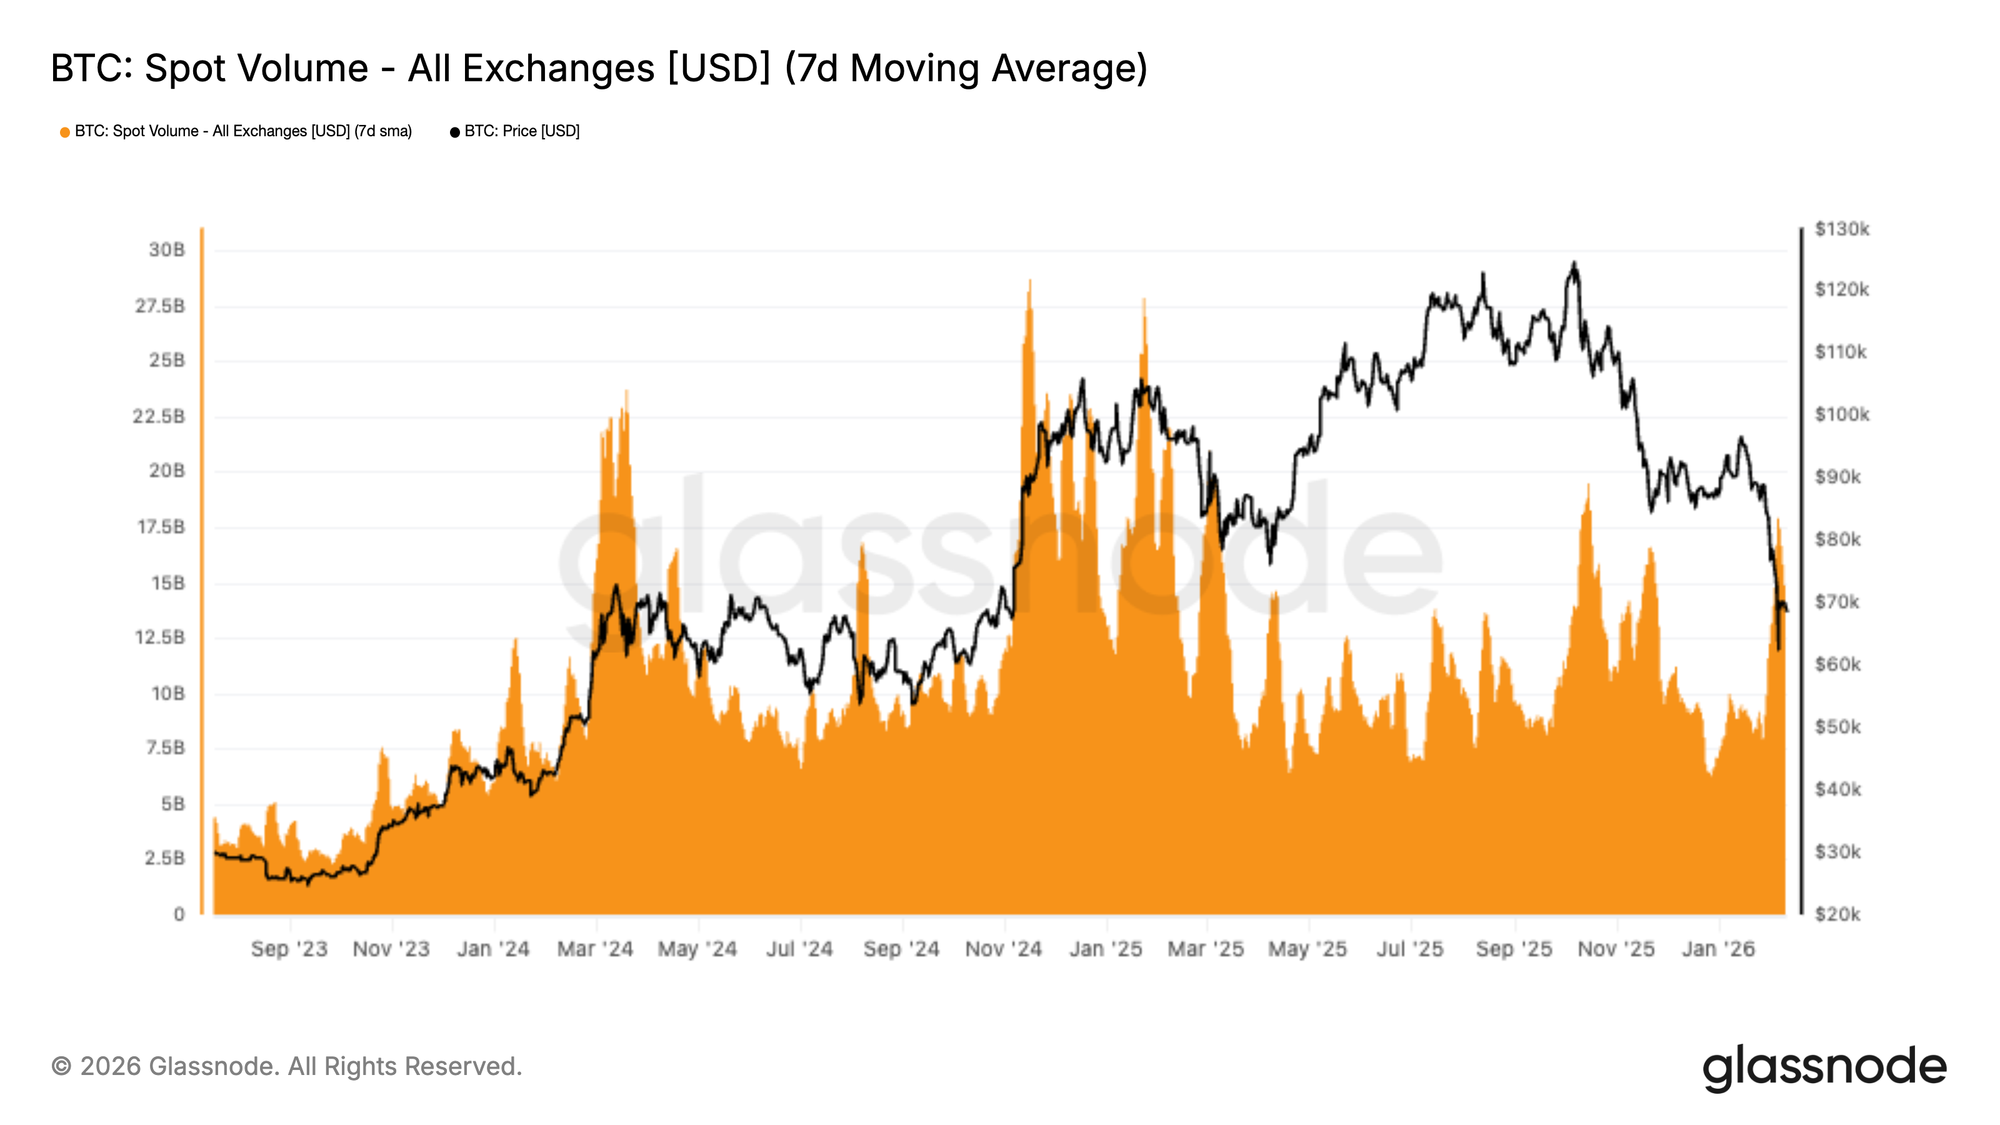
Спотовый торговый объем резко расширился во время распродажи Bitcoin к минимумам в районе $70 тыс., при этом 7-дневное среднее значение зафиксировало четкий всплеск по мере ускорения волатильности. Это увеличение отражает реактивное участие, поскольку трейдеры responded to rapid downside movement (отреагировали на быстрое нисходящее движение), а не широкую волну fresh conviction buying (покупок по убеждению). Примечательно, что расширение объема быстро сошло на нет после initial surge (первоначального всплеска), что позволяет предположить, что, хотя движение и привлекло внимание, оно не переросло в устойчивый спотовый спрос.
Отсутствие последующего развития указывает на то, что поглощение остается shallow relative to the scale of selling pressure (неглубоким относительно масштаба давления продавцов). Вместо того чтобы сигнализировать о накоплении, текущая активность, по-видимому, driven by short-term repositioning and liquidation-related churn (обусловлена краткосрочным репозиционированием и churn, связанным с ликвидацией). Без continued participation on the bid (продолжающегося участия на биде), цена остается чувствительной к дальнейшей волатильности, поскольку рынок еще не продемонстрировал kind of persistent volume support typically associated with stabilization (вид устойчивой поддержки, обычно ассоциирующейся со стабилизацией). На данный момент спотовые потоки отражают engagement during stress (вовлеченность во время стресса), а не decisive shift toward constructive demand (решительный сдвиг в сторону конструктивного спроса).
Премия фьючерсов остывает
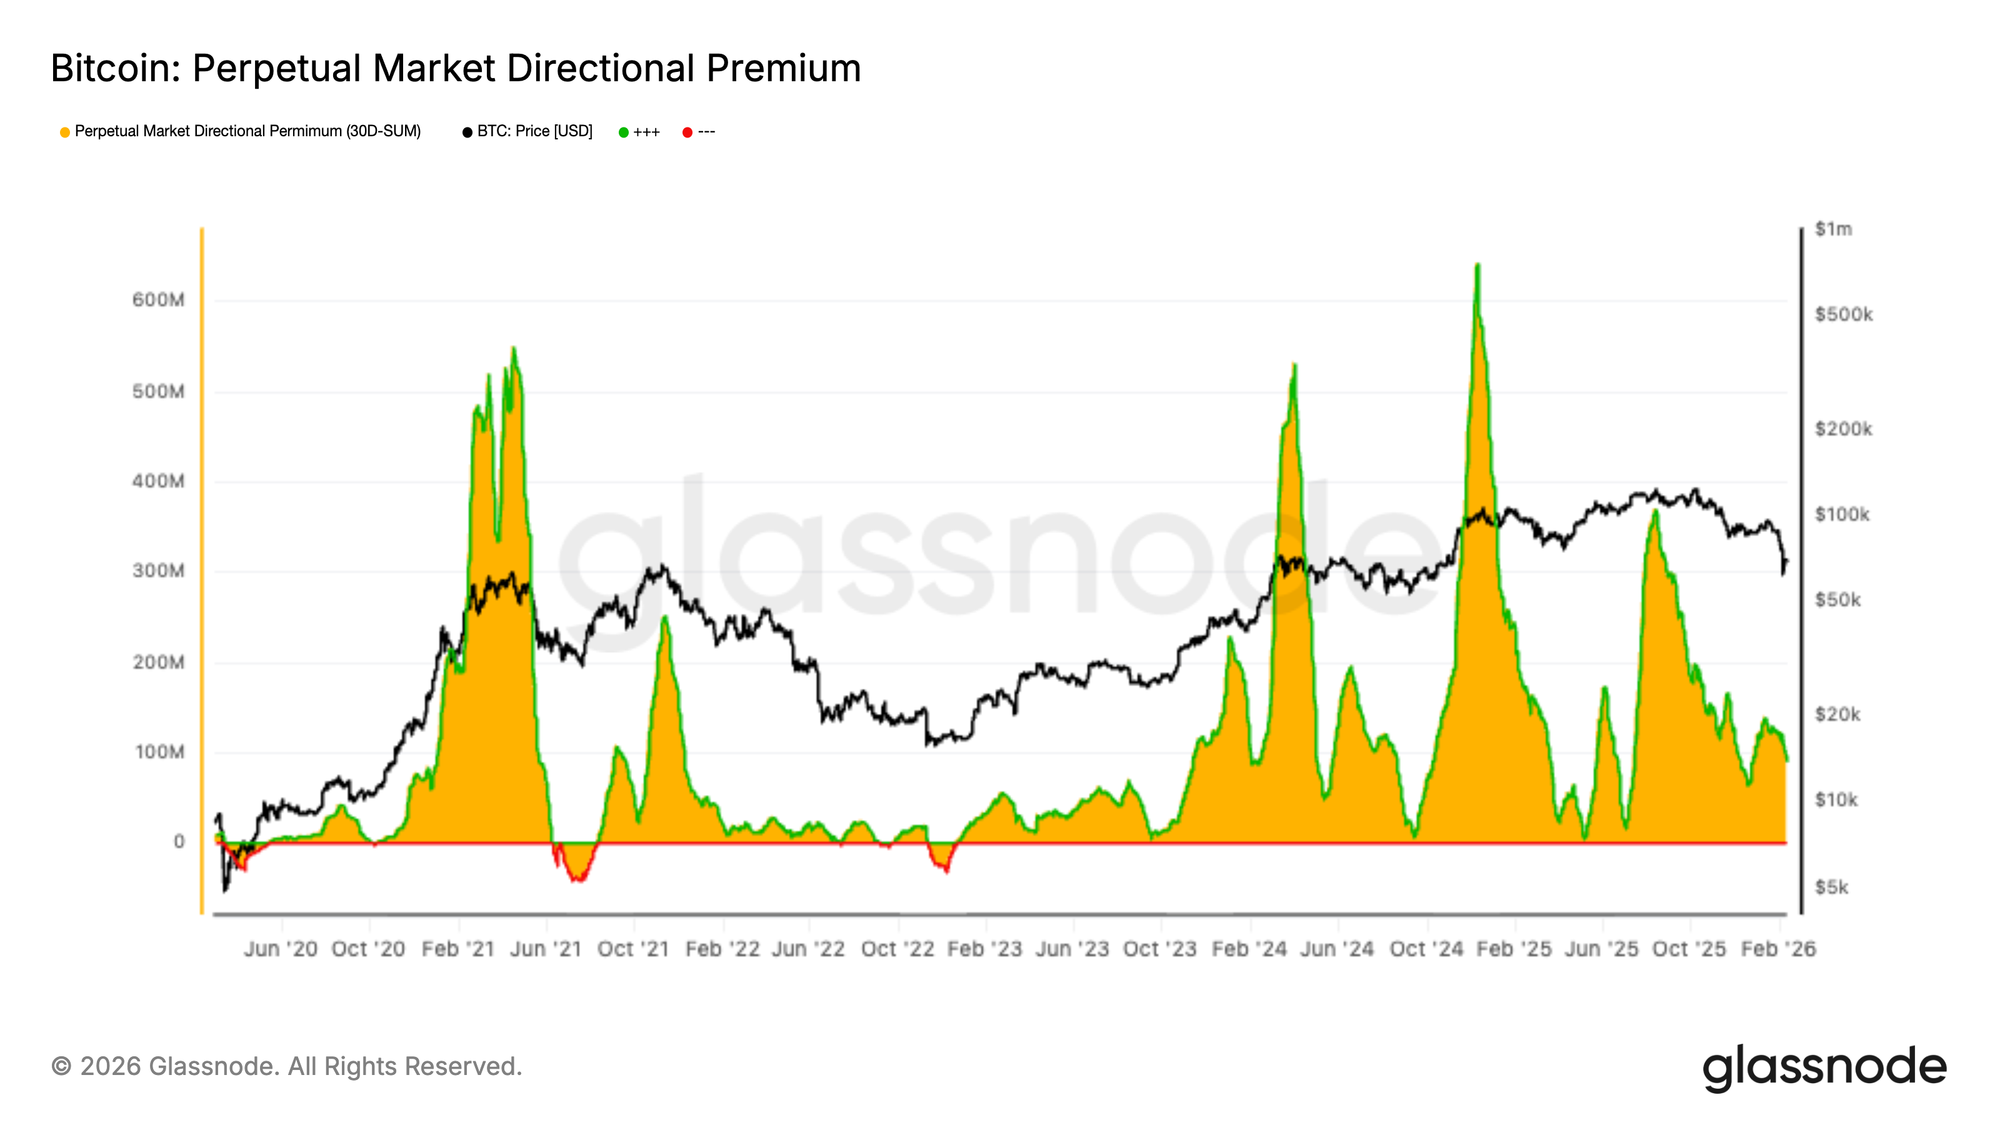
Позиционирование по перпетуальным фьючерсам заметно остыло, при этом directional premium (направленная премия) сжалась к нейтральной территории после недавнего отката. Это отражает clear reduction in speculative activity (четкое сокращение спекулятивной активности), поскольку leveraged traders (трейдеры с плечом) отступают, а не агрессивно позиционируются для продолжения движения в любом направлении. Ранее в цикле elevated premiums (повышенные премии) совпадали с strong directional conviction (сильной направленной уверенностью), но текущий режим suggests a market lacking appetite for leveraged exposure (указывает на рынок, испытывающий недостаток аппетита к leveraged exposure (экспозиции с плечом)).
Сокращение подчеркивает broader decline in futures participation (более широкий спад участия на фьючерсах), где risk appetite (аппетит к риску) исчез вместе с волатильностью. Вместо того чтобы видеть агрессивное короткое позиционирование или renewed long speculation (возобновленные long-спекуляции), трейдеры, appear hesitant (по-видимому, колеблются), что приводит к thinner directional flows (более тонким направленным потокам). Эта subdued derivatives activity (подавленная активность на деривативах) удаляет key source of momentum (ключевой источник импульса), который часто усиливает ценовые колебания, оставляя спотовым рынкам dictate near-term direction (определять краткосрочное направление). На данный момент фьючерсный комплекс signals caution and reduced conviction (сигнализирует об осторожности и сниженной уверенности), что согласуется с рынком, transitioning into a lower-energy phase (переходящим в фазу lower-energy (пониженной энергии)) после недавней распродажи.
Подразумеваемая волатильность сигнализирует о режиме повышенного риска
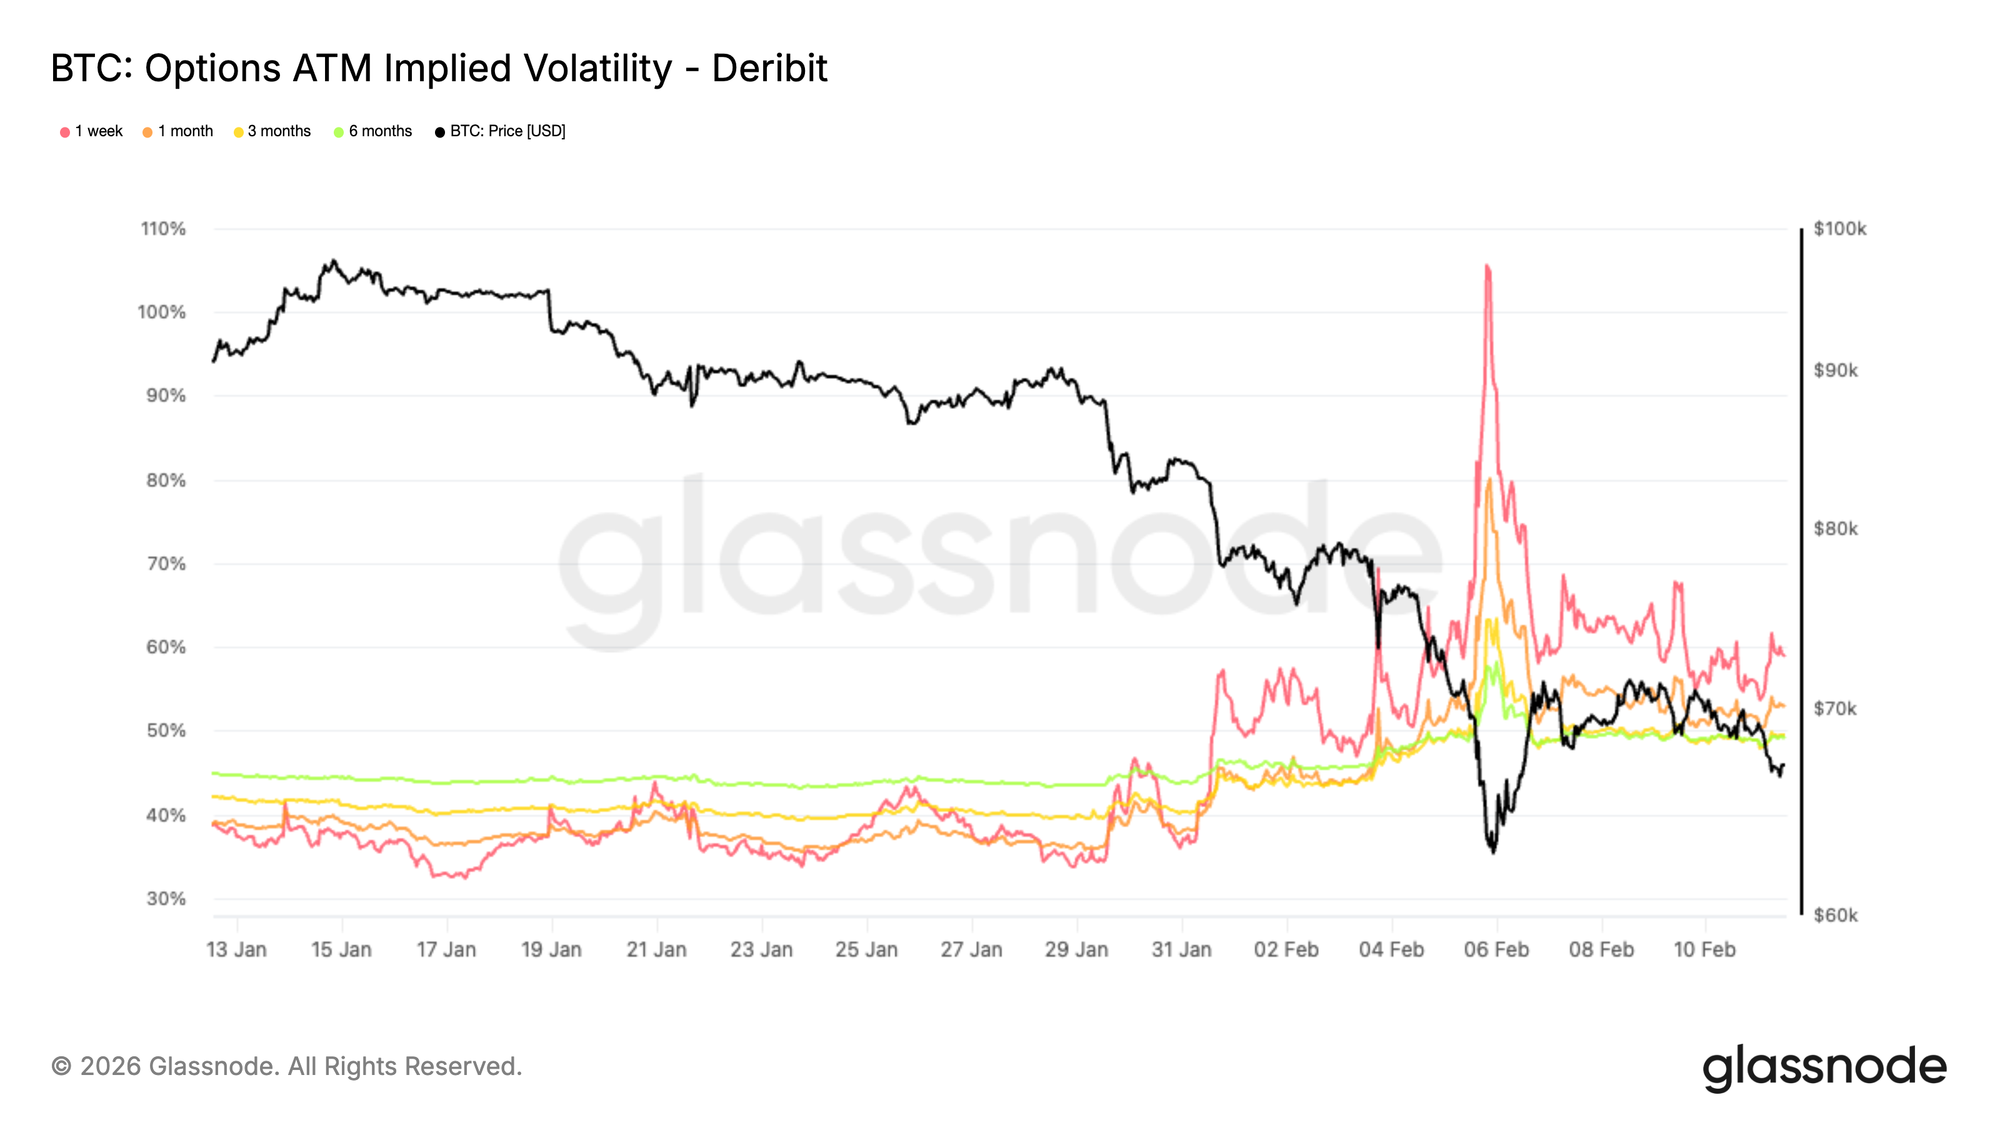
Первый структурный сдвиг после события капитуляции виден в режиме подразумеваемой волатильности. Глядя на график 1-месячной ATM (at-the-money) подразумеваемой волатильности, различие очевидно. Более длинные сроки переоценились в сторону повышения: 6-месячная подразумеваемая волатильность выросла более чем на 5 пунктов волатильности с начала месяца, а 3-месячная — примерно на 9 пунктов.
Самый значительный скачок произошел на коротком конце, где 1-недельная подразумеваемая волатильность подскочила более чем на 20 пунктов. Подразумеваемая волатильность отражает, сколько движения рынок ожидает в будущем. Движения такой величины редко представляют собой временный всплеск. Они signal a repricing of forward risk across the surface (сигнализируют о переоценке форвардного риска по всей поверхности).
Хотя волатильность снизилась с своего пика, она остается elevated across maturities (повышенной по всем срокам), что указывает на то, что трейдеры continue to price sustained uncertainty (продолжают закладывать устойчивую неопределенность), а не quick return to calm conditions (быстрое возвращение к спокойным условиям).
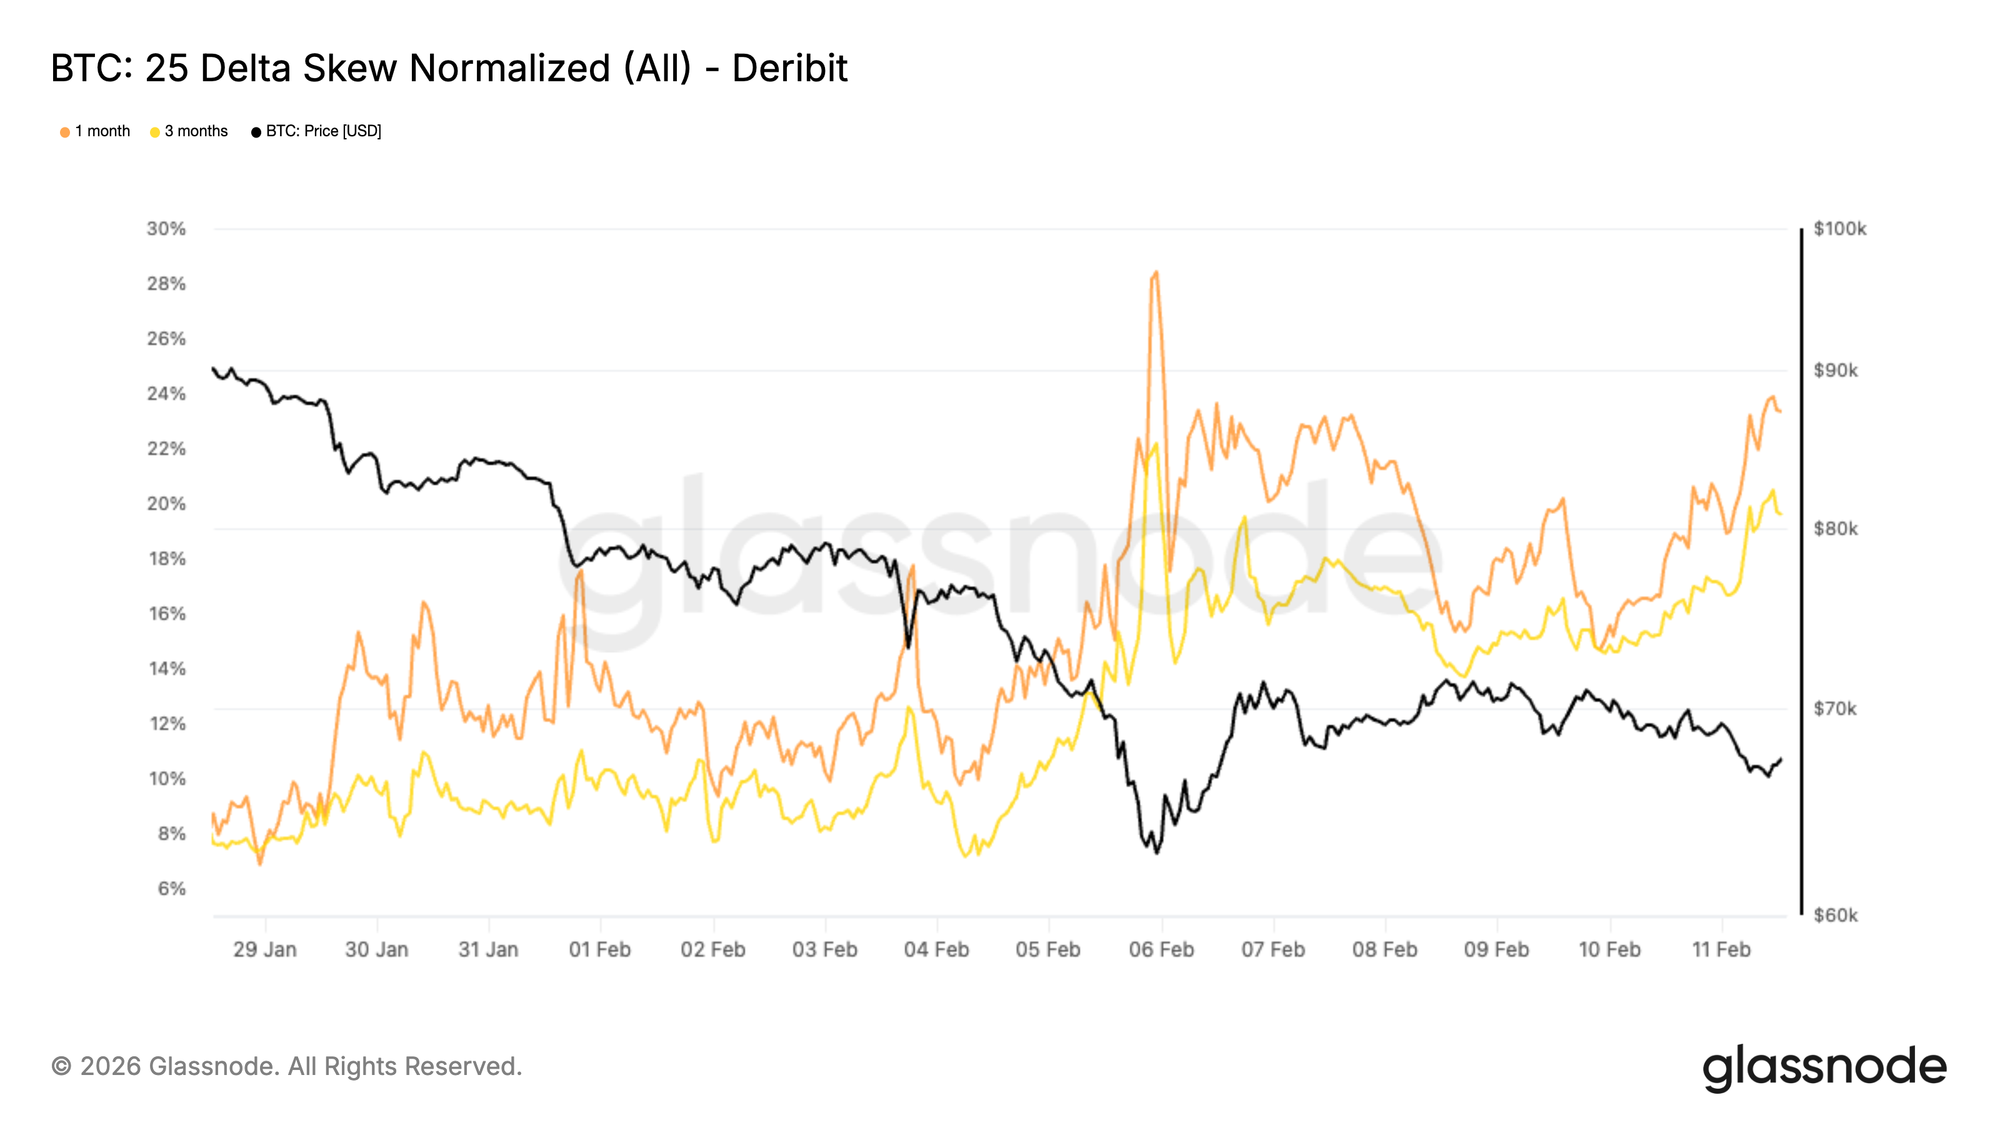
25 Delta Skew показывает устойчивый спрос на downside
В то время как общая волатильность переоценилась в сторону повышения, skew (скей/перекос) показывает, как этот спрос распределен по страйкам. Глядя на 1-месячный и 3-месячный 25 дельта скей, оба резко сместились в отрицательную область во время обвала, поскольку трейдеры агрессивно покупали puts (пут-опционы).
Даже после relief rally (восстановительного ралли) в пятницу, downside protection (защита от падения) продолжает торговаться со значительной премией и сейчас находится near the most extreme levels reached during the selloff (близко к самым экстремальным уровням, достигнутым во время распродажи). 25 дельта скей сравнивает подразумеваемую волатильность out of the money puts (внеденежных путов) и calls (коллов). Когда он отрицательный, это сигнализирует о более сильном спросе на downside protection, чем на upside exposure (экспозицию на рост). 28 января 1-месячный и 3-месячный скей составляли около 8 процентов put premium (премии путов). Сейчас они находятся на уровне примерно 23 процента и 19 процентов соответственно.
Поверхность остается clearly tilted toward downside insurance (явно смещенной в сторону downside insurance (страхования от падения)), показывая, что caution, and fear, persists despite the bounce (осторожность и страх сохраняются, несмотря на отскок).
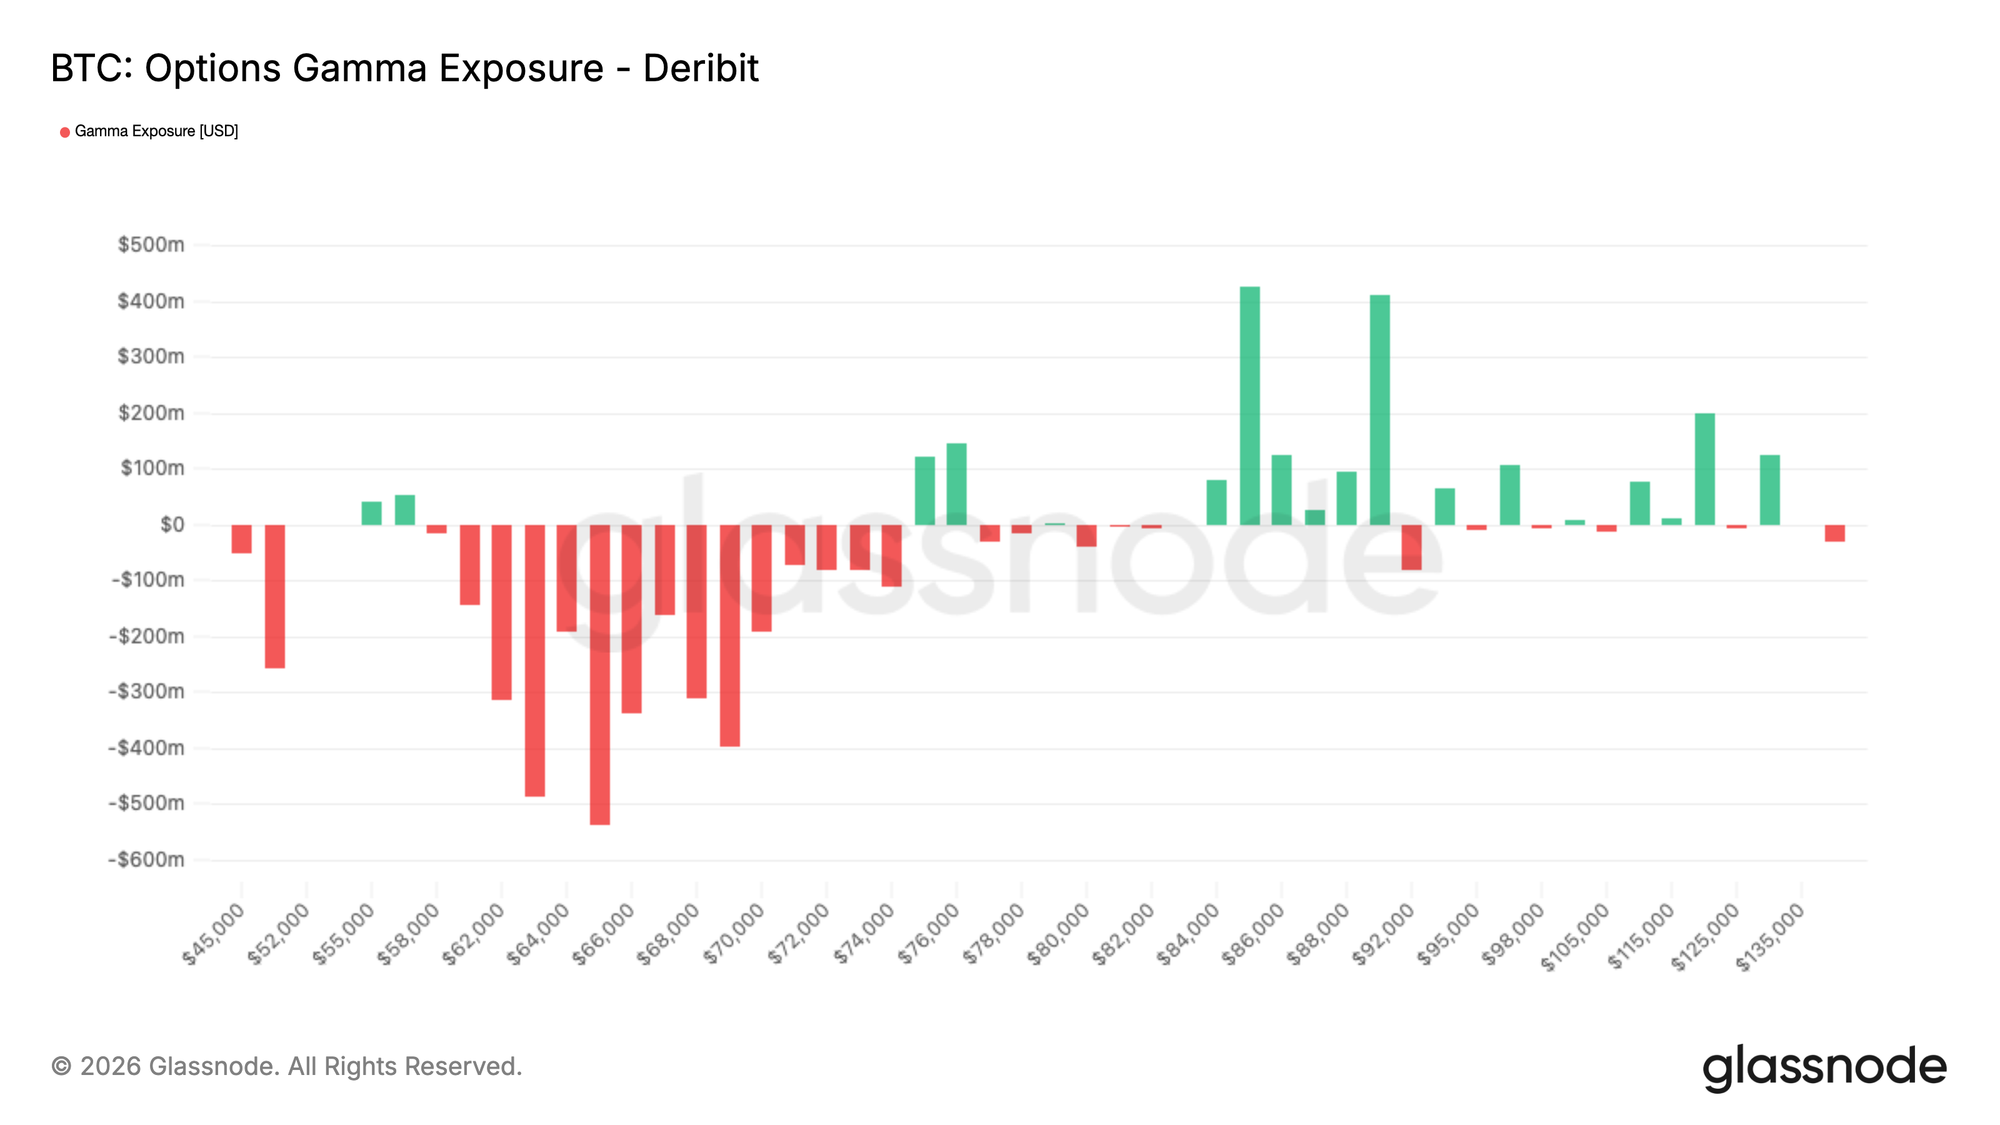
Позиционирование гаммы дилеров сохраняет реактивность цены
При цене BTC в $68K на момент написания, спот находится в середине выраженного short gamma corridor (коридора короткой гаммы), с еще большей экспозицией гаммы, расположенной ниже.
Этот defensive options flow (защитный опционный поток) оставляет mechanical footprint in dealer positioning (механический след в позиционировании дилеров). Когда дилеры являются short gamma (короткими по гамме), они должны покупать на strength (силе) и продавать на weakness (слабости), чтобы оставаться хеджированными. Это поведение усиливает ценовые движения, а не гасит их, особенно в условиях повышенной волатильности, таких как текущий режим.
После агрессивных покупок путов во время обвала, дилеры remain structurally exposed in a way that can amplify swings (остаются структурно экспонированными таким образом, что это может усиливать колебания). Недавнее ралли не fully neutralized that sensitivity (полностью нейтрализовало эту чувствительность). Результатом является mechanically fragile market structure (механически хрупкая структура рынка), где хеджирующие потоки могут ускорять движения в любом направлении, со смещенным риском в сторону более резких нисходящих продолжений.
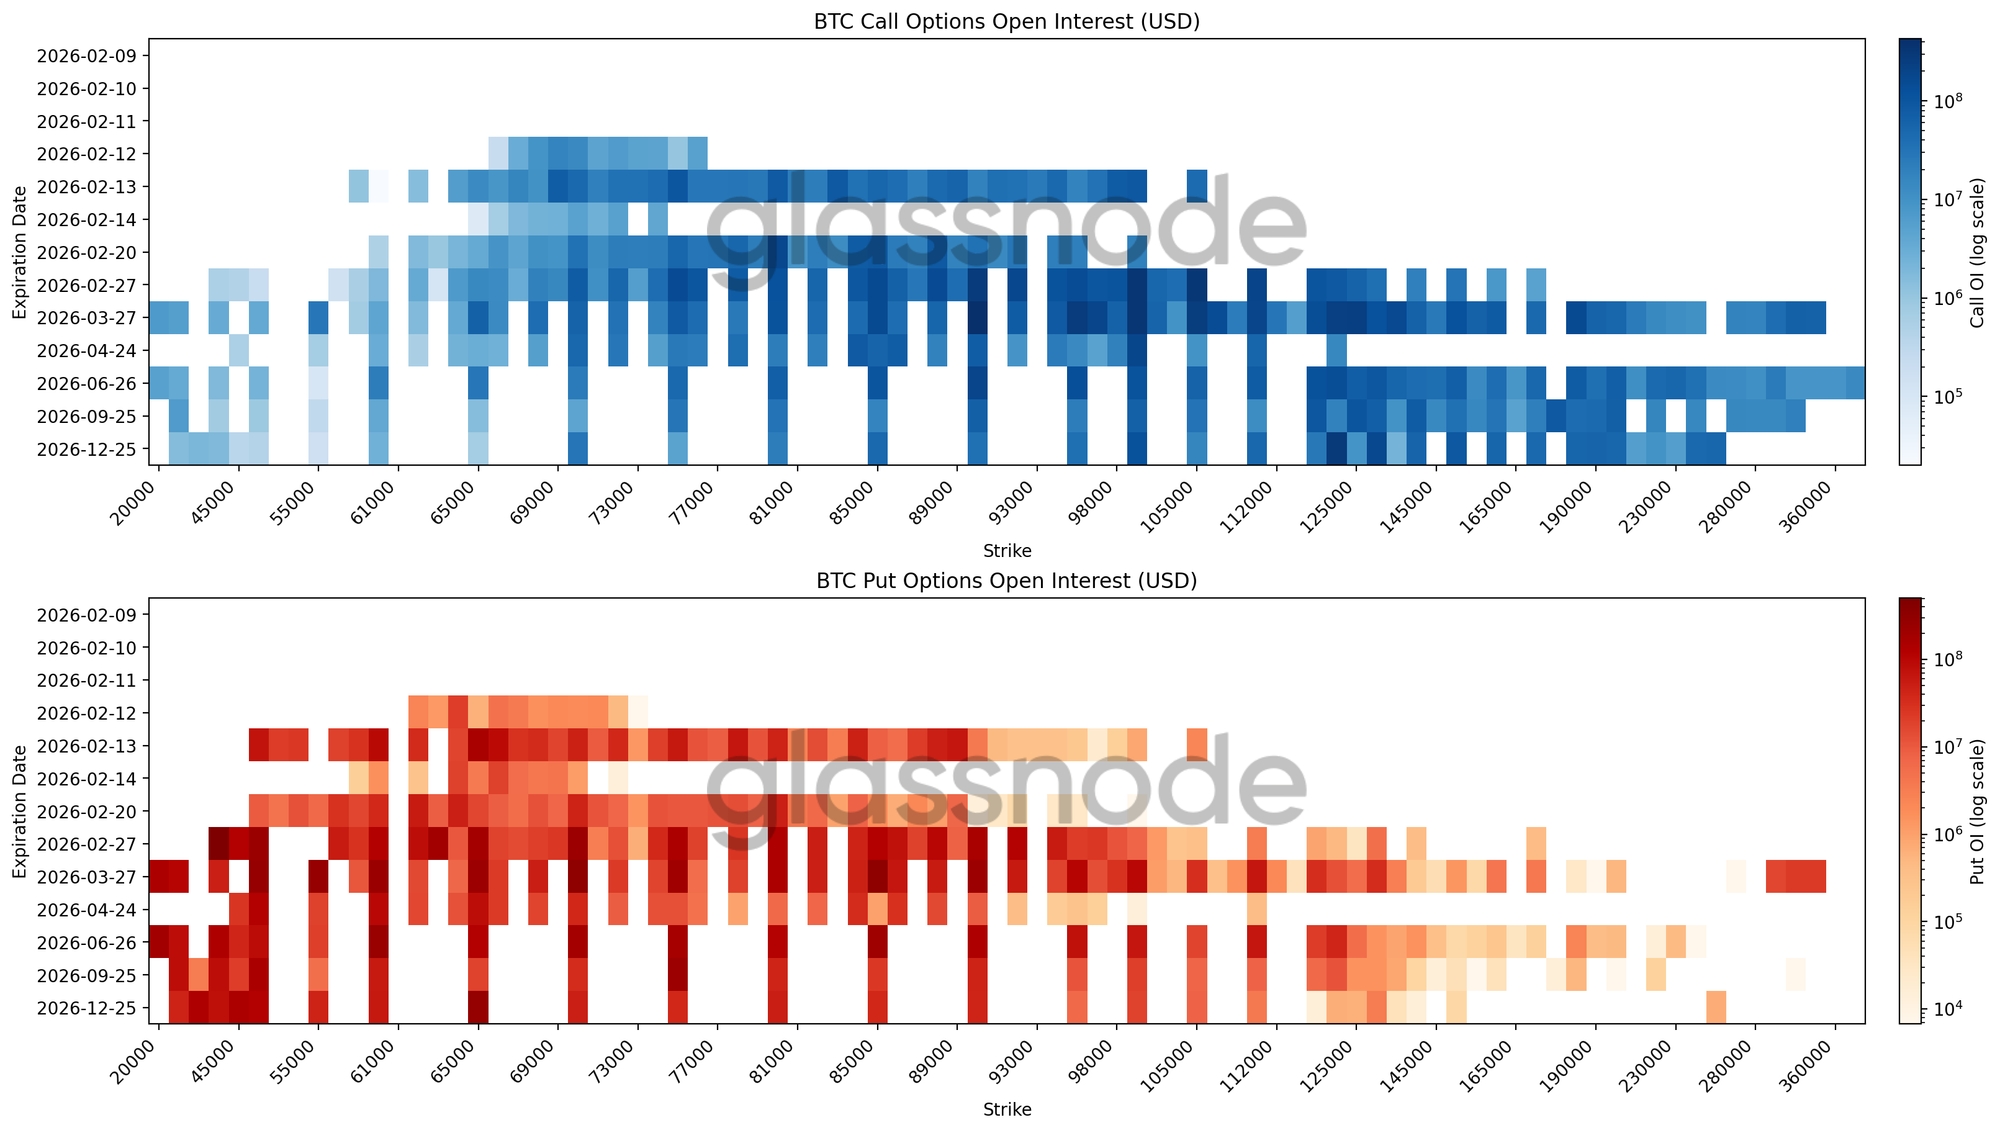
Тепловая карта открытого интереса reveals broad hedging zones (выявляет широкие зоны хеджирования)
Наша последняя тепловая карта визуализирует открытый интерес по опционам на BTC по страйкам и экспирациям в одном представлении, highlighting where positioning is concentrated and where structural price sensitivity may emerge (подсвечивая, где сконцентрировано позиционирование и где может возникнуть структурная ценовая чувствительность). Открытый интерес по puts (путам) heavily stacked below spot (значительно сконцентрирован ниже спота). Для экспирации в феврале самый большой кластер находится между $70K и $60K. Далее по кривой, более широкая концентрация формируется между $50K и $30K по более длинным срокам до конца года.
Эта структура охватывает multiple expiries (несколько экспираций), indicating persistent hedging demand rather than protection tied to a single event (указывая на устойчивый спрос на хеджирование, а не на защиту, привязанную к единичному событию). Экспозиция distributed across adjacent strikes (распределена по соседним страйкам), suggesting range based insurance rather than targeting a precise crash level (предполагая range based insurance (страхование на основе диапазона), а не targeting a precise crash level (нацеливание на точный уровень обвала)). На стороне calls (коллов), открытый interest clusters above 120K into the second half of the year (интерес кластеризуется выше $120K во второй половине года). Краткосрочный апсайд monetized (монетизируется), в то время как более длинный даунсайд остается owned as tail risk protection (во владении как защита от хвостовых рисков), reinforcing the deeply negative skew (усиливая глубоко отрицательный скей).
Позиционирование остается defensive and is not consistent with a market preparing for a snapback rally (защитным и не согласуется с рынком, готовящимся к snapback (резкому обратному) ралли).
Заключение
Bitcoin продолжает торговаться в рамках структурно оборонительного режима, где цена остается привязанной между ключевыми уровнями себестоимости и зонами поглощения, которые активно тестируются. Давление со стороны продавцов все еще встречает спрос в коридоре $60–72 тыс., но нависающее предложение и отрицательная прибыльность краткосрочных держателей suggest conviction remains fragile (предполагают, что уверенность остается хрупкой). Это делает ралли уязвимыми для сопротивления, в то время как стабилизация зависит от sustained buyer participation (устойчивого участия покупателей).
Офф-чейн потоки усиливают этот осторожный фон. Институциональные оттоки из казначейств указывают на ongoing de-risking (продолжающееся снижение рисков), в то время как спотовая активность была reactive rather than accumulation-driven (реактивной, а не движимой накоплением). В то же время, рынки деривативов отражают cooling in speculative appetite (остывание спекулятивного аппетита), с elevated hedging demand and dealer positioning keeping price action reactive rather than directional (повышенным спросом на хеджирование и позиционированием дилеров, которое сохраняет ценовое действие реактивным, а не направленным).
В совокупности, рынок, appears to be navigating a period of balance under stress (по-видимому, проходит период баланса под stress (напряжением)). Ликвидность остается thin (тонкой), участие selective (избирательным), а позиционирование defensive (оборонительным). Для улучшения условий рынку, likely, потребуется как renewed spot absorption (возобновленное спотовое поглощение), так и shift in risk appetite (сдвиг в аппетите к риску). До тех пор ожидается, что волатильность будет оставаться driven by short-term positioning dynamics (обусловленной динамикой краткосрочного позиционирования), а не broad-based expansion (широкомасштабным расширением).
Отказ от ответственности: Этот отчет не предоставляет каких-либо инвестиционных рекомендаций. Все данные предоставляются исключительно в информационных и образовательных целях. Ни одно инвестиционное решение не должно основываться на информации, предоставленной здесь, и вы solely responsible for your own investment decisions (несете единоличную ответственность за свои собственные инвестиционные решения).
Балансы бирж, представленные здесь, получены из комплексной базы данных меток адресов Glassnode, которая собирается как из официально опубликованной информации бирж, так и с помощью проприетарных алгоритмов кластеризации. Хотя мы стремимся обеспечить максимальную точность в представлении балансов бирж, важно отметить, что эти цифры могут не всегда охватывать всю полноту резервов биржи, особенно когда биржи воздерживаются от раскрытия своих официальных адресов. Мы призываем пользователей проявлять осторожность и осмотрительность при использовании этих метрик. Glassnode не несет ответственности за любые несоответствия или потенциальные неточности.
Пожалуйста, ознакомьтесь с нашим Уведомлением о прозрачности при использовании данных бирж.