Jito [JTO] вырос на 15,96% до $0,3314 на момент публикации, а объем торгов взлетел более чем на 1000%, что сигнализирует о резком притоке спотового спроса и возобновлении участия на рынке. Это расширение отражает внезапный сдвиг в активности, поскольку покупатели агрессивно входят в игру после периода консолидации.
Примечательно, что такой рост объема не происходит постепенно; он отражает срочность и уверенность участников, входящих в рынок масштабно. В результате цена отреагировала четким восходящим движением, подчеркивая силу, стоящую за этим движением.
Однако этот всплеск также помещает JTO в зону повышенного внимания, где быстрые притоки могут ускорить как продолжение роста, так и волатильность, в зависимости от того, как будет развиваться последующий спрос.
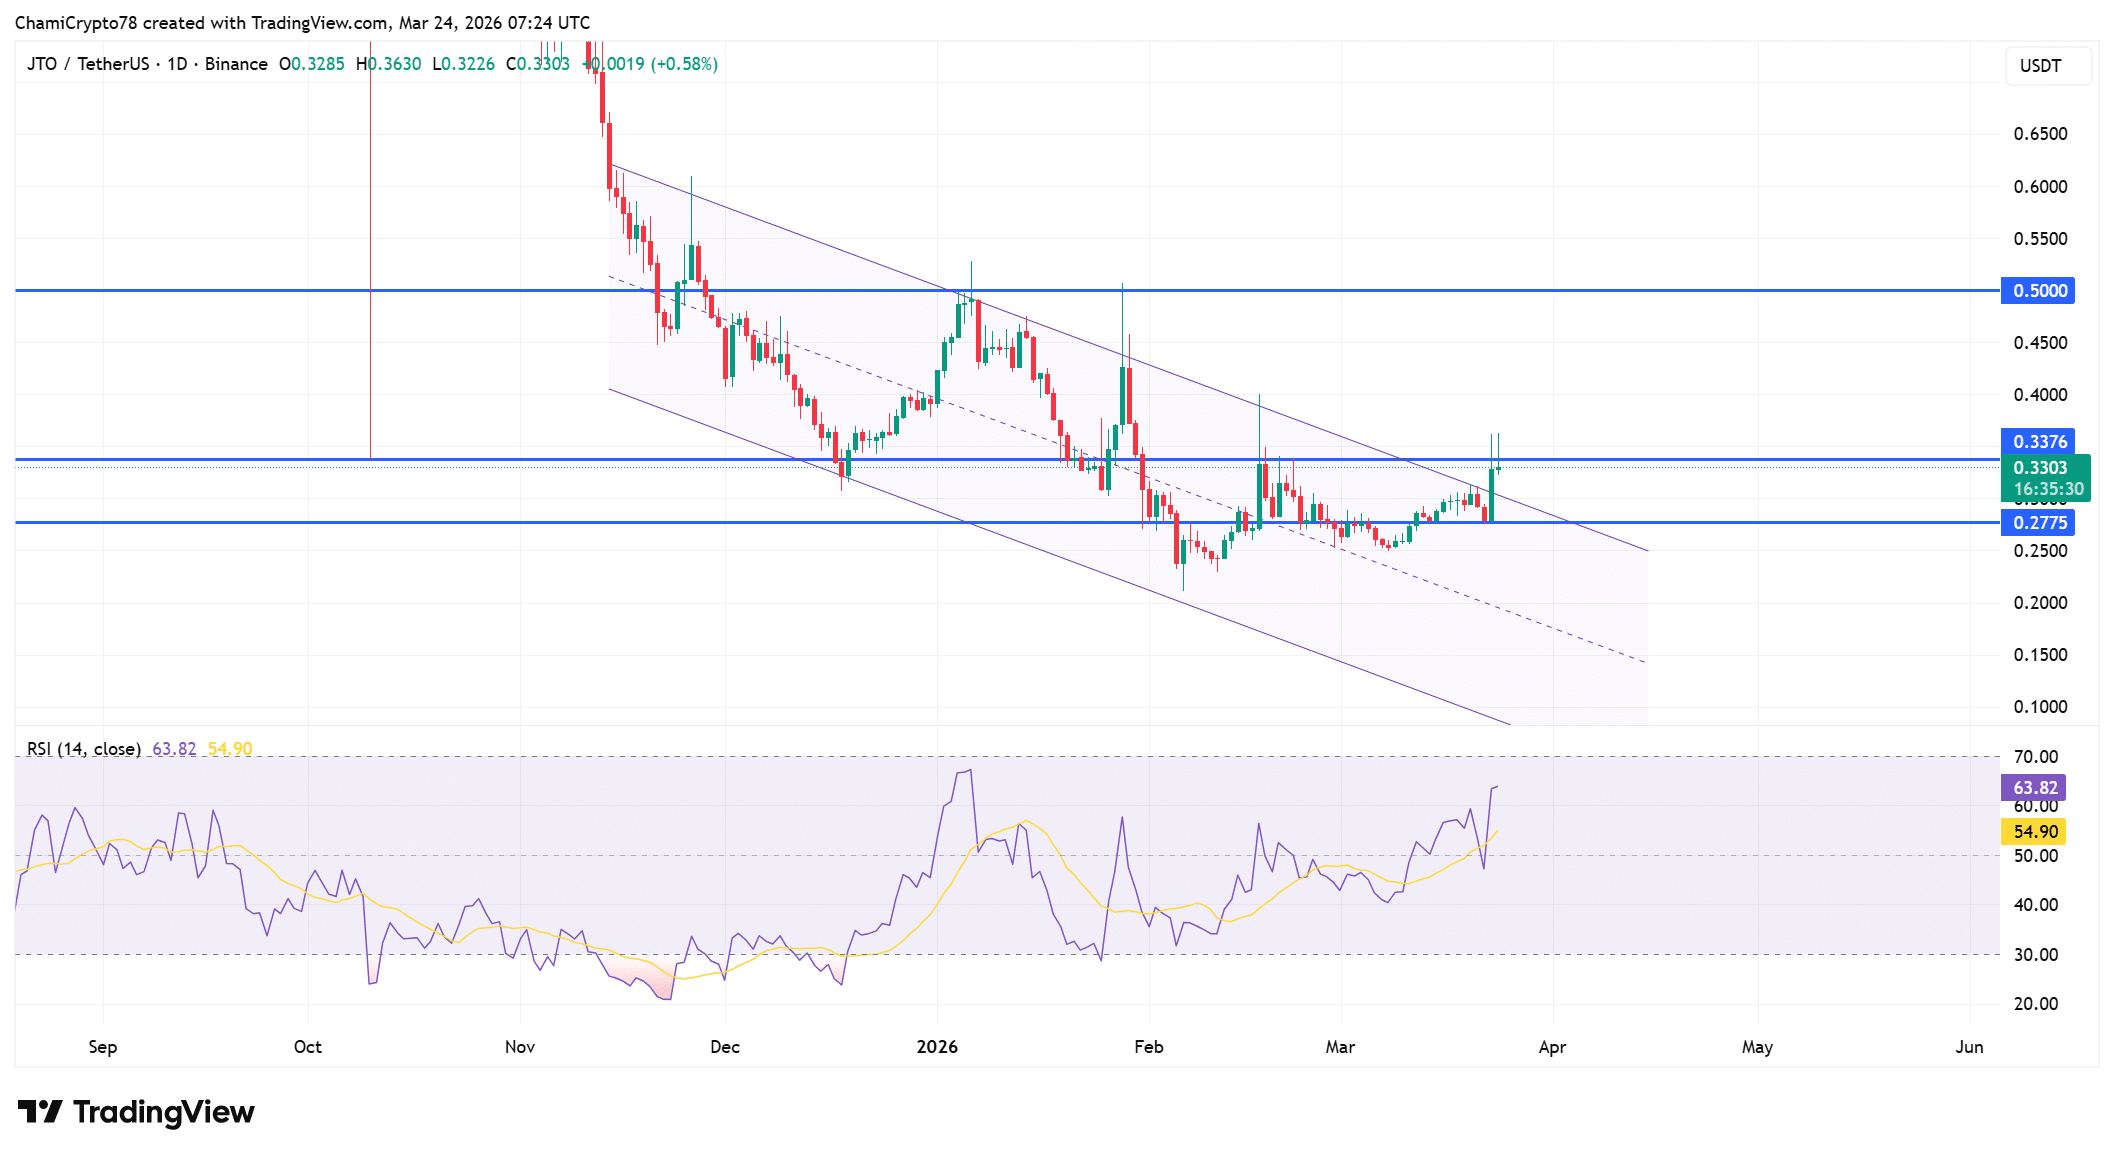
Пробой JTO сохраняется, поскольку RSI подтверждает силу
JTO вышел из своего нисходящего канала после восстановления поддержки на уровне $0,2775, сигнализируя о явном сдвиге в краткосрочной структуре, поскольку покупатели берут контроль. Это движение отражает переход от сжатия к расширению, при котором цена больше не соблюдает прежние нисходящие границы.
В результате JTO теперь приближается к сопротивлению на уровне $0,3376, который является следующим ключевым уровнем в этой структуре. В то же время RSI поднялся до 63 на момент написания, подтверждая силу этого пробоя, не входя в зону перекупленности. Это позиционирование показывает, что у ралли все еще есть пространство для продолжения при сохранении стабильности.
Кроме того, RSI переместился выше своей скользящей средней, что согласуется с текущим поведением цены и поддерживает продолжение движения. Однако удержание выше зоны пробоя остается критически важным, поскольку неудача на этом уровне может ослабить структуру и оттянуть цену обратно к консолидации.

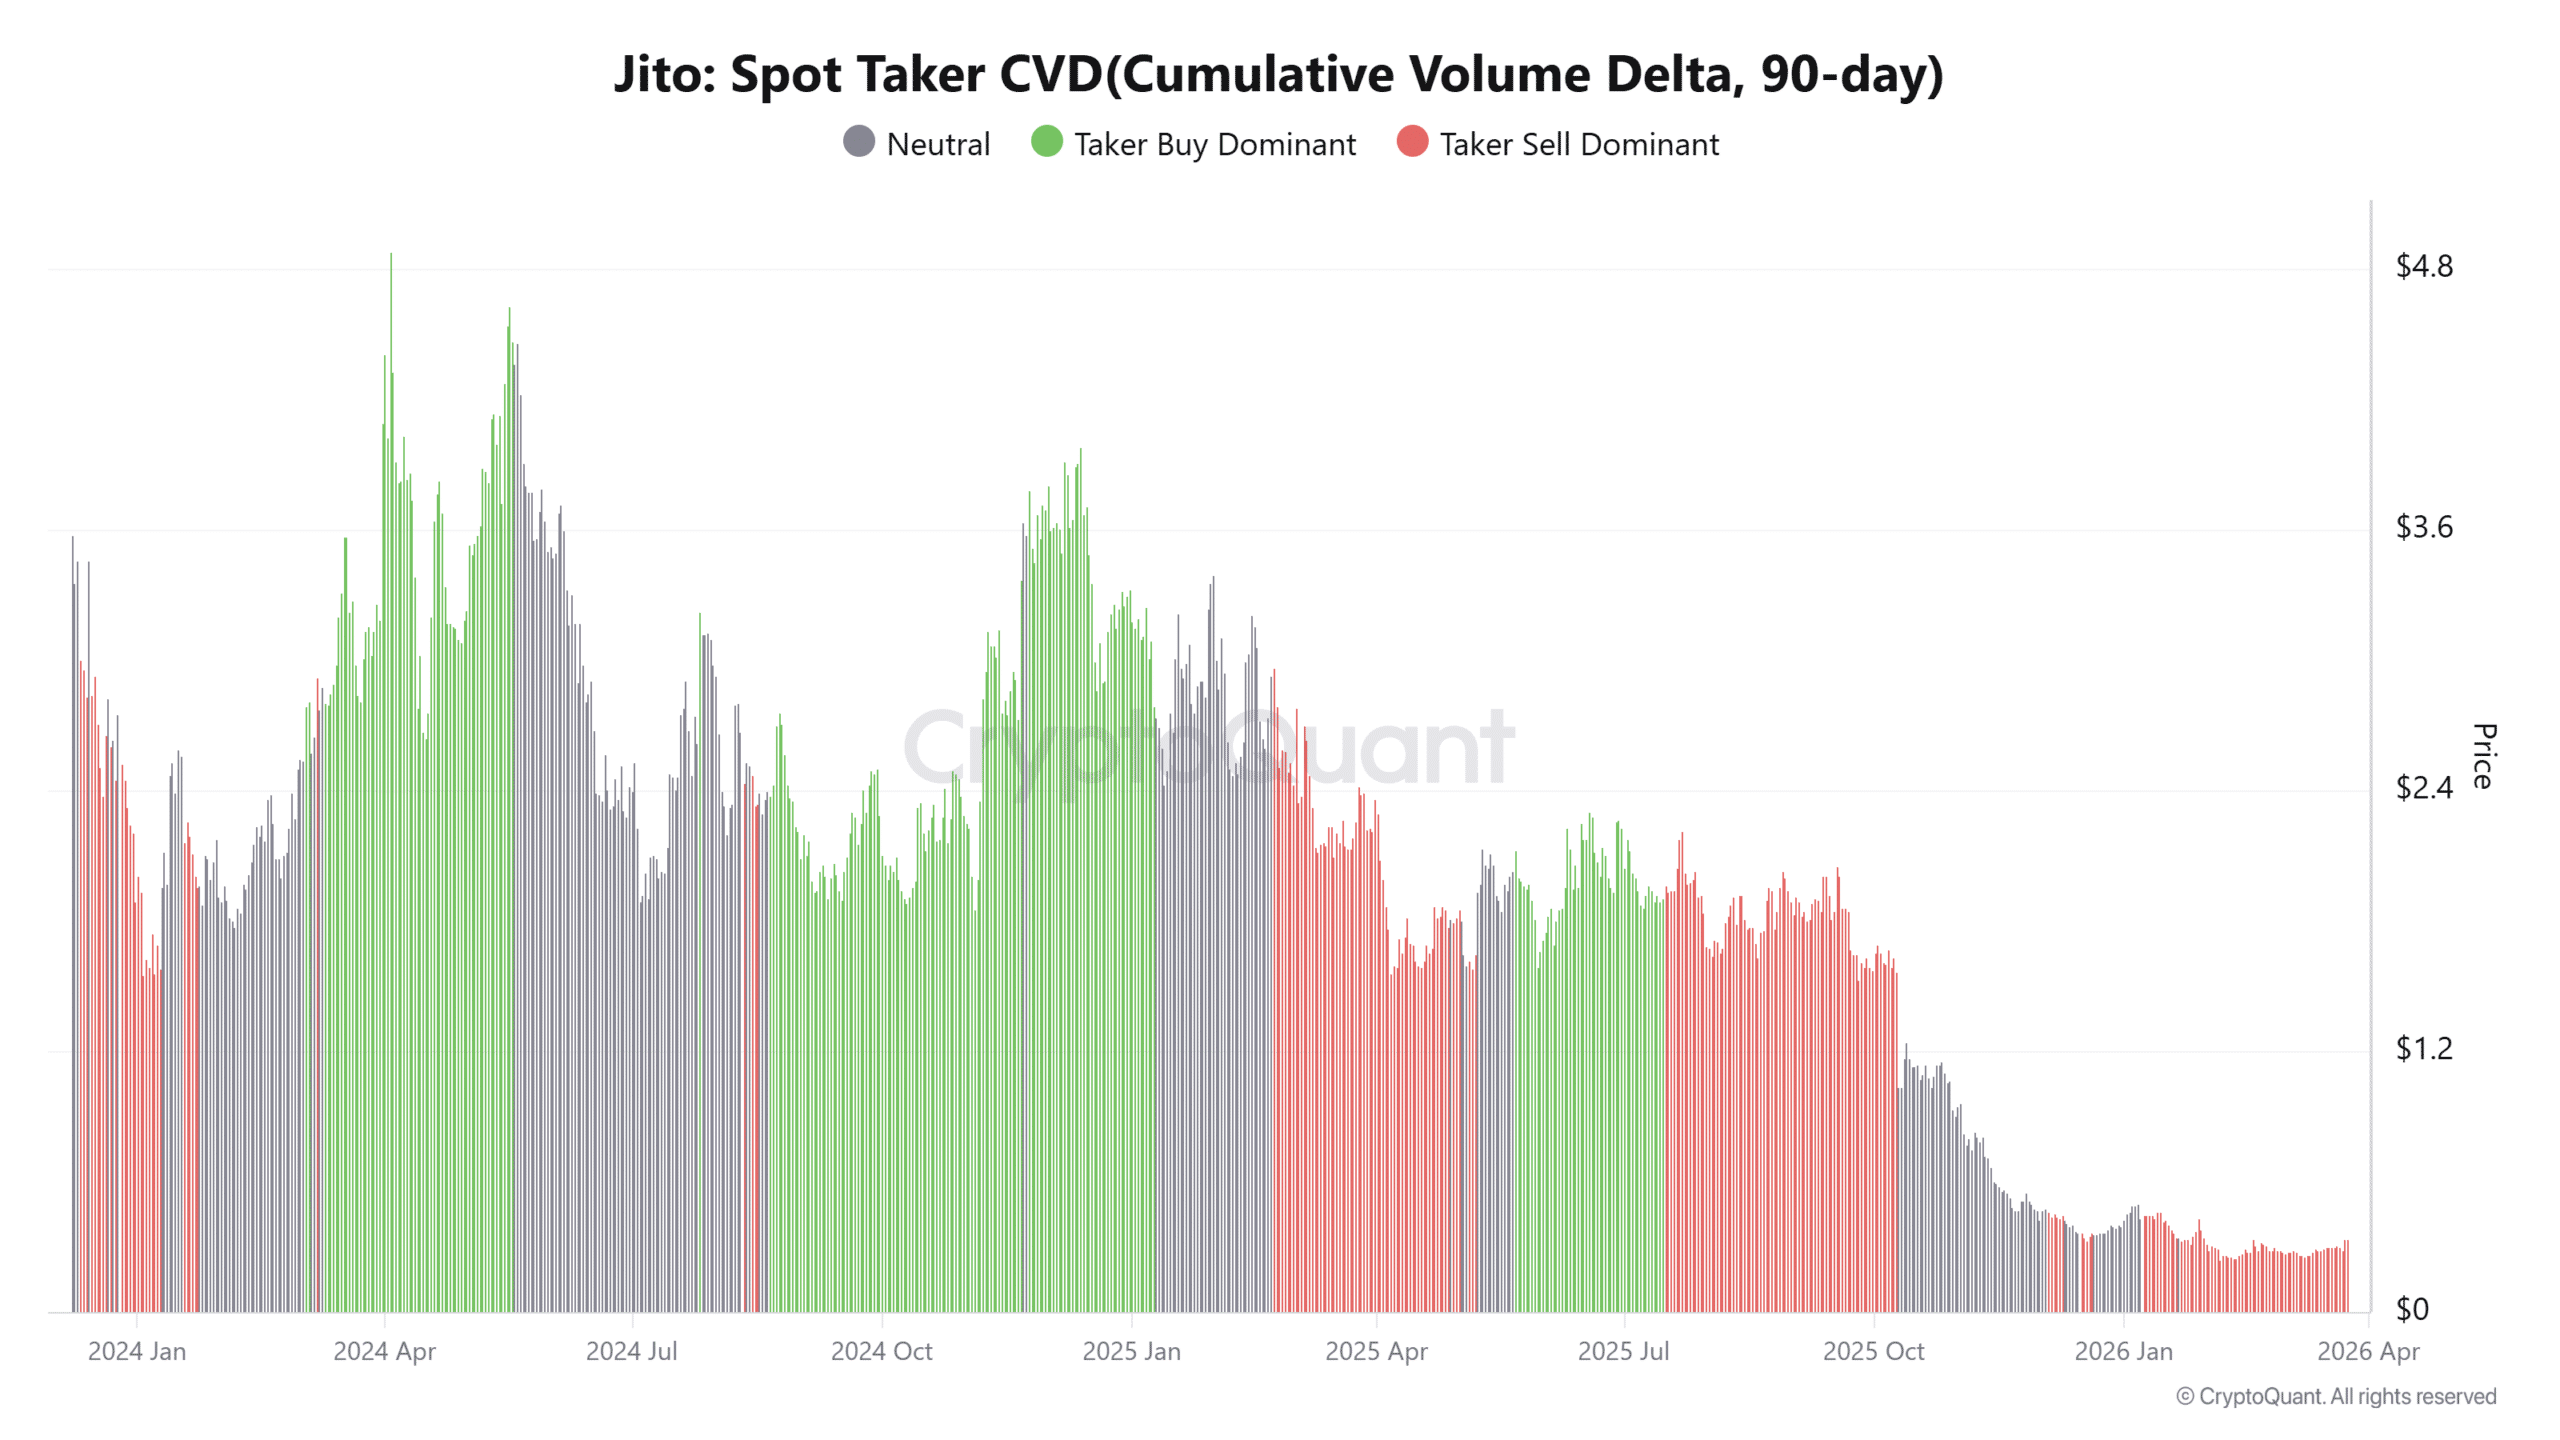
Давление продаж растет по мере того, как розничные трейдеры фиксируют прибыль
Несмотря на пробой цены, Spot Taker CVD остается доминирующим по продажам, показывая, что рыночные ордера продолжают склоняться к продаже, а не к покупке. Это расхождение подчеркивает ключевую динамику, при которой цена растет, даже несмотря на то, что участники фиксируют прибыль на силе.
Такое поведение часто отражает выход розничных трейдеров из позиций после ралли, в то время как более сильные игроки поглощают предложение. В результате текущее движение сильно зависит от того, будет ли это давление продаж эффективно поглощено.
Однако, если доминирование продаж сохранится без достаточного спроса, это может замедлить ралли и ограничить дальнейшее восходящее расширение.

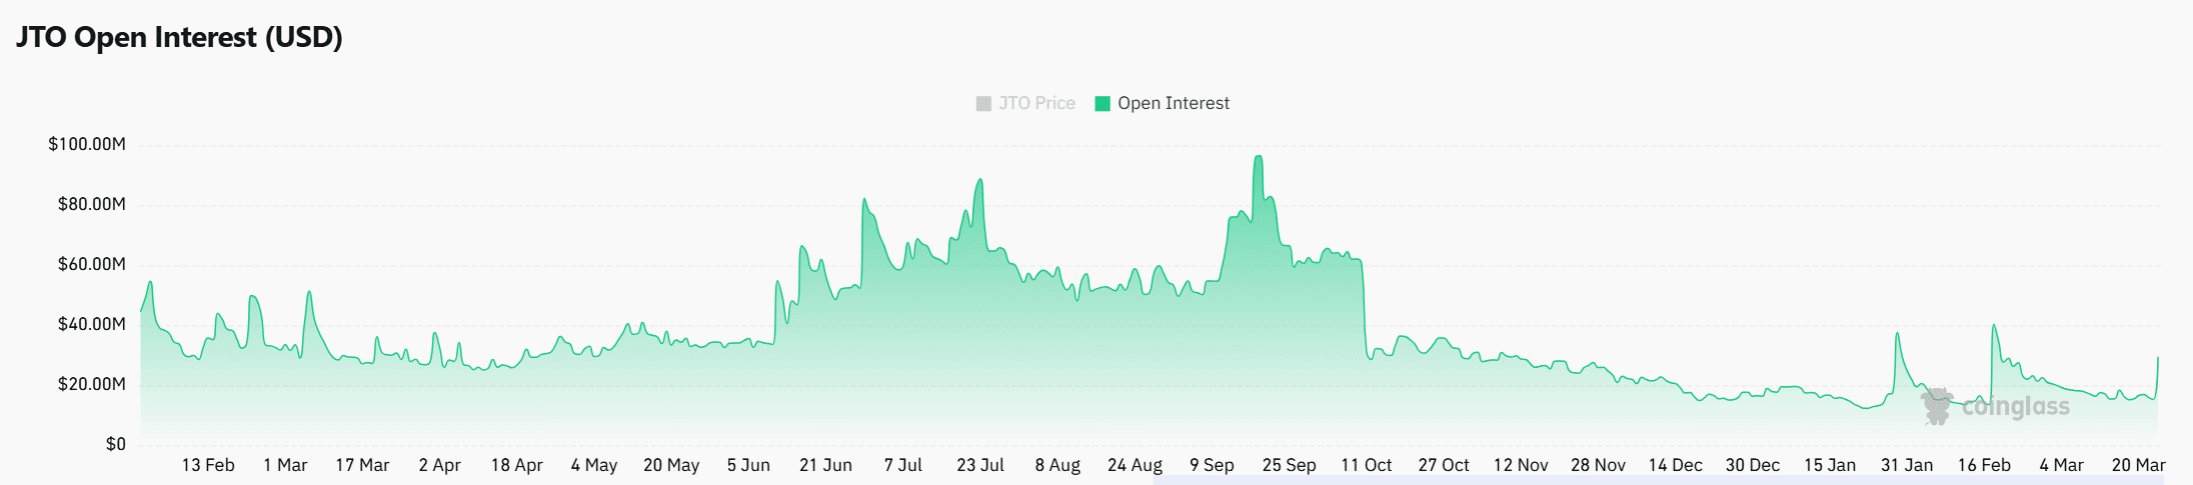
Кредитное плечо нарастает быстро по мере всплеска открытого интереса по JTO
Открытый интерес (OI) взлетел на 89,51% до $28,97 миллиона, что указывает на резкий рост позиций с плечом, поскольку трейдеры агрессивно входят на рынок. Это увеличение отражает растущее участие в деривативах, что обычно согласуется с сильными ожиданиями направления.
Поскольку цена и OI растут вместе, это suggests, что трейдеры строят позиции в ожидании продолжения роста. Однако такое быстрое расширение также introduces риск, поскольку переполненные позиции могут усилить волатильность.
Если цены продолжат расти, эти позиции могут подпитывать дальнейший рост за счет принудительных ликвидаций. С другой стороны, если цена остановится near resistance, то же самое плечо может быстро развернуться, спровоцировав резкие нисходящие движения, вызванные ликвидациями и закрытием позиций.

В заключение, пробой JTO отражает сильное структурное восстановление, поддержанное расширением объема и растущим плечом. Однако доминирующий на продажу порядок ордеров сигнализирует об активном фиксировании прибыли, что может ограничить рост, если спрос ослабнет.
Если покупатели продолжат поглощать давление продаж, пробой, вероятно, сохранится и продолжится вверх. Если нет, накопление позиций с плечом может ускорить резкий откат от текущих уровней сопротивления.
Итоговое резюме
- Пробой JTO отражает сильный контроль покупателей, но устойчивость зависит от поглощения постоянного давления со стороны продавцов near resistance.
- Рост плеча alongside price усилил бы прибыль, но также увеличивает риск резких нисходящих движений, вызванных ликвидациями.


