Недавнее восстановление цены Биткоина вновь разожгло оптимизм, но не все уверены, что рынок развернулся. Хотя цена показала признаки пробоя, криптоаналитик отмечает, что макроструктура BTC по-прежнему напоминает типичную структуру медвежьего рынка. Ключевой вопрос остается в том, сигнализирует ли недавний восходящий импульс о настоящем ценовом дне или же это просто очередной временный ралли перед дальнейшим падением.
Почему пробой цены Биткоина не является бычьим разворотом
В публикации на X во вторник, 17 марта, криптоаналитик Арди утверждал, что трейдеры неправильно интерпретируют недавний ралли Биткоина выше $75 000, предполагая, что любой пробой автоматически сигнализирует о конце медвежьего рынка. Он объяснил, что подобные всплески цены являются частью типичного функционирования медвежьих рынков.
Аналитик отметил, что пробои обычно формируют макроминимумы по ходу нисходящего тренда. Он подчеркнул, что эти ценовые ралли поначалу могут казаться сильными, но обычно они не длятся долго и, как правило, закладывают основу для следующего нисходящего движения.
Подкрепляя это, Арди указал на ценовое действие Биткоина в 2018 и 2022 годах как на наглядный пример. После достижения исторических максимумов в обоих годах рынок вступил в стадию устойчивого снижения, создав серию более низких максимумов. Он отметил, что в обоих медвежьих рыночных циклах было примерно пять восстановительных ралли.
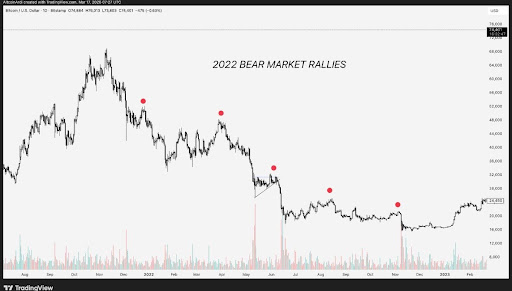
Поделившись графиком, показывающим восстановления Биткоина во время медвежьего рынка 2022 года, аналитик показал, что криптовалюта пережила резкие всплески в январе, апреле, июне, августе и ноябре. Каждое из этих восстановлений временно поднимало цену, но ни одно не развернуло общий нисходящий тренд. Он добавил, что при каждом отскоке давление продаж возвращалось, толкая рынок еще ниже.
Арди отметил, что этот недавний всплеск — первый отскок, который Биткоин испытал за пять месяцев, так что его время не является неожиданным. Он также подчеркнул, что многие трейдеры уже скорректировали свои прогнозы, закрыв медвежьи позиции после всего одной зеленой свечи. По его мнению, такая реакция показывает отсутствие продуманной торговой тезы.
Аналитик раскрывает, что на самом деле подтверждает дно
На вопрос об основе его медвежьего прогноза Арди отверг идею о том, что поведение Биткоина связано только с четырехлетним цикловым теорией. Аналитик сказал, что медвежьи рынки не зависят от этой циклической концепции и существовали бы независимо от нарратива. Он подчеркнул, что структура рынка и временные паттерны имеют больший вес.
Арди объяснил, что типичный рынок включает примерно три года восходящего движения, за которыми следует более короткая фаза снижения или консолидации. Этот период обычно длится от 9 до 12 месяцев и характеризуется низкой волатильностью и боковым движением цены. В течение этого периода рынок создает условия, необходимые для долгосрочного разворота.
Криптоаналитик также обозначил конкретные уровни, которые Биткоину необходимо отбить, прежде чем он сочтет, что дно достигнуто и последует бычий сдвиг. Он отметил, что криптовалюте необходимо подняться выше $85 000, а затем преодолеть $96 000 более чем на 3%, чтобы указать на подлинное изменение импульса.
Без выполнения хотя бы одного из этих условий, он считает, что рынок не предоставил достаточных доказательств для поддержания устойчивого восходящего движения. Пока этого не произойдет, Арди утверждает, что отскок цены Биткоина не подтверждает рыночное дно. График медвежьего рынка 2022 года демонстрирует, что множественные ралли могут происходить в рамках более широкого нисходящего тренда, и что одной лишь краткосрочной силы недостаточно, чтобы сигнализировать о длительном развороте цены.


