Один адрес на Polymarket превратил $35 000 в $442 000, получив 12,6-кратную прибыль. Примечательно, что позиция была открыта за несколько часов до крупного рыночного движения, и к моменту распространения новостей по основным каналам сделка уже была практически закрыта. Это не единичный случай: до того, как новости о политическом событии «Вторжение в Венесуэлу» стали публичными, три адреса заранее заняли позиции и в совокупности заработали $630 000 на этом же событии.
Если бы подобная торговля происходила на традиционных финансовых рынках, это легко можно было бы объяснить асимметрией информации. Однако на рынках прогнозов все потоки средств и изменения позиций записываются в публичном блокчейне, здесь нет скрытых счетов или частных сделок.
Публичность не означает отсутствия разрыва. Ключевой момент не в том, можно ли увидеть сделки, а в том, можно ли выявить действительно информационно ценные сигналы в огромном массиве данных.
Каждая сделка на Polymarket — это публичные данные
Многие участники прогнозных рынков по-прежнему рассматривают Polymarket как традиционную платформу для ставок: отслеживают коэффициенты, выбирают направление и делают ставки на результат. Но базовая структура Polymarket полностью отличается от DraftKings или обычных спортивных ставок. Все сделки происходят в блокчейне, потоки средств, размеры позиций, время входа и выхода — все это находится в открытом доступе. Пути операций тех адресов, которые демонстрируют наиболее точные суждения и самое острое чувство времени, — это не предположения постфактум, а записи в блокчейне, видимые в реальном времени.
API Polymarket также открыт. Данные о сделках, рыночные данные, исторические сделки — любой может напрямую их запросить, никаких барьеров доступа не существует.
Следовательно, разрыв заключается не в том, кто может видеть данные, а в том, кто может извлечь из них смысл. Информация в блокчейне публична, но真正有价值的 — это те кошельки, за которыми стоит持续跟踪, а также способность распознавать изменения в их поведении до того, как цена fully отразит эту информацию.
Какими характеристиками обычно обладают настоящие «инсайдерские адреса»?
Важно подчеркнуть, что не каждый прибыльный кошелек означает наличие инсайдерской информации. Некоторые трейдеры обладают扎实的研究能力, другие полагаются на количественные модели и алгоритмические преимущества. Но когда прибыль и определенные модели поведения反复叠加, можно наблюдать структурные特征, отличающиеся от «удачи».
· Первый тип: Комбинация нового адреса и аномально крупной ставки
Кошелек, созданный всего несколько дней назад, с очень небольшим количеством сделок, внезапно вкладывает крупную сумму в нишевой рынок с низкой ликвидностью — такое поведение встречается нечасто. Особенно при отсутствии公开催化因素, крупное集中льное открытие позиций часто имеет более сильную информационную составляющую.
· Второй тип: Высокоспециализированная торговая область
Некоторые адреса не работают across рынками, а长期专注于某一特定 нише и демонстрируют стабильно высокий процент выигрышей в этой области. Они не диверсифицируются across цены на криптовалюты, выборы, спорт и другие сектора, а концентрируют усилия на одной теме, и их решения о позициях более решительны.
· Третий тип: Аномальные изменения размера позиции
Когда адрес,长期 делавший ставки среднего размера, внезапно значительно увеличивает позицию на определенном рынке, такое поведение часто означает изменение силы убежденности. Размер позиции сам по себе является态度, и внезапное изменение масштаба обычно отражает обновление информации или уверенности.
· Четвертый тип: Слишком точный выбор времени
Единичное заблаговременное открытие позиции можно списать на совпадение, но если某地址多次在重大消息公布前数小时完成建仓, и направление consistently совпадает, такое опережение по времени трудно объяснить просто удачей. Один раз — случайность, многократное повторение —更可能 отражает информационное преимущество.
Как систематически отбирать потенциальные «адреса с информационным преимуществом»
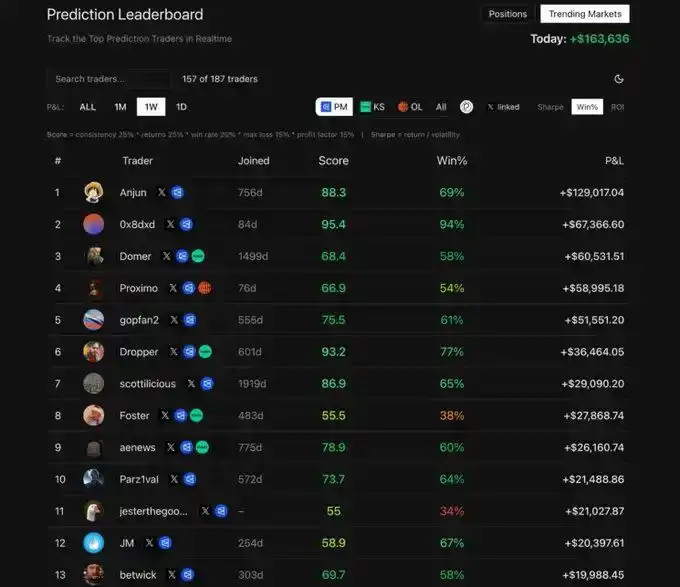
· Шаг 1: Анализ производительности в рейтингах Polymarket
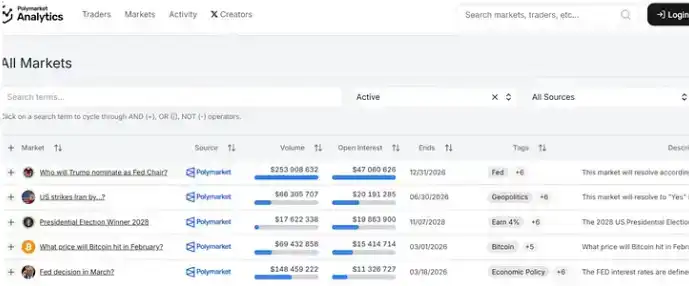
Можно начать с рейтинга Polymarket Analytics (ссылка: https://polymarketanalytics.com/traders), отсортированного по прибыли/убытку за 30 дней, используя стабильную прибыльность в近期作为 первичный критерий фильтрации. Сосредоточьтесь на那些地址, которые в整体 имеют положительную прибыль за 30 дней, процент выигрышей выше 55%, и общая прибыль значительно превышает общий убыток. Также необходимо убедиться, что их торговля сконцентрирована на рынках с реальной ликвидностью, а не на событиях с низким объемом торгов.
Цель на этом этапе — не прямое определение наличия информационного преимущества, а составление списка для наблюдения за地址, демонстрирующими стабильную прибыльность. Стабильная记录 о прибыли является основой для последующего анализа поведения.
· Шаг 2: Анализ структуры позиций в конкретных событиях
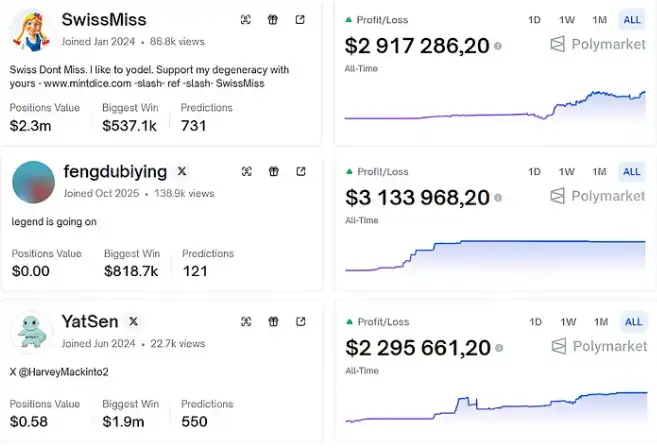
После первоначального отбора можно углубиться в конкретные торговые события. Зайдите на активные预测 рынки и посмотрите список Крупнейших держателей (Top Holders) для этого события. Polymarket публично отображает адреса с наибольшими текущими позициями, эти крупные позиции часто представляют более сильную убежденность.
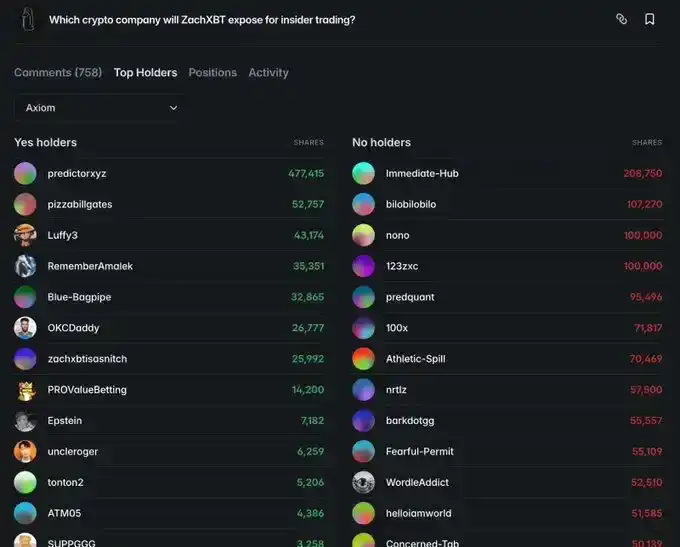
Ключевой момент не в том, попал ли某地址单次重仓, а в том, является ли его поведение устойчивым. Если кошелек反复 появляется в списках крупных держателей по нескольким важным событиям, и эти позиции открыты до того, как рынок fully оценил ситуацию, то сама эта повторяемость является сигналом.
Одиночное成功可能只是偶然, но多次在早期阶段大额建仓、方向一致且结果验证的行为,往往意味着其判断体系具备稳定优势.
· Шаг 3: Анализ торгового поведения и времени открытия позиций
Выбрав候选地址, необходимо further проанализировать их историю транзакций в блокчейне, уделяя особое внимание времени открытия позиций, структуре позиций и ритму удержания.
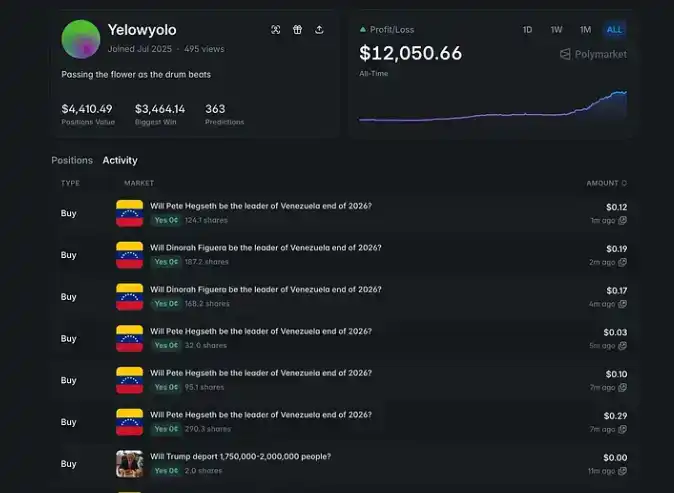
Во-первых, observe время открытия позиции. Если покупка происходит за несколько часов до официального объявления новостей и多次 повторяется, само преимущество по времени становится важной переменной; а вход после освещения в СМИ, скорее всего, является просто следствием информации.
Во-вторых, analyze способ открытия позиции. Опытные трейдеры обычно открывают позиции частями, постепенно наращивая, в то время как кошельки с сильным информационным判断ом往往 быстро完成集中布局 в короткие сроки, поскольку их временное окно ограничено.
В-третьих, обратите внимание на период удержания. Некоторые高质量地址 выбирают выход в середине развития тренда, а не ждут конца экстремальных колебаний, что указывает на то, что их цель — зафиксировать основной тренд, а не получить маржинальную прибыль.
Наконец, observe их trading диапазон. Адреса,高度专注于单一细分领域 в长期,更容易形成稳定的信息优势; адреса,频繁跨赛道操作,则更可能依赖市场情绪而非特定领域判断.
Продвинутые стратегии отслеживания адресов
После освоения базовых методов отбора真正拉开差距的是 дальнейшая детализация поведения资金.
Во-первых, необходимо关注 выход, а не только время входа. Адреса с информационным преимуществом往往 не только提前 занимают позиции, но и主动 сокращают их до появления потенциальных негативных факторов. Когда крупный адрес,长期稳定持仓, внезапно значительно сокращает позицию при отсутствии очевидных催化因素, информационная ценность этого действия часто выше, чем первоначальное действие покупки. Особенно когда масштаб сокращения достигает значительной доли, само это изменение является сигналом.
Во-вторых, можно проводить кластерный анализ кошельков на основе данных блокчейна. Связи между адресами并非完全不可追踪. Одинаковые источники средств, похожие модели использования Gas, сделки, происходящие последовательно в очень короткие промежутки времени, — все это может выявить отношения между адресами. Многие看似 «новые» аккаунты часто можно отследить до长期活跃的老地址 через 2–3 перевода средств. Отслеживание по пути движения средств помогает выявить новые потенциально高质量账户 до того, как рынок обратит на них внимание.
Кроме того, следует关注 аномальные изменения объема торгов на непопулярных рынках. Если на рынке с обычно небольшим объемом торгов, при отсутствии公开消息, внезапно наблюдается значительный приток средств,这种结构性放量往往 означает, что некоторые участники рынка уже提前 действуют. Анализ конкретных адресов,推动成交量变化, может помочь сформировать新的观察名单.
Наконец, можно проводить перекрестную проверку поведения в блокчейне с внешней公开信息. Так называемый «индекс пиццы» (Pizza Index) когда-то предсказывал потенциальные военные действия по аномальным изменениям в количестве заказов в пиццериях вокруг Пентагона. Аналогичным образом, данные отслеживания рейсов, активность в социальных сетях ключевых лиц, изменения в公开 расписании и другая информация могут служить подтверждением или обратной проверкой для поведения позиций в блокчейне. Взаимосвязь между потоком средств в блокчейне и сигналами из реального мира часто может усилить надежность判断.