Earning Millions Daily in a Sluggish Market: Is Pump.fun's Revenue Real?

marsbitОпубликовано 2026-03-21Обновлено 2026-03-21

Введение

Despite a perceived market downturn, pump.fun remains a top revenue-generating crypto-native application, ranking fourth in earnings behind only Tether, Circle, and Hyperliquid across various timeframes. Its daily income consistently exceeds one million USD, derived from three primary sources: a 0.95% protocol fee on bonding curve transactions, a token’s "graduation" fees on Pumpswap, and revenue from its acquired multi-chain trading platform, Terminal (formerly Padre). On-chain analysis confirms the bonding curve revenue is authentic, with no evidence of fake transfers or data manipulation. However, questions arise about the organic nature of this activity. While Solana’s daily active addresses range between 1.2-2.2 million, pump.fun sees about 150,000, with roughly 30,000 new tokens deployed daily. Data suggests a significant portion of tokens are launched by a small group of sophisticated deployers, not organic users. Moreover, research indicates that 98.6% of tokens on pump.fun are pump-and-dump schemes, turning the platform into a low-cost, high-efficiency "casino" where deployers profit at the expense of retail investors. Despite pump.fun using nearly all its income to buy back its native token, $PUMP, the price continues to fall due to a lack of buyer confidence and organic demand. The fundamental issue is not revenue authenticity but the platform's role in facilitating a predatory ecosystem, making it unattractive to long-term institutional investment.

Author: BlockBeats

"What other crypto-native applications can still make money?"

When it comes to this question, you might instinctively think—stablecoins, CEXs, Perp DEXs, on-chain Pokémon cards...

And pump.fun, this application that was once infinitely glorious during the meme frenzy and created one of the largest IPOs in cryptocurrency history, is starting to be easily forgotten. Even in some conversations, I heard questions like:

"Is pump.fun still alive? Can they still make money?"

pump.fun not only can still make money, but it remains a top-tier "money printer" among crypto-native applications. Statistics on DefiLlama show that across any time frame—24 hours, 7 days, 30 days, or 1 year—pump.fun's revenue is firmly in 4th place, only behind Tether, Circle, and Hyperliquid.
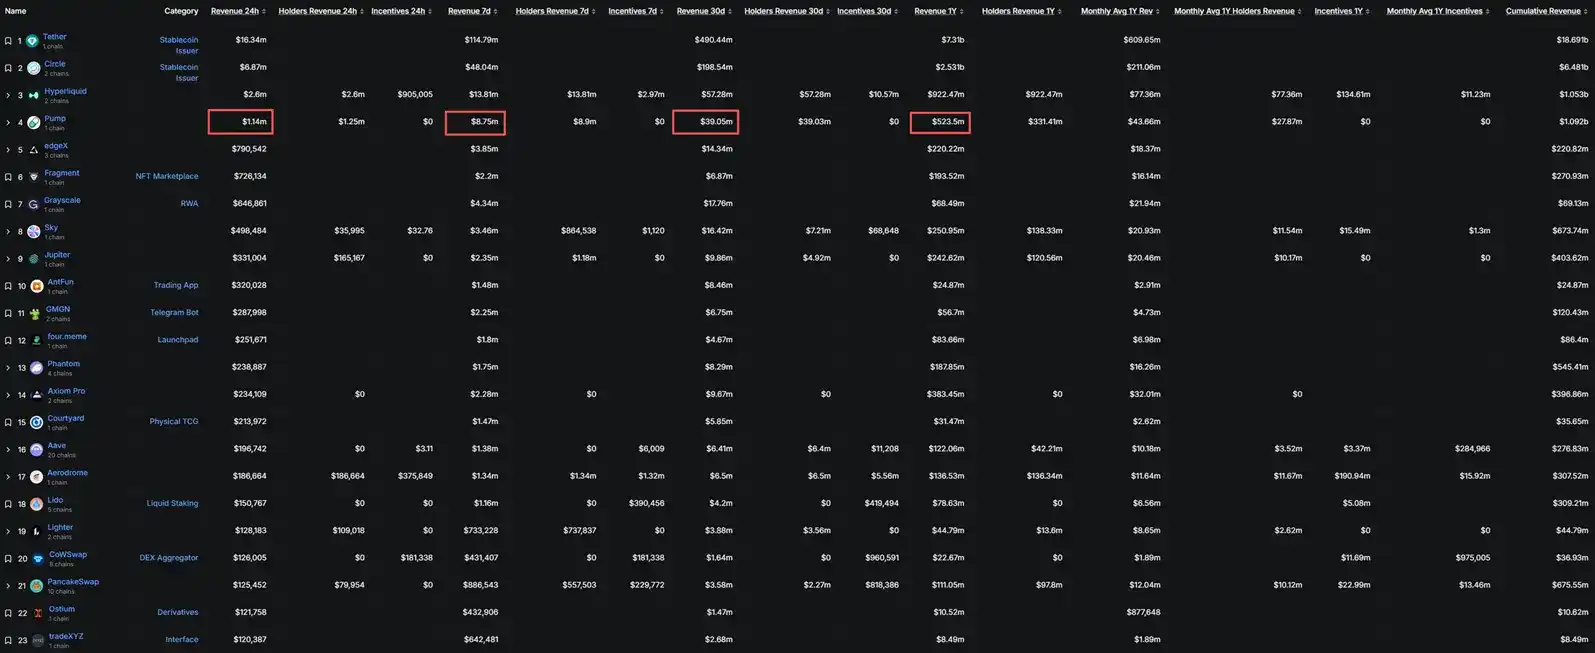
Although various "dog coin hunting" chat groups are冷冷清清, many with not a single message for days, pump.fun's average revenue over the past 7 or 30 days still exceeds one million dollars per day.

Is this real revenue, or is pump.fun faking it?

Is pump.fun's revenue real?

First, according to pump.fun's official revenue dashboard, its current revenue consists of three parts:

- Bonding curve revenue: Transaction fee income before a new token "graduates." pump.fun charges a 0.95% protocol fee on these transactions.

- Pumpswap revenue: For new tokens that have successfully graduated (migrated to the Pumpswap AMM for trading), a 0.93% protocol fee is charged on transactions for tokens with a market cap of 0-420 SOL.

- Terminal (Padre) revenue: pump.fun acquired the trading terminal Padre in October last year and rebranded it as the multi-chain trading platform Terminal. Revenue from this trading platform is now also counted as pump.fun revenue.

- Revenue is net of referral rebates and trading cashback.

For protocol revenue from the bonding curve phase, the Solana address used by pump.fun official to receive this portion of revenue is CebN5WGQ4jvEPvsVU4EoHEpgzq1VV7AbicfhtW4xC9iM. The bonding curve revenue aggregated to this address is hardcoded into the contract. If fake revenue were being created by externally transferring funds to this address, there would necessarily be external addresses directly calling the System Program's Transfer instruction. After analyzing the transactions for this address, we found no evidence of any伪造收入的行为 through simple, external SOL transfers.

This means that the bonding curve revenue确实完全来自于真实合约调用的协议手续费抽成。

DefiLlama's pump.fun bonding curve revenue data is obtained by directly calling pump.fun's official API, which is why we first conducted an on-chain analysis of pump.fun's official bonding curve revenue address. However, DefiLlama's calculations for Pumpswap and Terminal (Padre) revenue are done through Dune SQL queries of on-chain Solana data,完全不依赖 pump.fun 官方的 API,具有极高的链上客观性和不可篡改性。

At this point, we have ruled out the suspicion that pump.fun is faking revenue through "external transfers" or "falsifying data" in a simple and crude manner. However, the possibility remains that they could be generating fake revenue through "wash trading" using bots or internal wallets. Therefore, we must ask further—given the current overall sluggish state of the cryptocurrency market, with meme coin热度更是大幅退潮, is pump.fun's revenue real and organic?

The reasonableness of pump.fun's revenue in the current market environment?

According to data on Token Terminal, during the first quarter of this year, the daily active address count on Solana stabilized between 1.2 million and 2.2 million, while on pump.fun it was approximately 150,000.

Simultaneously, according to data from Dune's pump.fun related statistical dashboard, these 150,000 addresses correspond to approximately 30,000 new token deployments per day.

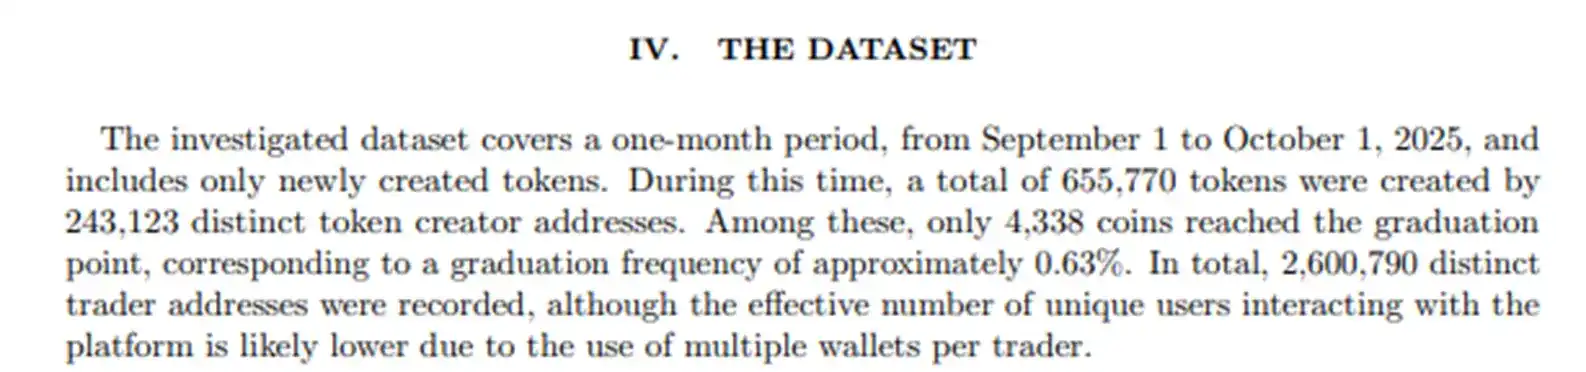
This means that if all 30,000 new tokens per day were deployed spontaneously by different real users, then about 20% of pump.fun's active users are launching new coins every day. However, according to a paper titled "Predicting the success of new crypto-tokens: the Pump.fun case" published last month by Giulio Marino et al., from September 1, 2025, to October 1, 2025, a total of 655,770 new tokens were deployed on pump.fun, yet the number of addresses deploying tokens was only 243,123.
And the current daily number of token deployments is even higher than last September:

Combined with the current market environment, this data is somewhat "counter-intuitive"—on social media, it feels like cryptocurrency is almost finished, yet on pump.fun, so many new tokens are still being deployed every day. Also, the number of active addresses over the past month is about 10% higher than last September.

In pump.fun's daily million-dollar revenue, Pumpswap and Terminal (Padre) still account for a relatively "small portion." Taking the data from March 18 as an example, the revenue from Pumpswap and Terminal (Padre) on that day was approximately $284,000 and $58,000 respectively, while the revenue from the bonding curve was about $795,000, roughly 2.3 times the sum of the former two.

The new token graduation rate has recently even reached more than twice that of last September:
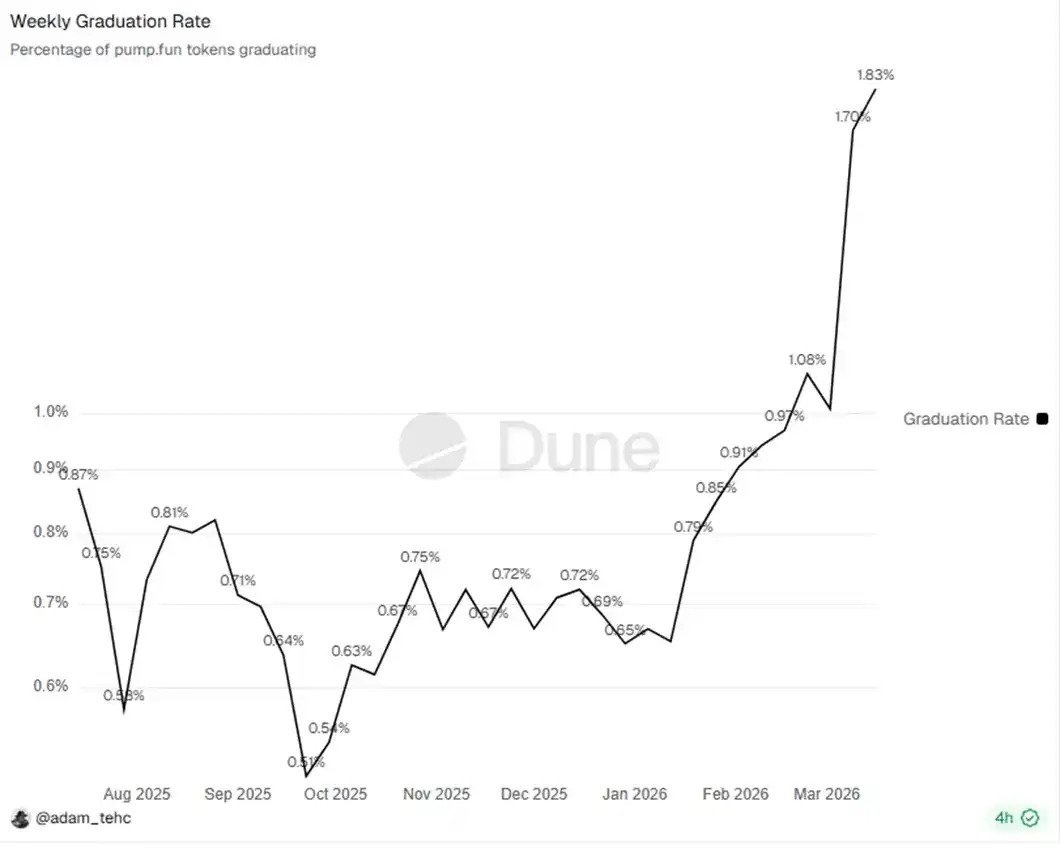
Simultaneously, approximately 26,000 new tokens were deployed on pump.fun that day. To achieve $795,000 in bonding curve revenue, a bonding curve trading volume of $795,000 / 0.95% (the protocol fee rate charged by the bonding curve) ≈ $83,684,200 is required. Averaged across each newly deployed token, each newly deployed token needs to contribute an average of about $3,218 in trading volume before successfully graduating.

If we combine the above data, an average of just over $3,000 in trading volume per new token doesn't sound that difficult; in fact, it seems quite normal, because even in September of last year, when the data was全面落后, pump.fun was still able to achieve this goal. If calculated in SOL terms, they are earning more SOL now than in September last year, it's just that the USD-denominated revenue has decreased.

But at this point, we still have questions: Since last August, pump.fun has been using almost its entire daily revenue to回购 $PUMP. To date, they have repurchased over 10% of the total supply and over 30% of the current circulating supply of $PUMP. Why then does the price of $PUMP keep falling? Although on-chain data shows that the repurchased $PUMP, worth over $300 million, remains untouched in wallets, could it be that they are creating fake revenue through wash trading, "repurchasing" on one hand while secretly selling off through分散的地址?

Where did the $PUMP go?

Let's look at the $PUMP token release schedule:
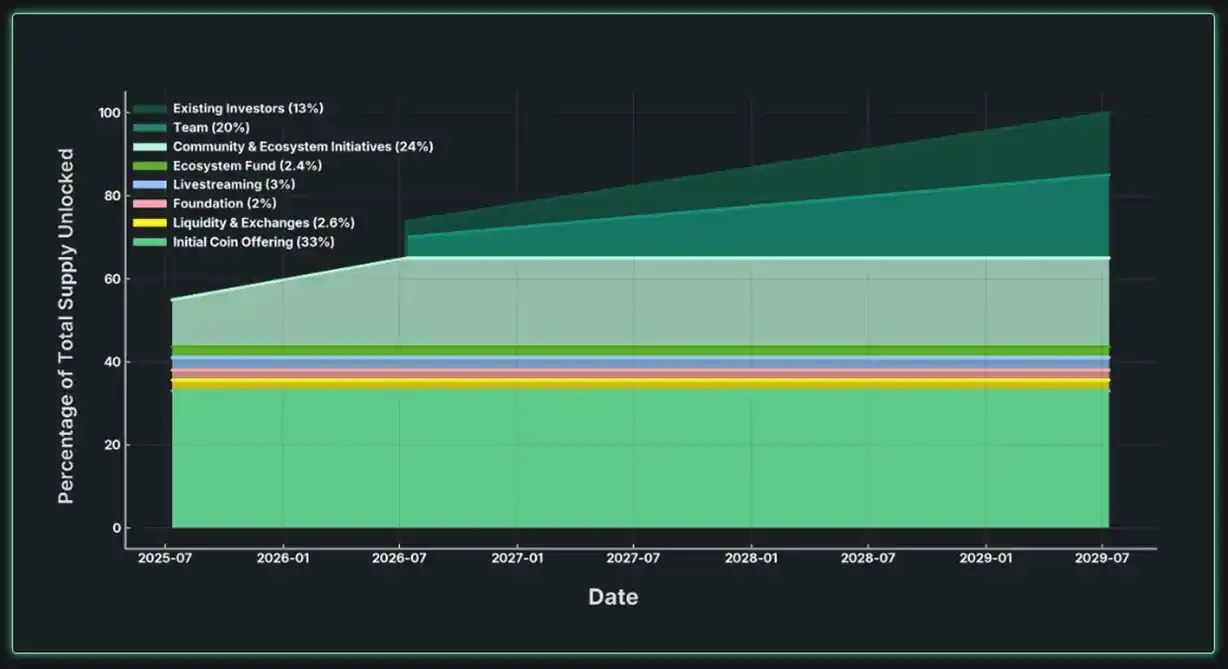
So far, the circulation of $PUMP is as follows:

- ICO: 33%, fully unlocked at TGE.

- Team: 20%, still locked.

- Investors: 13%, still locked.

- LP and Exchanges: 2.6%, fully unlocked at TGE.

- Ecosystem Fund: 2.4%, fully unlocked at TGE.

- Live Streaming Support: 3%, fully unlocked at TGE.

- Foundation: 2%, fully unlocked at TGE.

- Community and Ecosystem Incentives: 24%, approximately 50% unlocked at TGE, the remaining portion unlocks linearly over 1 year. Currently, 65.27% of this portion has been unlocked.

The $PUMP multi-sig custodial wallet with the address Cfq1ts1iFr1eUWWBm8eFxUzm5R3YA3UvMZznwiShbgZt currently holds approximately 36.5% of the total supply of $PUMP.

This does not match the $PUMP token release schedule. What we can明确的是 is that after TGE, all $PUMP was transferred to the multi-sig custodial wallet for distribution. The theoretical maximum transferable amount is only about 58.67% of the total supply (ICO 33% + LP and Exchanges 2.6% + Ecosystem Fund 2.4% + Live Streaming Support 3% + Foundation 2% + Community and Ecosystem Incentives unlocked portion ~15.67%). The $PUMP balance in the multi-sig custodial wallet should not be lower than approximately 41.33%. The difference is about 4.83%.

Where did this 4.83% go? We don't know. We don't even know where the $PUMP for the other parts, which have clearly defined用途 in the description, are located beyond the ICO sale distribution. Although by comparing on-chain data, we did find that approximately 24% of the total supply of $PUMP was transferred in large amounts to various addresses and has remained silent ever since, roughly corresponding to the portions other than the ICO sale distribution, pump.fun official has never disclosed the storage addresses corresponding to the funds for each part of the wallet.

Especially for the community and ecosystem incentives part, the only community and ecosystem incentive activities we can publicly know about are大概只有 the Glass Full Foundation (which bought approximately $1.7 million worth of meme coins within the pump.fun ecosystem), grants of $10,000 each to 6 meme coin communities (totaling $60,000), and a hackathon that funded 12 projects with $25,000 each (totaling $300,000 promised but only 6 winners announced so far).

And yet, this part is already the most clear...

But even with this transparency issue, even if the 4.83% was secretly sold off, pump.fun official's large-scale repurchase of over 10% of the total supply and over 30% of the current circulating supply should be able to offset this selling pressure. Why then is the price performance of $PUMP still languishing?

A possible reason is that $PUMP truly lacks sufficient buy-side demand. In the face of a lack of market recognition, even large-scale repurchases are like mud牛入海 (a Chinese idiom meaning something disappears without a trace).

The Unrecognized "Casino"

When talking about Hyperliquid, we affirm its leading position in Perp DEX and narrative potential. But for pump.fun's meme coin track, even retail investors mostly consider it a scam, unsustainable.

In the earlier part of the article, we acknowledged the authenticity of pump.fun's revenue. Now we need to look at some other data. This data can show that the poor perception of meme coins is not just simple感性厌恶 from retail investors experiencing the剧烈波动 of meme coins, but also creates理性抗拒 among institutional investors.

As early as last April, research by Medallion Analytics showed that over a 180-day statistical period, among approximately 178,000 deployers who launched multiple tokens, 85.3% of them were profitable. Within 180 days, these deployers launched a total of approximately 3.59 million tokens, and the profitable deployers launched about 3.07 million of them, a proportion of about 85.5%.

During the statistical period, the top 10 profitable deployers profited approximately 365,000 SOL, while the 10中等 deployers in terms of profitability could only profit 47.3 SOL, a difference of about 7720 times. For the top deployers, the average interval between new token issuances was only 0.11 hours, while for medium deployers it was as long as 10.96 hours.

Solidus Labs studied the performance of newly deployed tokens on pump.fun between January 2024 and March 2025. The analysis pointed out that a staggering 98.6% of the tokens were pump-and-dump scams.
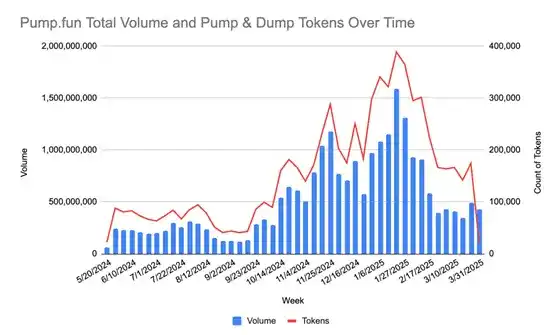
Meme coin issuance has long ceased to be a competition of creativity, but an assembly line for issuing coins and profiting. Top deployers, after making extremely short-cycle rapid profits, can then invest funds into facilities related to automatic coin issuance, making their harvesting speed even faster.

pump.fun has driven the cost of issuing new meme coins on Solana down to $2 or even less, which is indeed a technological advancement. However, they have not guided the meme coin track towards a benign development direction, making retail and institutional investors believe that meme coins are indeed a cultural or even belief-based asset. They tried to broaden the track to直播币, ICM coins, and recently AI Agent coins, but none of these attempts have been successful.

The data is there. The money they make the most is still earned by providing "low-cost harvesting tools," just like a casino taking a cut.

For pump.fun, deployers earn a risk-free 0.95% return for every new coin they issue and for every bit of fake volume they wash trade before the token graduates. If you want your token to get more exposure, you need to wash trade even more volume, providing pump.fun with even more revenue. The funds in this ecosystem are real, the revenue is real, but the ecosystem itself is non-organic, and retail investors are hurt. For institutional investors, such an ecosystem lacks a healthy, sustainable long-term foundation, which is perhaps the fundamental reason for pump.fun's depressed token price.

In the end, we have one more question:

Since pump.fun's repurchases cannot boost the token price, wouldn't using the daily revenue for staking rewards be better than the current repurchase strategy?

Maybe, or maybe they just don't care anymore.

Связанные с этим вопросы

QIs pump.fun's daily revenue of over a million dollars real, and how is it verified?

AYes, pump.fun's revenue is real and verified through on-chain analysis. The bonding curve revenue is collected via a smart contract address with no external SOL transfers, and the Pumpswap and Terminal(Padre) revenues are calculated from immutable Solana on-chain data via Dune SQL, independent of pump.fun's API.

QWhat are the main sources of pump.fun's revenue?

Apump.fun's revenue comes from three main sources: 0.95% protocol fees from bonding curve transactions before a token graduates, 0.93% protocol fees from trades of graduated tokens on Pumpswap (for tokens with a market cap of 0-420 SOL), and revenue from the Terminal (formerly Padre) multi-chain trading platform acquired in October.

QWhy is the price of $PUMP token performing poorly despite significant buybacks?

AThe $PUMP token price remains low primarily due to a lack of buy-side demand and market recognition. Despite the team buying back over 10% of the total supply (over 30% of the circulating supply), the ecosystem is seen as a non-organic 'casino' for meme coin scams, which discourages institutional and long-term investor interest.

QWhat does the data say about the legitimacy and success rate of tokens launched on pump.fun?

AData from Solidus Labs indicates that 98.6% of tokens launched on pump.fun from January 2024 to March 2025 were pump-and-dump scams. While a small percentage of deployers (largely automated, top-tier ones) are highly profitable, the vast majority of tokens are designed for rapid, short-term exploitation rather than genuine community or cultural value.

QHow does the current activity and token deployment on pump.fun compare to market sentiment?

ADespite a bearish overall market sentiment, on-chain data shows that pump.fun's activity has increased. Daily active addresses are up about 10% compared to September, with approximately 30,000 new tokens deployed daily. However, this high volume is largely driven by automated, profit-focused deployers rather than organic user growth, creating a disparity between on-chain metrics and negative public perception.

Похожее

Индекс Sci-Tech Innovation 50 вырос на 10.73%: почему китайские акции показали «V-образный разворот»?

После нескольких дней снижения китайский фондовый рынок продемонстрировал сильный отскок. 21 июля основные индексы пережили V-образный разворот и резко выросли. Индекс STAR 50 подскочил на 10.73%, достигнув максимального однодневного роста за год. Шанхайский композитный индекс вырос на 1.79%, индекс Shenzhen Component — на 4.81%, а индекс ChiNext — на 7.05%. Объем сделок на трех биржах составил 2.97 трлн юаней. Более 3100 акций выросли в цене, свыше 100 достигли лимита роста. Ведущей силой восстановления стал сектор полупроводников, где активно росли акции компаний, занимающихся оборудованием, памятью, кремниевыми пластинами и HBM. Соответствующие тематические ETF также показали резкий рост. Сильный отскок рынка объясняется сочетанием трех факторов. Во-первых, на рынок вышли различные источники финансирования, включая "государственные фонды", страховые компании, а также выкуп акций компаниями и управляющими фондами. Это укрепило ликвидность и доверие инвесторов. Во-вторых, регуляторы, в частности председатель Комиссии по ценным бумагам Китая, заявили о приверженности поддержанию стабильности рынка. В-третьих, стабилизация и восстановление зарубежных рынков, особенно в Южной Корее, создали благоприятную внешнюю среду. Аналитики полагают, что наиболее паническая фаза для технологического сектора, вероятно, уже позади. Хотя краткосрочные колебания могут сохраниться, фундаментальные тренды, такие как спрос на вычисления для ИИ и импортозамещение в полупроводниковой отрасли, остаются неизменными. Среднесрочная динамика будет зависеть от новых отраслевых стимулов и подтверждения результатов компаний во время сезона отчетности.

marsbit29 мин. назад

Индекс Sci-Tech Innovation 50 вырос на 10.73%: почему китайские акции показали «V-образный разворот»?

marsbit29 мин. назад

Акции технологических компаний с импульсом показали крупнейший в истории рост за один день, но завершился ли обвал?

Технологические акции с высоким моментом (momentum stocks) в США продемонстрировали рекордно сильный однодневный рост во вторник, 21 июля. Индекс модности TMT Morgan Stanley вырос более чем на 12%, что стало самым большим суточным скачком в истории, превысив даже показатели периода пузыря доткомов в 2000 году. Ключевым драйвером выступили полупроводники: индекс Philadelphia Semiconductor Index подскочил на 4,6%. Этот резкий отскок произошел после трехдневного падения и кумулятивного снижения акций с моментом на 33%, которое стало одним из самых сильных со времен краха доткомов. Основной причиной роста стала "паническая скупка" (short squeeze), когда инвесторы, игравшие на понижение, были вынуждены закрывать свои позиции, создавая восходящую спираль. Однако внутренняя структура рынка остается слабой: объемы торгов были низкими, а в индексе S&P 500 количество падающих акций превышало количество растущих, что указывает на узкий, а не широкий характер восстановления. Мнения аналитиков разделились. Стратег BTIG Джонатан Крински предупреждает, что рост достиг ключевого уровня сопротивления, и рекомендует фиксировать прибыль, ожидая скорой остановки ралли. С другой стороны, аналитики Goldman Sachs и UBS считают, что распродажа активов с моментом подходит к концу, и видят возможность для постепенного увеличения позиций, особенно в акциях, связанных с ИИ. Дальнейшая динамика будет сильно зависеть от сезона корпоративных отчетов, ключевым событием которого станут результаты Alphabet (GOOGL) и ее ориентиры по капитальным затратам. Потенциальной угрозой для рынка акций остается рынок облигаций: доходности гособлигаций США растут, отчасти из-за роста цен на нефть, и их дальнейший рост может оказать давление на фондовый рынок. Таким образом, несмотря на впечатляющий однодневный рост, сохраняется значительная неопределенность относительно того, закончилась ли коррекция.

marsbit36 мин. назад

Акции технологических компаний с импульсом показали крупнейший в истории рост за один день, но завершился ли обвал?

marsbit36 мин. назад

Акции технологического импульса в США установили рекордный однодневный рост, но закончился ли обвал?

Акции технологических компаний с высоким импульсом («моментум») на рынке США показали рекордный рост во вторник, 21 июля. Индекс TMT-моментум Morgan Stanley вырос более чем на 12%, что стало самым большим однодневным скачком в истории. Причиной столь резкого роста стал эффект «сжатия коротких позиций» (short squeeze), когда продавцы, открывшие короткие позиции на фоне предыдущего падения импульсных акций на 33%, были вынуждены их закрывать, подпитывая восходящую динамику. Однако аналитики отмечают, что внутренняя структура рынка остается слабой: объемы торгов были низкими, а при общем росте индекса S&P 500 количество падающих акций превышало количество растущих. Это указывает на то, что восстановление затронуло лишь узкий круг наиболее популярных бумаг, таких как акции полупроводниковых компаний (индекс Philadelphia Semiconductor Index вырос на 4.6%). Стратеги разделились в оценках перспектив. BTIG советует сокращать позиции на росте, считая, что индекс импульсных акций уперся в ключевой уровень сопротивления. Напротив, Goldman Sachs и UBS полагают, что волна распродаж близка к завершению, и рекомендуют постепенно наращивать позиции. Ключевым фактором для определения устойчивости восстановления станут корпоративные отчеты. Особое внимание рынка приковано к отчету Alphabet (GOOGL) и новым прогнозам по капитальным затратам, которые дадут сигнал о перспективах инвестиций в ИИ. Одновременно фондовый оптимизм омрачается ростом доходности гособлигаций США и цен на нефть, что создает макроэкономические риски. Таким образом, несмотря на впечатляющий однодневный отскок, волатильность на рынке, вероятно, сохранится.

链捕手38 мин. назад

Акции технологического импульса в США установили рекордный однодневный рост, но закончился ли обвал?

链捕手38 мин. назад

Bitcoin подает 3 сигнала макро-дна — Но сможет ли BTC достичь $70 тыс.?

Рынок переходит от обсуждения локального дна к поиску макро-дна для биткоина. Аналитик Али Мартинес указывает на появление трех технических сигналов, исторически совпадавших с макро-низами циклов: месячный RSI около 43.65, осциллятор Чанде (CMO) на уровне -71 и цена рядом со скользящей средней за 50 месяцев. Эта комбинация наблюдалась в 2015, 2019 и 2022 годах, каждый раз предшествуя масштабным ралли. Несмотря на прорыв выше $66 000 и оптимистичные технические сигналы, ключевым испытанием остается ликвидность. Доминирование стейблкоинов растет, но их общая капитализация снизилась более чем на $10 млрд за месяц. Данные показывают отток стейблкоинов с бирж в течение 35 дней подряд при отсутствии значительного накопления биткоина на спотовом рынке. Таким образом, хотя техническая картина указывает на формирование макро-дна, для уверенного движения к $70 000 требуется приток свежей ликвидности, который пока отсутствует.

ambcrypto42 мин. назад

Bitcoin подает 3 сигнала макро-дна — Но сможет ли BTC достичь $70 тыс.?

ambcrypto42 мин. назад

Вечно вместе и снова порознь: Когда L1 становится собственным Rollup, что ждет Ethereum в финале?

Стремясь решить проблему масштабируемости, Ethereum изначально принял стратегию, где L1 выступает в качестве безопасного, но дорогого уровня расчетов, а Rollup на L2 предоставляют дешевое пространство для выполнения транзакций. Однако по мере того, как L1 сам развивает свои возможности (увеличение лимита газа, безсостоятельность, zkEVM), его пропускная способность значительно возрастает. Это ставит под вопрос уникальную ценность L2, основанную лишь на низкой стоимости транзакций. В ответ Ethereum пересматривает отношения между L1 и L2. L1 должен стать мощным, устойчивым глобальным хабом для расчетов, общего состояния и ликвидности. Роль L2 смещается от простого расширения к предоставлению дифференцированных функций, таких как оптимизация под конкретные приложения, конфиденциальность или гибкие модели управления, формируя спектр сред выполнения с разной степенью наследования безопасности Ethereum. Ключевой вызов фрагментированной многокомпонентной экосистемы — взаимодействие. Улучшение пользовательского опыта сосредоточено на нативной абстракции аккаунтов (например, EIP-7702) и межоперабельности. Цель — позволить Ethereum «снова ощущаться как единый блокчейн». Это включает в себя фреймворки интентов (intents), такие как Open Intents Framework, и протоколы межоперабельности (Ethereum Interop Layer), которые упрощают кросс-чейн взаимодействия. Сокращение времени финализации транзакций на L1 с минут до секунд также критически важно для эффективной работы мостов и приложений. Интригующая перспектива, выдвинутая исследователями, — это возможная конвергенция архитектур L1 и L2. С внедрением систем доказательств (например, zkEVM) на основном уровне, валидаторы L1 могут начать проверять состояние с помощью доказательств, а не повторного выполнения, что делает сам Ethereum в некотором роде «своим собственным Rollup». Одновременно концепция Native Rollup предполагает более тесную интеграцию проверки L2 в протокол L1. Это может привести к размытию четких границ между уровнями, превратив Ethereum в единую систему консенсуса с множеством специализированных сред выполнения (доменов), которые разделяют общую основу безопасности, ликвидность и надежную синхронизацию состояния. Таким образом, эволюция Ethereum движется от разделения выполнения для масштабирования к повторной интеграции разрозненных компонентов в единую, но разнородную экосистему. Итогом может стать не иерархия L1/L2, а сеть взаимосвязанных сред, которые вместе образуют целостный и мощный Ethereum.

链捕手53 мин. назад

Вечно вместе и снова порознь: Когда L1 становится собственным Rollup, что ждет Ethereum в финале?

链捕手53 мин. назад

Торговля

Спот
活动图片