Цена Dogecoin (DOGE) неуклонно приближается к критическому уровню, который может определить её следующее значительное движение. По словам криптоаналитика, внимательно отслеживающего движение цены мемной монеты, реакция на этом ключевом уровне может сформировать «дивергенцию» — технический паттерн, часто связанный с крупным разворотом тренда.
Настройка дивергенции Dogecoin может спровоцировать следующее движение
Во вторник, 17 февраля, криптоаналитик NaBer поделился свежими обновлениями по Dogecoin в посте в X, предоставив свои последние инсайты о недавнем движении цены мемной монеты. В частности, он выделил ключевую горизонтальную зону вокруг $0,10 на графике DOGE, отметив, что эта область будет его основной зоной наблюдения, если он задумает увеличить свою позицию.
Аналитик признался, что уже владеет некоторым количеством токенов DOGE по цене около $0,10, и изложил простой план в зависимости от того, сможет ли мемная монета удержаться или сформировать дивергенцию. На представленном недельном графике видно, как цена Dogecoin сжимается непосредственно над долгосрочной полосой поддержки, которая ранее выступала в качестве сопротивления в более ранних циклах. Эта поддержка отмечена зеленой горизонтальной зоной вокруг $0,07 и $0,10.
Интересно, что фокус NaBer сосредоточен не только на горизонтальной поддержке, но и на структуре. На графике видна последовательность более низких максимумов, причем недавний максимум колебания значительно упал ниже предыдущих пиков. В то же время недельные свечи приближаются к поддержке, с легкой нисходящей линией тренда, давящей сверху справа, и ценовое действие сжимается в сужающийся клин у горизонтальной поддержки.
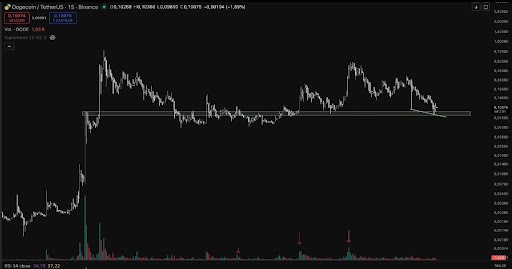
В то время как цена Dogecoin устанавливает новые минимумы вокруг поддержки $0,10, Индекс Относительной Силы (RSI) на графике находится на уровне 34,78, снизившись с предыдущего значения 37,22, что указывает на то, что импульс выравнивается. NaBer заявил, что хочет увидеть возможную дивергенцию и, в идеале, некоторый объемное участие на младших таймфреймах (LTF), сигнализирующее о том, что покупатели поглощают предложение в этом диапазоне.
Аналитик также четко дал понять, что он намерен внимательно следить за структурой ABC или импульсом на LTF, прежде чем делать какие-либо агрессивные прогнозы. Он согласился, что импульсное движение будет достаточным подтверждением формирования дивергенции.
Медвежий канал DOGE разворачивается в бычий
В своем последнем анализе Dogecoin эксперт Trader Tardigrade заявил, что цена DOGE официально перешла от нисходящего тренда в нисходящем канале к восходящему тренду в восходящем канале. По его словам, цена мемной монеты недавно вышла из своей медвежьей структуры и протестировала нижнюю поддержку ниже $0,083.
После этого Dogecoin вошел в новый бычий канал и теперь движется вверх в рамках более высоких минимумов и более высоких максимумов. Trader Tardigrade охарактеризовал такое ценовое поведение как классический разворот тренда. Он сказал, что Dogecoin наконец-то сменил импульс, прогнозируя возможный рост цены до $0,165.