Continuing our consistent structured analysis framework this week, we focus on two key assets, Bitcoin and HYPE, dissecting the current price action across multiple timeframes. We will examine the ongoing battle between bulls and bears at critical resistance and support zones and formulate specific, actionable operational plans accordingly.
Last week's short position successfully realized a gain of 2.78%, once again validating the trading logic of "signal-driven, disciplined execution." However, a single profitable trade never implies the market direction is definitively correct—the market always retains the potential to move beyond expectations.
The core variable for this week remains the struggle between the resistance zone of $78,500~$79,500 and the support zone of $73,500~$75,000. The outcome will be left for the market to decide.
Summary of This Week's Core Trading Views:
• Analysis of BTC's Multi-Timeframe Price Structure. (Detailed in Part 1)
• BTC Market Forecast and Medium-/Short-Term Trading Strategies for This Week. (Detailed in Part 2)
• Analysis of HYPE's Hourly Chart Price Structure. (Detailed in Part 3)
• HYPE Market Forecast and Short-Term Trading Strategy for This Week. (Detailed in Part 4)
Verification of Last Week's Trading Strategy and Core Views:
• BTC Short-Term Trade Performance: Bitcoin executed one short-term short trade last week (1x leverage), successfully achieving a return of approximately 2.78%. (Detailed in Table 1)
• Market Verification of BTC Trend Forecast: In last week's article, we stated: If the price effectively breaks below the support zone of $78,500~$79,500, it will test the support strength near $75,000. The current market movement has verified our previous forecast.
1. Analysis of Bitcoin's Multi-Timeframe Price Structure
1.1 BTC Daily Chart Structure Analysis
Bitcoin _ Daily Chart:
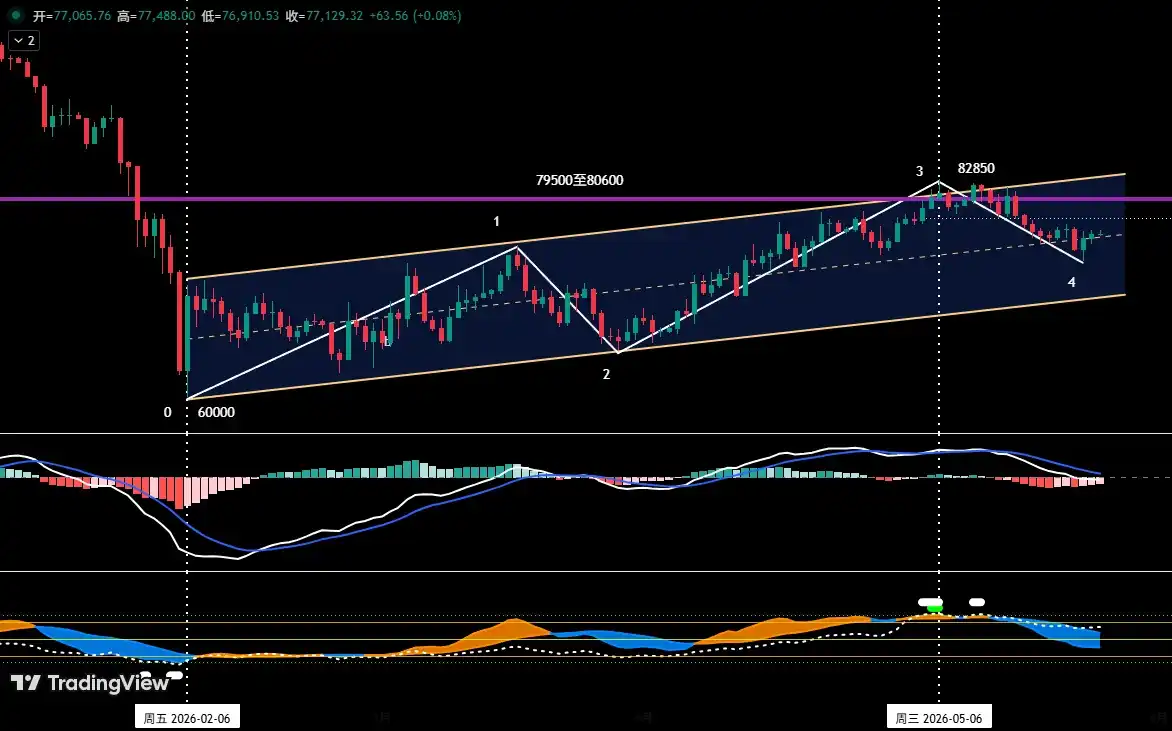
Figure 1
• As shown in (Figure 1), since establishing a significant low near $60,000 on February 6, 2026, Bitcoin's daily chart has constructed and maintained a clearly defined ascending channel: its lower boundary is formed by connecting the lows of February 6 and March 29, while the upper boundary is drawn parallel to the lower boundary through the high of March 17.
• In our weekly review on April 27, we pointed out: "The current price is facing dual resistance from the channel's upper boundary and the $79,500 to $80,600 resistance zone. A breakout is expected to be difficult." Subsequent market action validated this view. After nearly 20 days of struggle between bulls and bears, although a new rebound high of $82,850 was reached on May 6, the price failed to decisively break above this resistance area and subsequently began a corrective pullback.
• From the current structure, the price has retraced from near the channel's upper boundary to the mid-channel area. If the price fails to find effective support near the mid-channel and resume its uptrend, the probability of it seeking support at the channel's lower boundary increases.
1.2 In-Depth Analysis of BTC's Hourly Chart Structure
Bitcoin _ 4-Hour Chart
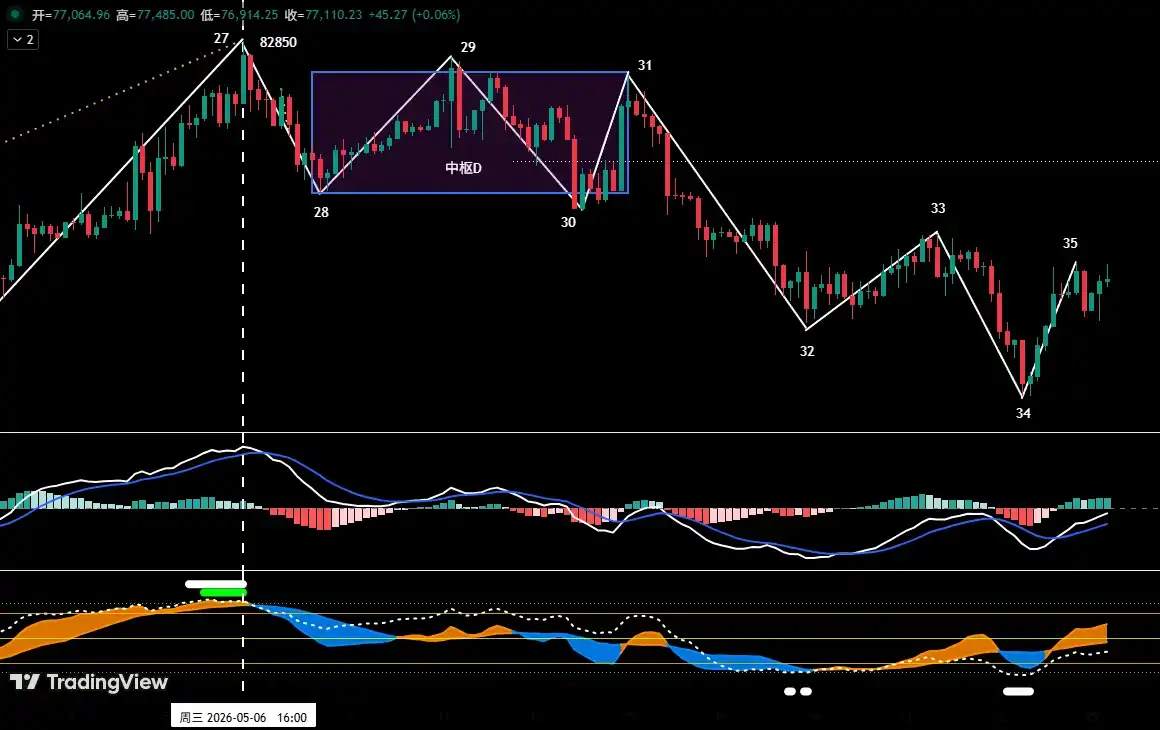
Figure 2
As shown in (Figure 2), from the high of $82,850 on May 6 to the present correction:
• The 4-hour chart shows it can be subdivided into an 8-segment corrective structure: "segment 27-28" to "segment 34-35". Center D: Segments 28-29, 29-30, and 30-31 overlap, constituting Center D.
• From the 4-hour price structure, segment 34-35 is about to rebound to the $78,500~$79,500 zone. If the rebound faces rejection upon reaching this area and fails to form a decisive breakout, the market is likely to continue its current corrective consolidation pattern and test the core support band of $73,500~$75,000 again.
2. Bitcoin Market Forecast and Trading Strategy for This Week
2.1 BTC Market Trend Forecast for This Week:
This week's core view: Focus on the outcome of the battle between bulls and bears over the $78,500~$79,500 resistance zone and the $73,500~$75,000 support zone.
2.2 Core Resistance Levels:
• Primary Resistance Zone: $78,500~$79,500 area (near the boundaries of two centers)
• Secondary Resistance Zone: $83,500~$84,500 area (previous high-volume trading congestion zone)
2.3 Core Support Levels:
• Primary Support Zone: $73,500~$75,000 area (previous significant support level)
• Secondary Support Zone: $69,500~$70,500 area (previous significant support level)
2.4 Trading Strategy for This Week (Excluding Impact of Sudden News)
1. Medium-Term Strategy:
Bitcoin _ Daily Chart: (Position Monitoring Model)
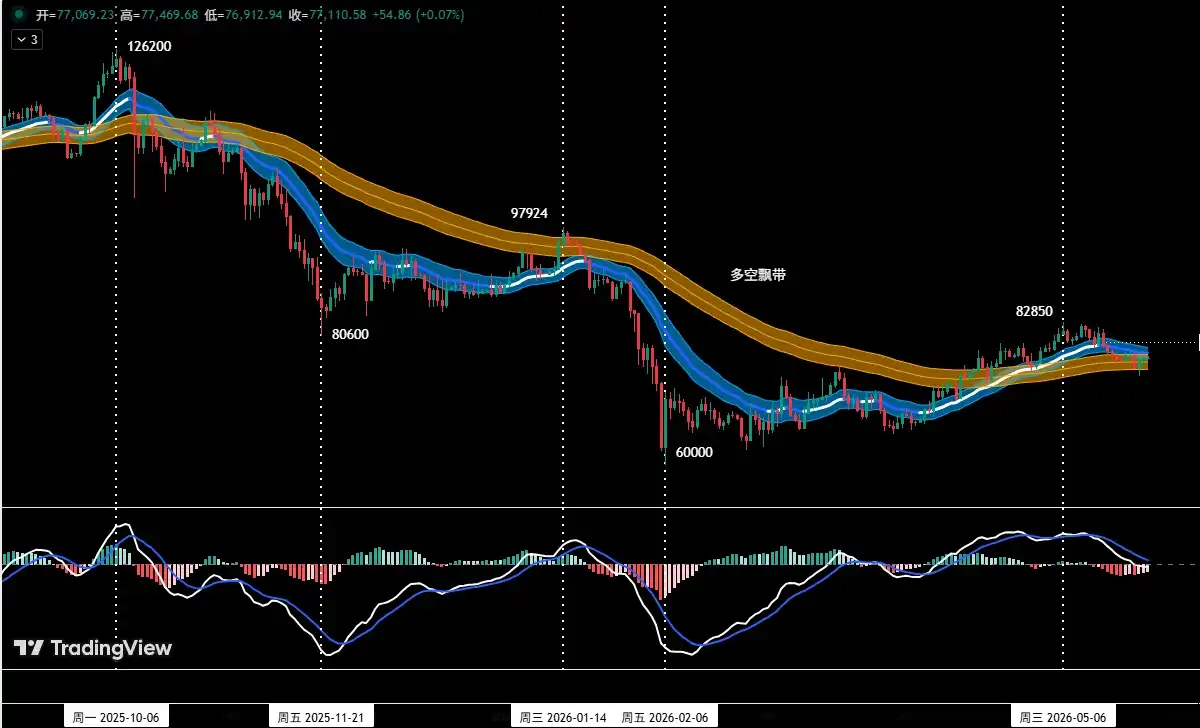
Figure 3
Position Monitoring Model: As shown in (Figure 3), based on trading rules, the medium-term market direction is not yet clear. Maintain a neutral/观望 stance for medium-term positions this week.
2. Short-Term Strategy: Utilize 30% of capital, set stop-losses, and look for "spread" trading opportunities based on support and resistance levels. (Using 30-minute/60-minute charts as the operational timeframe).
3. For short-term operations, to dynamically adapt to the market's complex evolution, we have pre-formulated two specific operational plans: A/B.
• Plan A: Rebound Faces Resistance, Sell High.
• Entry: When the price rebounds to the $78,500~$79,500 zone and encounters resistance, combined with a top signal from the quantitative model, a short position of less than 30% can be established.
• Risk Control: Initial stop-loss set above $80,600.
• Exit: When the correction approaches important support levels combined with model signals, gradually close the position to take profits.
• Plan B: Support Breached Effectively, Follow the Trend Short.
• Entry: When the price effectively breaks below the $73,500~$75,000 support zone combined with a model top signal, a short position of less than 30% can be established.
• Risk Control: Initial stop-loss set above $76,500.
• Exit: When the decline reaches important support levels combined with model signals, gradually close the position to take profits.
3. Analysis of HYPE's Price Structure
HYPE_4-Hour Chart
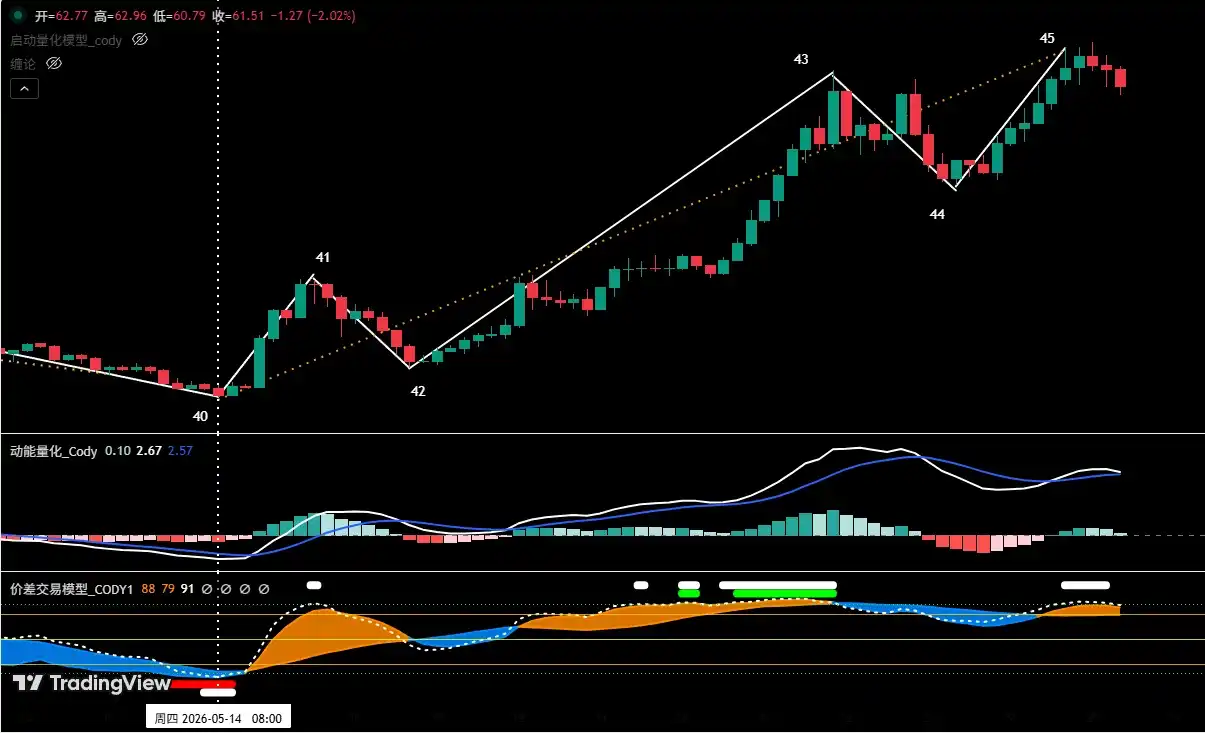
Figure 4
1. As shown in (Figure 4), the rally in HYPE from the low of $38.14 on May 14, on the 4-hour chart, can be divided into a five-segment structure: 40-41, 41-42, 42-43, 43-44, 44-45.
2. Our proprietary "Spread Trading Model" shows that near endpoint 45, a top warning signal (white dot) has been triggered.
3. From the perspective of the "Momentum Quantitative Model," the rising segment (44-45) near $65 has shown signs of waning upward momentum.
4. If a bearish momentum divergence forms at the "endpoint 45" position, overlapping with the top warning signal from the "Spread Trading Model," creating a共振 (resonance), the probability of the price forming a short-term high here increases significantly.
4. HYPE Market Forecast and Short-Term Trading Strategy for This Week
4.1 HYPE Market Trend Forecast for This Week:
This week's core HYPE view:
• Observe whether "endpoint 45" can form a short-term high since the rally began on May 14.
• If a short-term high forms, subsequently look for short-term long opportunities after the price pulls back to a key support area (e.g., $47.5 to $50) and shows clear signs of stabilization.
4.2 HYPE Short-Term Trading Strategy for This Week: (Buy on Support)
Currently, adhere to the strategy of "avoid盲目追涨 (blindly chasing rallies), buy on dips." If the price corrects to the $47.5 to $50 zone, finds support, and shows stabilization signals, combined with bottom signals triggered by both models, consider a light long position. Position size must be controlled below 30%, with strict stop-loss discipline.
5. Trade Review
5.1 Short-Term Trade Review:(See Table 1)
Strictly following the operational plan, based on trading signals from our proprietary "Spread Trading Model" and "Momentum Quantitative Model," we completed one short-term (short) trade last week, achieving a profit of 2.78%.
5.1 Bitcoin Short-Term Trade Details Summary: (Leverage*1x)

Table 1
5.2 Short-Term Trade Review: (See Figure 5)
• Entry Strategy:
a. When the price rebounded to near $78,500, encountered resistance, and showed bearish pressure signals, with the candlestick forming a "top reversal" bearish signal;
b. The "Spread Trading Model" triggered a top warning signal (white dot), and the "Momentum Quantitative Model" formed a bearish momentum divergence signal.
Therefore, we established a 30% short position at $77,782.
• Exit Strategy:
a. When the price fell to near $75,000 and found support, with the candlestick forming a "bottom reversal" signal;
b. The "Spread Trading Model" triggered a strong bottom warning signal (red dot + white dot), forming a bottom共振 (resonance) signal with the "Momentum Quantitative Model."
Therefore, we closed the entire position near $75,616.
• Summary: This trade successfully realized a profit of approximately 2.78%.
BTC_30 Minute Chart: (Momentum Quantitative Model + Spread Trading Model)
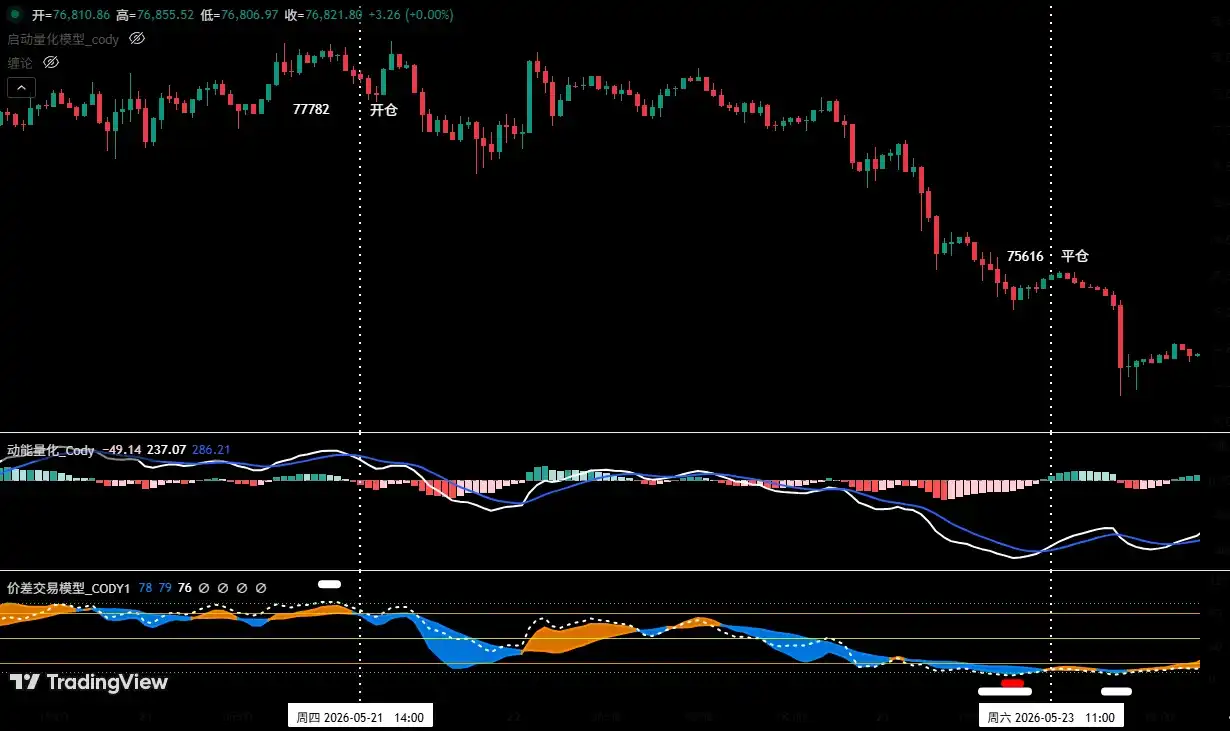
Figure 5 (Short-Term Trade Illustration)
6. Special Reminders:
1. Upon Entry: Immediately set the initial stop-loss.
2. When Profit Reaches 1%: Move the stop-loss to the entry price (breakeven point) to ensure principal safety.
3. When Profit Reaches 2%: Move the stop-loss to the 1% profit level.
4. Continuous Tracking: Thereafter, for every additional 1% profit, move the stop-loss up by 1%, dynamically protecting and locking in profits.
Financial markets are瞬息万变 (constantly changing). All market analysis and trading strategies require dynamic adjustment. All views, analytical models, and operational strategies mentioned in this article are derived from personal technical analysis, intended solely for personal trading journal purposes. They do not constitute any investment advice or operational basis. The market involves risks; invest with caution. Do not make decisions based solely on this content.