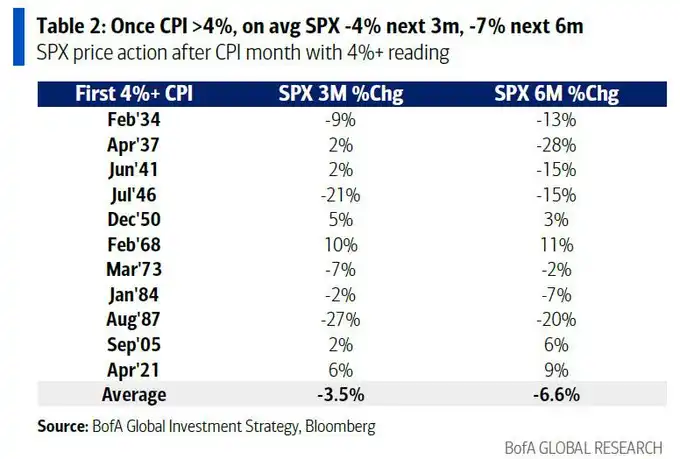
Стратег Bank of America Хартнетт предупреждает: если данные по инфляции в ближайшее время окажутся выше ожиданий, это напрямую спровоцирует распродажу рисковых активов. Исторические данные показывают, что за последние 100 лет, как только CPI превышал 4%, индекс S&P 500 в среднем падал на 4% в течение следующих 3 месяцев и на 7% в течение 6 месяцев.
Кроме того, рыночные «сигналы на продажу» продолжают усиливаться, гигантские IPO, такие как SpaceX, выведут рекордную ликвидность, а риск перехода глобальных центробанков к жёсткой политике создаёт крайне уязвимый момент для технологического пузыря.
Американский фондовый рынок в июне сталкивается с серьёзным стресс-тестом. Стратег Bank of America Майкл Хартнетт предупреждает, что серия плотных макроэкономических событий и резкий отток рыночной ликвидности могут подтолкнуть глобальные доходности по облигациям к значительному росту, что приведёт к схлопыванию текущего пузыря технологических активов.
Согласно аналитической платформе, Хартнетт в своём последнем исследовательском отчёте заявил, что предстоящие данные по инфляции в США являются ключевым катализатором этого «Июньского шторма». Если последние данные по инфляции превысят ожидания, это напрямую запустит механизм распродажи рисковых активов. Исторические данные показывают, что когда инфляция пробивает ключевой уровень тревоги, это часто приводит к глубокой коррекции базовых американских фондовых индексов в последующие месяцы.
В то же время, решения и заявления глобальных центробанков определяют рыночную динамику. В частности, предстоящее заседание Комитета по операциям на открытом рынке (FOMC) Федеральной резервной системы под руководством нового председателя ФРС Уорша, где будет определена его политическая позиция (ястребиная или голубиная), решит судьбу американских акций и долгосрочных доходностей по облигациям. Любой сигнал о более жёсткой политике, чем ожидалось, нанесёт удар инвесторам.
На фоне чрезвычайно оптимистичных настроений на рынке, внутренние индикаторы настроений Bank of America подают сильный «сигнал на продажу». В сочетании с беспрецедентным оттоком ликвидности, который произойдёт в связи с предстоящими IPO гигантских технологических компаний, текущие рисковые активы находятся в крайне уязвимой позиции.
Приближаются ключевые данные по инфляции: акции США перед риском исторического отката
Данные по индексу потребительских цен (CPI) в США, которые будут опубликованы 10 июня, являются первоочередным испытанием для рынка.
За последние три месяца этот показатель в среднем рос на 0,6% в месяц, за последние шесть месяцев — на 0,4% в месяц. Если темпы роста CPI в мае превысят 0,4% (текущие рыночные ожидания — 0,5%), это будет означать, что годовой рост CPI в США превысит 4% и может устремиться к 5% перед промежуточными выборами в США. Эта тенденция вызовет крайнюю тревогу у инвесторов в рисковые активы.
Исторические данные показывают, что за последние 100 лет, как только CPI превышал 4%, индекс S&P 500 в среднем падал на 4% в течение следующих 3 месяцев и на 7% в течение 6 месяцев.
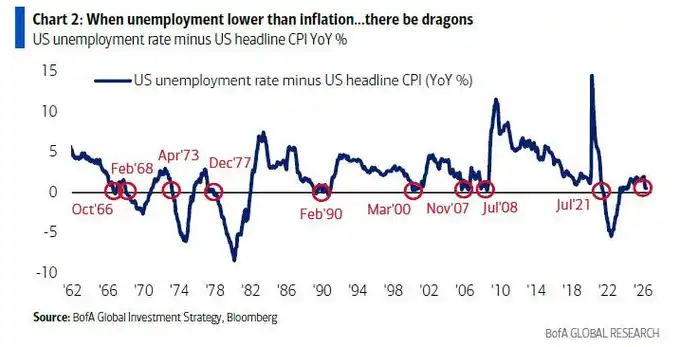
Другой индикатор инфляции, который нельзя игнорировать, — это пересечение уровня безработицы и CPI.
В мае существует «крайне маловероятная, но имеющая огромные последствия возможность» того, что уровень безработицы в США (консенсус-прогноз 4,3%) опустится до уровня инфляции (консенсус-прогноз 4,2%) или ниже. Это станет седьмым случаем с 1960 года. В годы, когда инфляция была близка к уровню безработицы или превышала его (например, в 1966, 1973, 2008 и 2021 годах), ФРС обычно принимала решение о повышении процентных ставок, и Уолл-стрит хранит болезненные воспоминания об этих периодах.
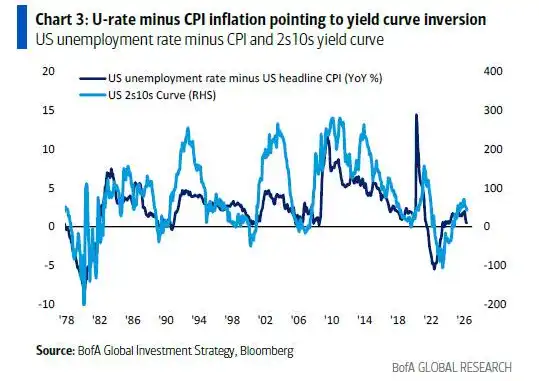
Кроме того, разница между уровнем безработицы и CPI тесно коррелирует с кривой доходности США и в настоящее время указывает на её возможное скорое инвертирование, что является ещё одним негативным сигналом для рисковых активов.
Решения глобальных центробанков: доходности по облигациям могут положить конец процветанию
«Процветание и пузыри в конечном итоге заканчиваются облигациями». Майкл Хартнетт повторил эту логику в своём отчёте.
Он предупреждает, что серия событий в июне может привести к тому, что доходность 30-летних государственных облигаций Великобритании превысит 6%, США — 5%, Японии — 4%. Поскольку рынок в настоящее время насыщен длинными позициями и оптимистичными ожиданиями прибыли, резкий рост доходности однозначно негативен для рисковых активов.
Глобальные центральные банки явно отстают от инфляционной кривой. Из 68 глобальных центробанков у 46 текущий уровень инфляции превышает их целевой показатель или абсолютное среднее значение целевого диапазона. На этом фоне вероятность повышения ставки Европейским центральным банком (ECB) на 25 базисных пунктов составляет 98%, а вероятность аналогичного повышения Банком Японии (BoJ) достигает 83%. Последнему срочно необходимо это сделать, чтобы остановить падение иены ниже «линии Мажино» в 160 иен за доллар.
Заседание FOMC 17 июня под руководством Уорша считается одним из двух важнейших событий этого месяца.
Рынок столкнулся с политической дилеммой: если Уорш будет слишком голубиным, долгосрочные доходности пойдут к 6%; если слишком ястребиным, индекс S&P 500 рискует скорректироваться в область 7000 пунктов; а «золотоволосый» (умеренный) настрой может подтолкнуть сводный индекс Нью-Йоркской фондовой биржи (NYA) к новому историческому максимуму выше 24000 пунктов.
Как Уорш заявлял в 2024 году, глобальные центробанки, кажется, самоуспокоились относительно инфляции, близкой к 3%, цель в 2% больше не воспринимается всерьёз, и такой компромисс чрезвычайно опасен.
Эффект богатства подпитывает инфляцию, крайние настроения вызывают «сигнал на продажу»
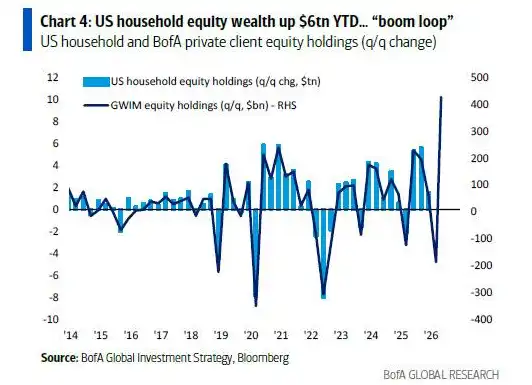
С макроэкономической точки зрения, США переживают K-образное восстановление, движимое «циклом процветания» благосостояния и фондового рынка.
Акционерное богатство американских семей с начала года увеличилось на 6 триллионов долларов, и эта «спираль благосостояния и цен» напрямую усиливает инфляционное давление. Несмотря на экономический рост, избиратели чувствуют себя по-разному: в настоящее время рейтинг поддержки Трампа по вопросу инфляции уже ниже минимального уровня Байдена.
Что касается потоков капитала, инвесторы в последнее время демонстрируют крайнюю склонность к погоне за технологическим пузырём. Данные за прошлую неделю показывают, что в наличные средства поступило рекордные 122 миллиарда долларов, в облигации — 390 миллиардов долларов (исторический рекорд), в акции — 231 миллиард долларов. В то же время из криптовалют было выведено 20 миллиардов долларов, из золота — 31 миллиард долларов, что указывает на то, что инвесторы продают другие активы, чтобы вложиться в технологический и полупроводниковый секторы.
Экстремальные потоки капитала привели к тому, что индикатор «Быки/Медведи» (Bull/Bear indicator) Bank of America вырос с 8,5 до 8,7, что делает «сигнал на продажу», сработавший две недели назад, ещё более сильным.
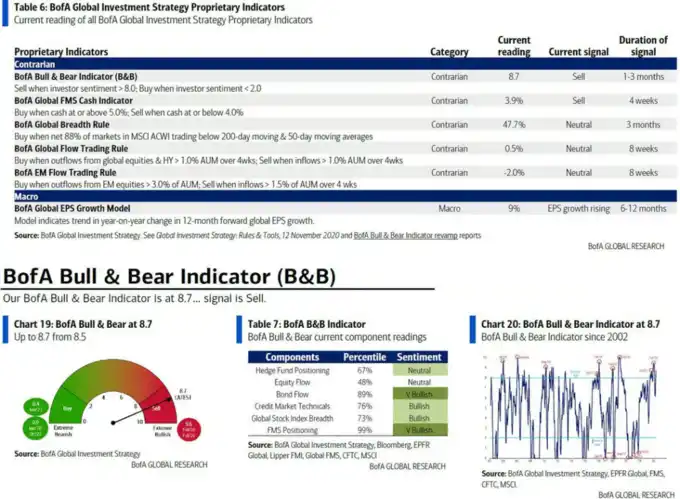
Исторические данные показывают, что из 17 «сигналов на продажу» с 2002 года глобальные акции в среднем теряли от 2% до 3% в последующие 2–3 месяца, а максимальная просадка могла достигать 15–20%. Кроме того, индикаторы глобальной ширины рынка показывают, что 48% глобальных акций находятся в состоянии перекупленности.
Гигантские IPO выводят ликвидность, неэкономические события усиливают рыночную нестабильность
Помимо макроэкономических данных, крупнейший неэкономический риск событий в июне исходит от огромного предложения на рынке капитала.
Первичное публичное размещение (IPO) SpaceX начнёт торговаться в следующую пятницу, и вместе с размещениями Anthropic, OpenAI и окончанием связанных с ними периодов блокировки это приведёт к выводу рекордной ликвидности с рынка. По своей силе как рыночного катализатора, такое ужесточение ликвидности может даже превзойти решения центральных банков.
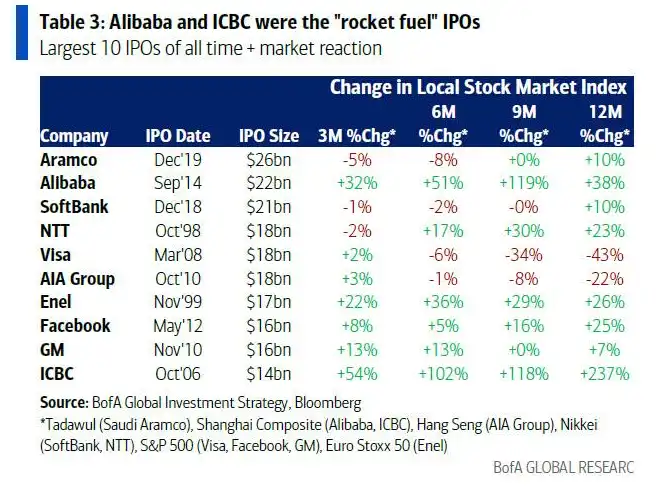
Историческое влияние гигантских IPO на рынок неоднозначно.
Хотя IPO Alibaba и Industrial and Commercial Bank of China стали катализаторами роста рынка, размещения Visa и AIA стали признаками «вершины» рынка: индексы S&P 500 и Hang Seng значительно снижались в течение 9–12 месяцев после этих IPO.
Хартнетт считает, что такой политический разворот является основной причиной того, что доходности и спреды по латиноамериканским облигациям находятся на исторически низком уровне (снизившись до минимума с ноября 2007 года в 217 базисных пунктов), и аналогичная тенденция политического поворота вправо также очевидна в Европе.
Для инвесторов это означает, что предпочтения в глобальной экономической политике в последнее время претерпевают глубокую и существенную переоценку.


