Odaily приглашенный аналитик рынка Коди, магистр финансовой статистики Колумбийского университета (США), со времен университета специализируется на количественной торговле акциями США и постепенно расширяет свою деятельность на цифровые активы, такие как Биткоин. В процессе практики он разработал систематизированную модель количественной торговли и систему управления рисками; обладает острым пониманием данных рыночной волатильности и стремится к постоянному углублению знаний в области профессиональной торговли, добиваясь стабильной доходности. Еженедельно будет глубоко анализировать технические, макроэкономические и денежные аспекты BTC, проводить разборы и демонстрировать практические стратегии, а также анонсировать важные события, на которые стоит обратить внимание в ближайшее время, для вашего сведения.

Ключевые выводы торгового недельного отчета:
В предыдущей статье мы сравнили структуру движения BTC в 2021 и 2025 годах и пришли к выводу, что история может повториться (BTC продолжит корректироваться), что вызвало много откликов, и некоторые аналитики придерживаются иной точки зрения. Ниже, на основе обновлений за эту неделю, мы подробно проанализируем характеристики текущей рыночной динамики и ключевые моменты для внимания в будущем. Приглашаем всех к обсуждению.
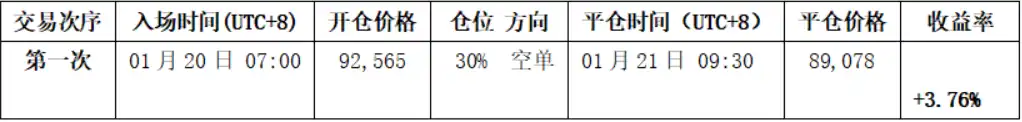
• Проверка эффективности выполнения стратегии (краткосрочной): На прошлой неделе торговля строго следовала установленной стратегии, была совершена одна краткосрочная операция (с плечом 1x), успешно получен доход 3.76%. (Подробности см. на Рисунке 1)
• Проверка ключевой точки зрения (краткосрочной): В начале прошлой недели цена быстро упала ниже ключевого диапазона $94,500~$95,000, вернувшись в первоначальный диапазон консолидации $84,000~$94,500 и продолжив движение к его нижней границе. Особо отметим, что минимальная точка цены на прошлой неделе точно совпала с указанным нами уровнем поддержки в $86,000. В целом, динамика行情 на прошлой неделе и поведение ключевых уровней поддержки были точно подтверждены рынком.
Далее подробно回顾预判行情、执行策略和具体交易过程。
一、Уроки истории: диалектический взгляд на текущий рынок (см. Рис. 3)
Сравнивая недельные коррекции после двух исторических пиков BTC, мы наблюдаем поразительное сходство структурных закономерностей между коррекцией, начавшейся в октябре 2025 года, и коррекцией ноября 2021 года. В настоящее время рынок находится на ключевом моменте технического выбора.
1、Ключевая техническая позиция: удержание или потеря нижней линии восходящего канала
Отскок от минимума $80,600 21 ноября 2025 года сформировал четкий восходящий канал. Нижняя линия этого канала стала «линией жизни», определяющей краткосрочную динамику.
2、Два возможных пути дальнейшего движения Биткоина:
• Если удастся закрепиться выше нижней линии канала, есть шанс на продолжение行情 отскока волны B. Следующим шагом будет тестирование сопротивления в районе $94,500, а затем挑战 ключевого уровня сопротивления – 21-недельной скользящей средней. Реализация этого сценария требует поддержки со стороны макроэкономики, особенно ожиданий смягчения политики ФРС.
• Если произойдет эффективное падение ниже нижней линии канала И линия импульса модели (дневной график) упадет ниже нулевой оси, это объявит о возврате дневного таймфрейма на медвежий рынок. Это будет означать, что отскок волны B, начавшийся 21 ноября 2025 года, возможно, завершился, и коррекция волны C продолжится, что значительно увеличивает вероятность падения цены ниже $80,600.
3、Анализ трехволновой структуры коррекции: при условии эффективного пробития цены ниже нижней линии канала
Коррекция, начавшаяся в октябре 2025 года, демонстрирует типичную трехволновую структуру:
• Коррекция волны A: с $126,200 (06.10.2025) до $80,600 (21.11.2025), продолжительность 46 дней, падение на 36%.
• Отскок волны B: с $80,600 (21.11.2025) до $97,924 (14.01.2026), продолжительность 54 дня, рост на 21.5%, этап технического восстановления.
• Коррекция волны C: с $97,924 (14 января) по настоящее время. В настоящее время мы находимся в фазе运行 этой волны, удержание или потеря нижней линии канала станет ключевым依据 для определения силы коррекции фазы C.
4、Прогноз цели коррекции волны C:
• $80,600, здесь находится точка старта волны B. Если этот уровень будет эффективно пробит, то трехволновая структура коррекции A-B-C, начавшаяся с $126,200, будет接近 завершению.
• $75,200, этот уровень является как 50% уровнем коррекции Фибоначчи от падения волны A, так и совпадает с минимумом коррекции апреля 2025 года, forming важную историческую область поддержки.
«История повторяется, но не буквально» – это глубочайшая диалектика финансовых рынков. Она требует от инвесторов как уважения к историческим закономерностям, так и умения discern особенности текущего рынка. Поэтому все рациональные рыночные прогнозы являются вероятностными перспективами, полученными в результате комплексного анализа фундаментальных факторов и технической структуры, а не deterministic预言. Их конечная цель – не точное предсказание будущего, а разработка более устойчивых стратегий应对.
二、Обзор行情 Биткоина за прошлую неделю: (19.01~25.01)
1、Обзор краткосрочных операций за прошлую неделю: как показано на (Рисунке 1)
1、Сводка деталей сделок: (без плеча)
Мы строго следовали торговым сигналам, генерируемым нашей собственной моделью торговли спредами и количественной моделью импульса,并结合预判 рыночной динамики, совершили одну краткосрочную операцию, в этой交易盈利 3.76%.
Конкретные детали сделок и复盘如下:
График Биткоина с 30-минутными свечами: (Количественная модель импульса + Модель торговли спредами)
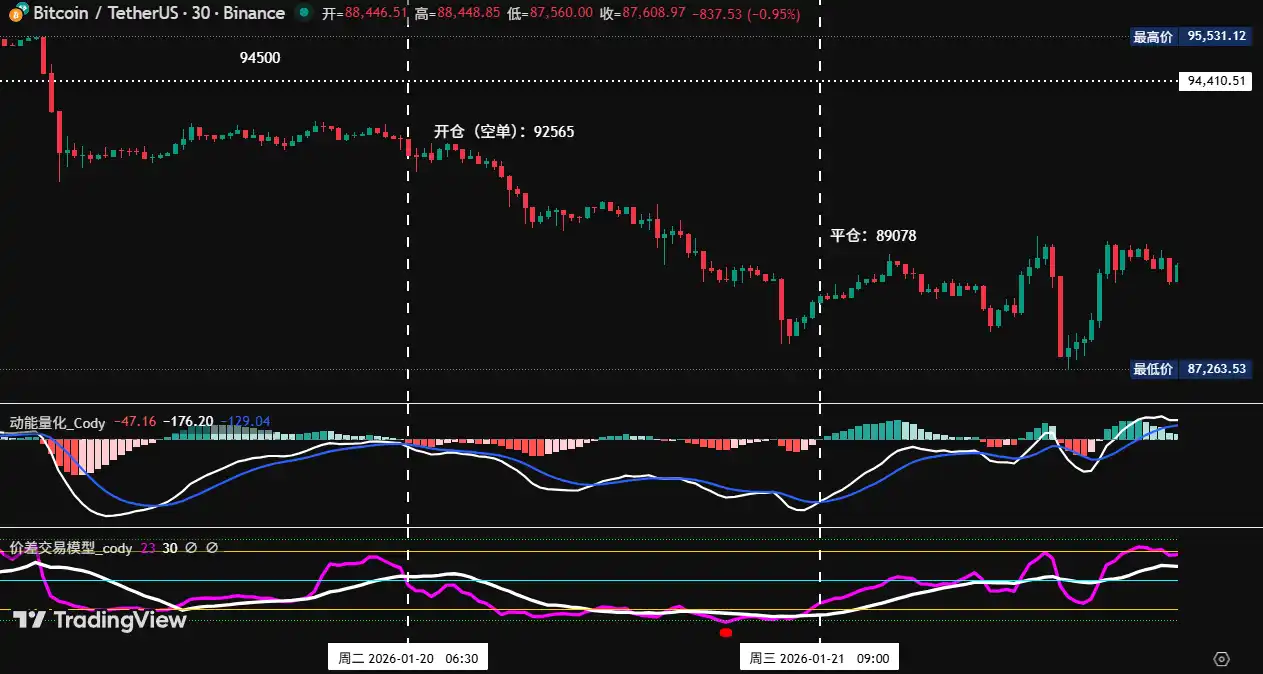
Рисунок 1
2、Разбор краткосрочной торговли:
• Первая сделка (прибыль 3.76%): Эта операция выполняла Сценарий B (открытие short при эффективном пробитии ключевой зоны): Когда цена упала ниже зоны $94,500~$95,000 и отскок не удался, одновременно модель торговли спредами и модель импульса共振 сгенерировали сигнал вершины, плюс две линии импульса ниже нулевой оси (рядом) сформировали медвежье пересечение, создав тройной медвежий сигнал. На этом основании мы открыли 30% short позицию по $92,565, после чего рынок如期 скорректировался. Когда цена достигла важного уровня поддержки, модель спреда первой выдала сигнал предупреждения о достижении дна (красная точка), затем количественная модель импульса и модель торговли спредами снова共振 сгенерировали сигнал дна. На этом основании мы закрыли всю позицию по $89,078, достигнув预期盈利 цели.
2、Обзор预判 динамики и торговых стратегий на прошлой неделе:
1、На прошлой неделе четко указывалось: ключевое внимание к удержанию/потере зоны $94,500~$95,000. При эффективном пробитии будет maintained консолидация в диапазоне $84,000~$94,500.
2、Обзор ключевых уровней: сопротивление в зоне $94,500~$95,000; первая поддержка в зоне $89,500~$91,000, вторая поддержка $86,000~$86,500.
2、Обзор торговой стратегии:
• Среднесрочная стратегия: вне рынка.
• Краткосрочная стратегия: Поскольку цена эффективно пробила зону $94,500~$95,000, операции выполнялись согласно Сценарию B (см. ниже):
• Открытие позиции: При подтверждении эффективности пробития при отскоке к этой зоне, можно открыть 30% short позицию.
• Управление рисками: Начальный стоп-лосс для short установить примерно на 1.5% выше цены входа (т.е. 1.015*цена входа).
• Закрытие позиции: При снижении до окрестностей $86,500 и в сочетании с сигналами модели, можно постепенно закрывать позицию с прибылью.
三、Структура движения Биткоина: дневной таймфрейм сохраняет медвежий настрой
结合 рыночной динамики, на основе собственной построенной торговой системы, с multiple моделей и multiple измерений, проводится深度 анализ структуры движения Биткоина.
График Биткоина с недельными свечами: (Количественная модель импульса + Количественная модель настроений)
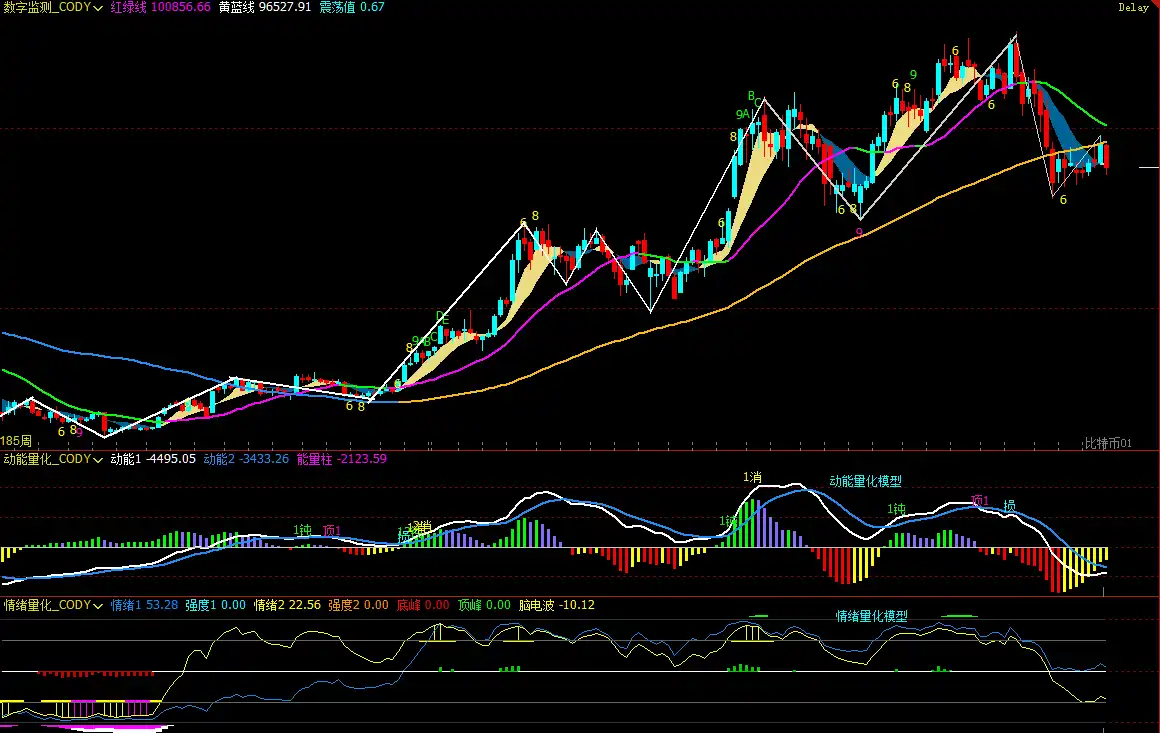
Рисунок 2
1、Как показано на (Рисунке 2), анализ недельного графика:
• Количественная модель импульса: Технические индикаторы показывают, что на прошлой неделе медвежий импульс несколько высвободился, две линии импульса демонстрируют признаки расхождения, отрицательные столбцы импульса изменились незначительно, внимание к последующим действиям медведей.
Количественная модель импульса预示: Индекс падения цены: Высокий
• Количественная модель настроений: Синяя линия настроений 53.28, интенсивность ноль; желтая линия настроений 22.56, интенсивность ноль, пиковое значение 0.
Количественная модель настроений预示: Индекс давления и поддержки цены: Нейтральный
• Цифровая мониторинговая модель: Цена пробила линию быков/медведей (желто-синяя) 10 недель назад, цена снова снизилась, удаляясь от линии раздела.
Цифровая мониторинговая модель预示: Сигналы мониторинга (вершины/дна) не появились; недельная свеча закрылась большой медвежьей свечой, падение около 7.55%; последние три недельные свечи сформировали медвежью формацию «сильная вершинная дивергенция».
Вышеуказанные данные预示: Недельный тренд Биткоина медвежий, остерегайтесь риска колебательного падения.
График Биткоина с дневными свечами: (Количественная модель импульса + Количественная модель настроений)
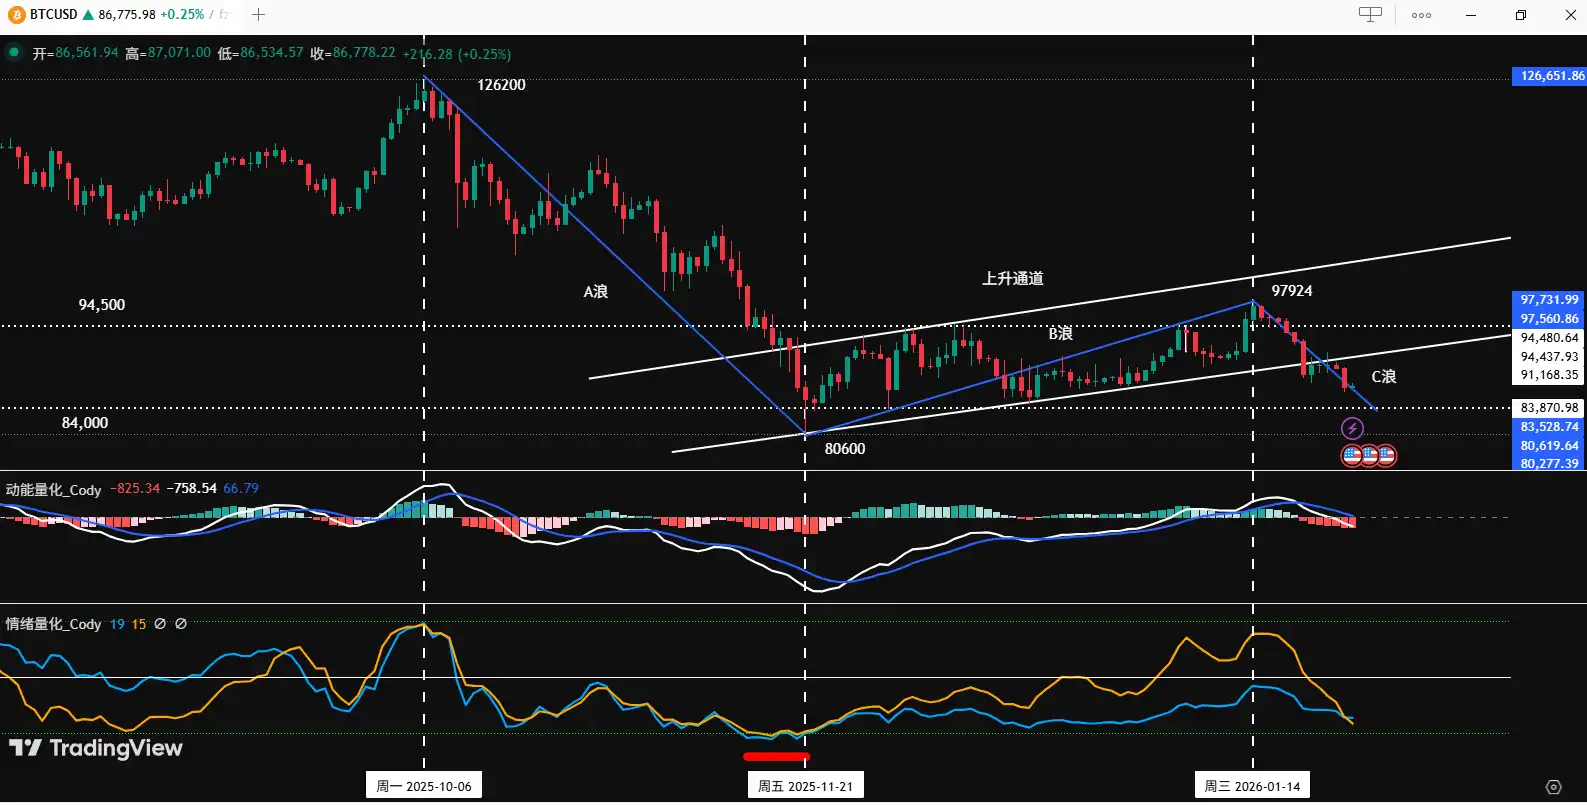
Рисунок 3
2、Как показано на (Рисунке 3), анализ дневного графика:
• Количественная модель импульса: На прошлой неделе в целом наблюдалась картина «падение-консолидация-падение». По итогам закрытия дня в воскресенье, линия импульса 1 уже опустилась ниже нулевой оси, линия 2 вот-вот опустится ниже; отрицательные столбцы импульса постепенно увеличиваются.
Количественная модель импульса预示: Дневной медвежий импульс высвобождается, внимание к удержанию/потере нулевой оси.
• Количественная модель настроений: По итогам закрытия дня в воскресенье, синяя линия настроений 19, интенсивность ноль; желтая линия настроений 20, интенсивность ноль.
Количественная модель настроений预示: Индекс давления и поддержки: Нейтральный
Вышеуказанные данные提示: На дневном таймфрейме初步 проявляется медвежий настрой, эффективность еще待 подтверждения, внимание к борьбе быков и медведей за нулевую ось.
四、Прогноз行情 на текущую неделю: (26.01~01.02)
1、Ключевая точка зрения на неделю: внимание к подтверждению эффективности пробития нижней линии восходящего канала.
• Если цена эффективно пробивает нижнюю линию, то коррекция ускорится, цель – сначала нижняя граница первоначального коридора консолидации около $84,000.
• Если цена эффективно закрепляется, то maintained консолидация within восходящего канала, но высота有限.
2、Ключевые уровни сопротивления:
• Первая зона сопротивления: $88,500~$91,200 (предыдущий центр консолидации)
• Вторая зона сопротивления: $94,500~$95,000 (предыдущий центр консолидации)
• Важная зона сопротивления: окрестности 21-недельной скользящей средней
3、Ключевые уровни поддержки:
• Первый уровень поддержки: зона $86,000~$86,500 (предыдущая зона плотных成交ов)
• Второй уровень поддержки: окрестности $84,000 (нижний край предыдущего коридора)
• Важный уровень поддержки: окрестности $80,000~$80,600 (около минимумов ноября прошлого года)
五、Торговая стратегия на текущую неделю (исключая влияние внезапных новостей): (26.01~01.02)
1、Среднесрочная стратегия: При эффективном пробитии нижней линии восходящего канала, можно выбрать момент для открытия 60% short позиции.
2、Краткосрочная стратегия: Использовать 30% капитала, установить стоп-лосс, на основе уровней поддержки и сопротивления искать возможности для «спреда» (использовать 30-минутный таймфрейм для операций).
3、В операциях ключевое внимание к удержанию/потере нижней линии восходящего канала. Для динамического应对 рыночных изменений и в сочетании с实时 сигналами модели, мы拟定 A/B два варианта краткосрочных операций:
• Сценарий A: Если цена падает ниже нижней линии восходящего канала:
• Открытие позиции: При эффективном пробитии и в сочетании с сигналом вершины модели, можно открыть 30% short позицию.
• Управление рисками: Начальный стоп-лосс для short установить примерно на 1.5% выше цены входа (т.е. 1.015*цена входа).
• Закрытие позиции: При снижении до важного уровня поддержки nearby и в сочетании с сигналами модели, можно постепенно закрывать позицию с прибылью.
• Сценарий B: Если цена重新 закрепляется above нижней линии восходящего канала: (sell на сопротивлении)
• Открытие позиции: При отскоке к важному уровню сопротивления или верхней линии канала и появлении сигнала сопротивления, в сочетании с сигналом вершины модели, можно открыть 30% short позицию.
• Управление рисками: Начальный стоп-лосс для short установить примерно на 1.5% выше цены входа (т.е. 1.015*цена входа).
• Закрытие позиции: При снижении до нижней линии канала или уровня поддержки и в сочетании с сигналами модели, можно постепенно закрывать позицию с прибылью.
六、Особое примечание:
1、При открытии позиции: Немедленно установить начальный стоп-лосс.
2、При достижении прибыли 1%: Переместить стоп-лосс на цену входа (точка безубыточности), обеспечив безопасность本金.
3、При достижении прибыли 2%: Переместить стоп-лосс на уровень прибыли 1%.
4、Постоянное отслеживание: В дальнейшем при каждой дополнительной прибыли в 1% стоп-лосс同步 перемещать на 1%, динамически защищая и фиксируя прибыль.