На этой неделе рынок ищет направление в условиях волатильности, где возможности сосуществуют с рисками. Дневная волновая структура V HYPE сталкивается с ключевым узлом проверки, где успех или провал поддержки на уровне 40,17 долларов определит последующую динамику; BTC, тем временем, колеблется между продолжением отскока волны D и сопротивлением в зоне давления, при этом ядром внимания остается игра быков и медведей в диапазоне 73 500 ~ 79 000 долларов.
Следование тренду и строгая дисциплина — вот что позволяет уверенно двигаться вперед в сложных рыночных условиях.
Ключевые тезисы для торговли на неделю:
• Анализ текущей структуры движения HYPE. (Подробности в части 1)
• Прогноз по HYPE на неделю и стратегия для краткосрочных операций. (Подробности в части 2)
• Анализ волновой структуры BTC на нескольких таймфреймах. (Подробности в части 3)
• Прогноз по BTC на неделю и стратегия для среднесрочных и краткосрочных операций. (Подробности в части 4)
Проверка рынком торговых стратегий и ключевых тезисов за прошлую неделю:
• Эффективность краткосрочной торговли HYPE: На прошлой неделе была завершена одна краткосрочная сделка на покупку HYPE (плечо 1х), совокупный доход составил около 6,80%. (Подробности в Таблице 1)
• Проверка рыночного прогноза по движению HYPE: В предыдущих материалах мы указывали, что отскок HYPE от минимума 34,44 доллара 2 апреля по волновой структуре является потенциальным дневным восходящим движением волны V. Текущее движение рынка подтвердило нашу точку зрения. На прошлой неделе рынок достиг максимума в 45,75 доллара, не только успешно пробив максимум волны III от 18 марта в 43,78 доллара, но и установив новый максимум текущего восходящего тренда.
• Проверка эффективности среднесрочной торговли BTC: На прошлой неделе Bitcoin следовал установленной средней стратегии, продолжая удерживать короткую позицию, открытую на уровне 89 000 долларов (плечо 1х), прибыль на момент закрытия недели (около 73 800 долларов) составила около 17,08%, максимальная прибыль в течение недели достигла примерно 32,58%.
• Проверка рыночного прогноза по движению BTC: На прошлой неделе мы указывали, что рынок сохранит широкий диапазон волатильности. Текущее движение рынка подтвердило наш прогноз.
一、HYPE: Анализ структуры движения
График HYPE_4 часа
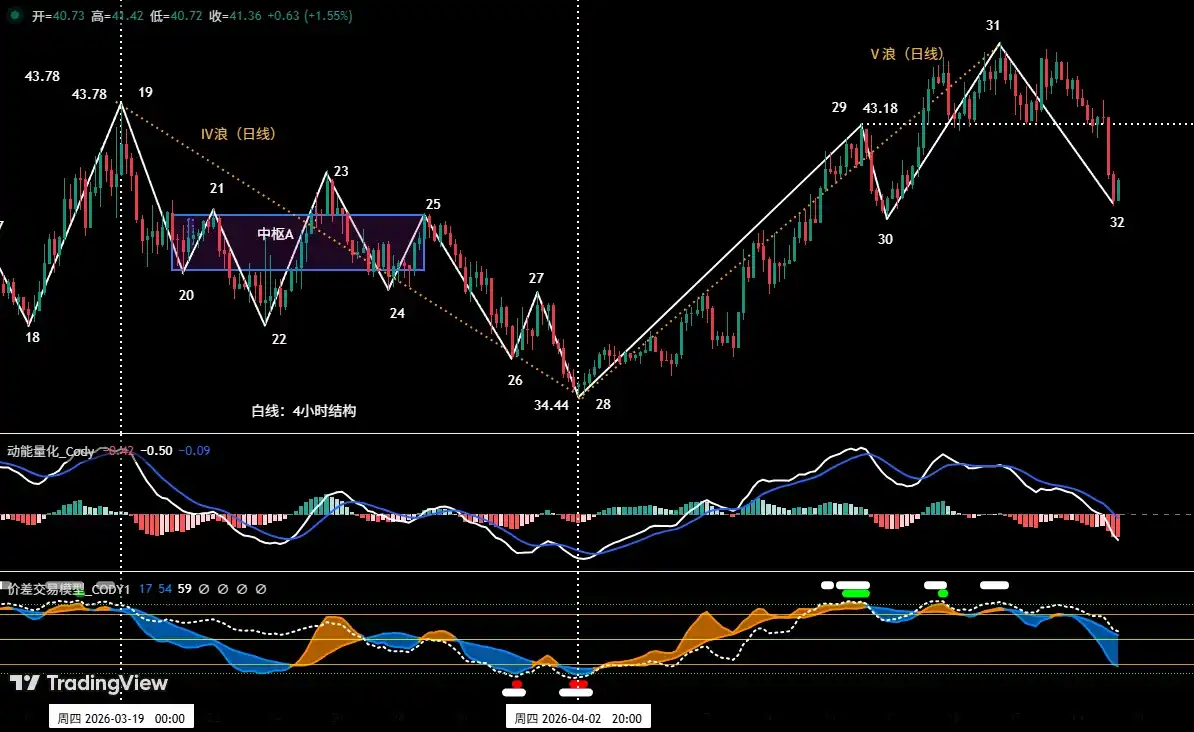
Рисунок 1
1. Как показано на (Рисунке 1), HYPE достиг нового максимума в 45,76 доллара 16 апреля, установив новый максимум отскока с минимума 20,46 доллара 21 января и пробив предыдущий максимум 43,78 доллара (максимум волны III) от 18 марта. Таким образом, восходящее движение, начавшееся от минимума 34,44 доллара 2 апреля, можно временно рассматривать как восходящую структуру дневной волны V, которая находится в процессе развития.
2. Как показано на (Рисунке 1), указанную дневную волну V на 4-часовом таймфрейме можно детализировать как: восходящую структуру, состоящую из 4 сегментов: 28-29, 29-30, 30-31, 31-32.
3. В настоящее время行情 работает корректирующий сегмент 31-32.
• В 4-часовой структуре HYPE наша собственная модель количественной оценки импульса зафиксировала, что две сигнальные линии импульса同步но опустились ниже нулевой оси, что предвещает возможность продления времени данной коррекции.
• В настоящее время потенциальная конечная точка коррекции (т.е. точка 32) приблизилась к предыдущему уровню поддержки 40,17 доллара (т.е. точка 30).
二、Прогноз по HYPE на неделю и стратегия для краткосрочных операций
1、Прогноз движения HYPE на неделю:
Как показано на (Рисунке 1), следите, пробивает ли точка 32 точку 30 (т.е. 40,17 доллара):
• Если удержится выше, то сохранится боковое движение в диапазоне 40,17-45,76 доллара;
• Если этот уровень поддержки будет пробит, и последующий отскок не сможет превысить 45,76 доллара (т.е. точка 31), то сформируется классическая техническая формация «коррекция пробивает предыдущий минимум, но последующий отскок не обновляет максимум». Это будет означать, что восходящая структура дневной волны V, запущенная от минимума 2 апреля, с большой вероятностью завершилась на уровне 45,76 доллара.
2、Стратегия краткосрочных операций с HYPE на неделю:
• Основываясь на прогнозе общего восходящего тренда, следует придерживаться стратегии «Следовать тренду, покупать на снижении».
• Руководствуясь сигналами самостоятельно построенной количественной модели, использовать таймфреймы 30 минут/60 минут в качестве операционного цикла, использовать 30% капитала для поиска возможностей входа в длинную позицию.
• Стратегия открытия позиции: В начале недели HYPE сталкивается с потребностью в коррекции. Если цена при откате к ключевой поддержке около 40,17 доллара покажет сигнал подтверждения удержания выше поддержки, одновременно с сигналами покупки на дне, triggered двумя моделями, можно рассмотреть вход в длинную позицию, строго соблюдая дисциплину стоп-лосса.
三、Анализ волновой структуры Bitcoin на нескольких таймфреймах
1、 Разметка волн на дневном таймфрейме BTC:(На основе行情 после максимума 6 октября 2025 года)
Биткоин _ Дневной график:
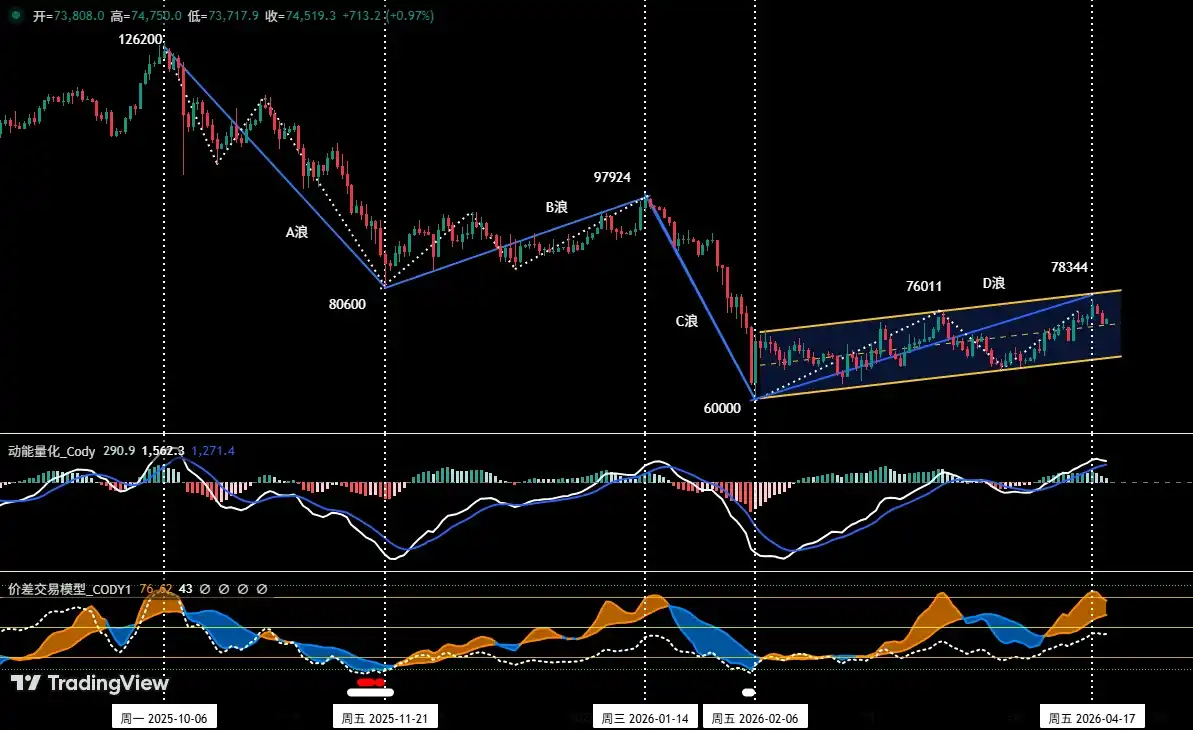
Рисунок 2
Как показано на (Рисунке 2), поскольку восходящее движение Bitcoin, начавшееся от минимума 60 000 долларов 6 февраля, не только установило новый максимум отскока на уровне 78 333 доллара 17 апреля, но и по состоянию на 19 апреля длилось около 73 торговых дней, его время и пространство значительно превысили ранее прогнозируемые рамки «отскока волны C-2 внутри корректирующей волны C» (например, продолжительность отскока уже значительно превысила 54-дневный отскок волны B). Следовательно, исходя из принципов анализа теории волн,原有框架可能需要调整. Мы больше склонны重新 определить это восходящее движение, начавшееся с 60 000 долларов, как более крупный «отскок волны D», что больше соответствует客观ному факту текущего рынка, где время обменивается на пространство, а цикл отскока延长.
Конкретная разметка волн средней коррекции может быть оптимизирована следующим образом:
• Коррекция волны A (импульсное падение): Началась с максимума 126 200 долларов 6 октября 2025 года, закончилась на минимуме 80 600 долларов 21 ноября 2025 года, длилась около 46 дней, максимальное падение около 36%. Эта волна установила格局 средней коррекции.
• Отскок волны B (сложная коррекция): Начался с минимума 80 600 долларов 21 ноября 2025 года, закончился на максимуме 97 924 доллара 14 января 2026 года, длился около 54 дней, максимальный рост около 21,5%. Это была коррекция к падению волны A.
• Коррекция волны C (основная волна падения): Началась с максимума 97 924 доллара 14 января 2026 года, достигла минимума 60 000 долларов 6 февраля 2026 года быстрым падением, длилась около 22 дня, максимальное падение около 38,7%. Эта волна завершила основную пространственную часть коррекции.
• Отскок волны D (текущий / возможна завершающая стадия): Начался с минимума 60 000 долларов 6 февраля 2026 года, по состоянию на 19 апреля длился около 73 дня, максимальный рост около 30,6% (с 60 000 до 78 333 долларов). Характеристики этого отскока: длительное время, сложная структура, и в настоящее время он сталкивается с испытанием ключевого временного окна и зоны ценового сопротивления (например, 79 000-80 600 долларов). Если волна D состоится, после завершения отскока цены монеты可能 последовать соответствующая ей коррекция «волны E».
2、BTC: Глубокий анализ структуры движения
Биткоин _4-часовой график
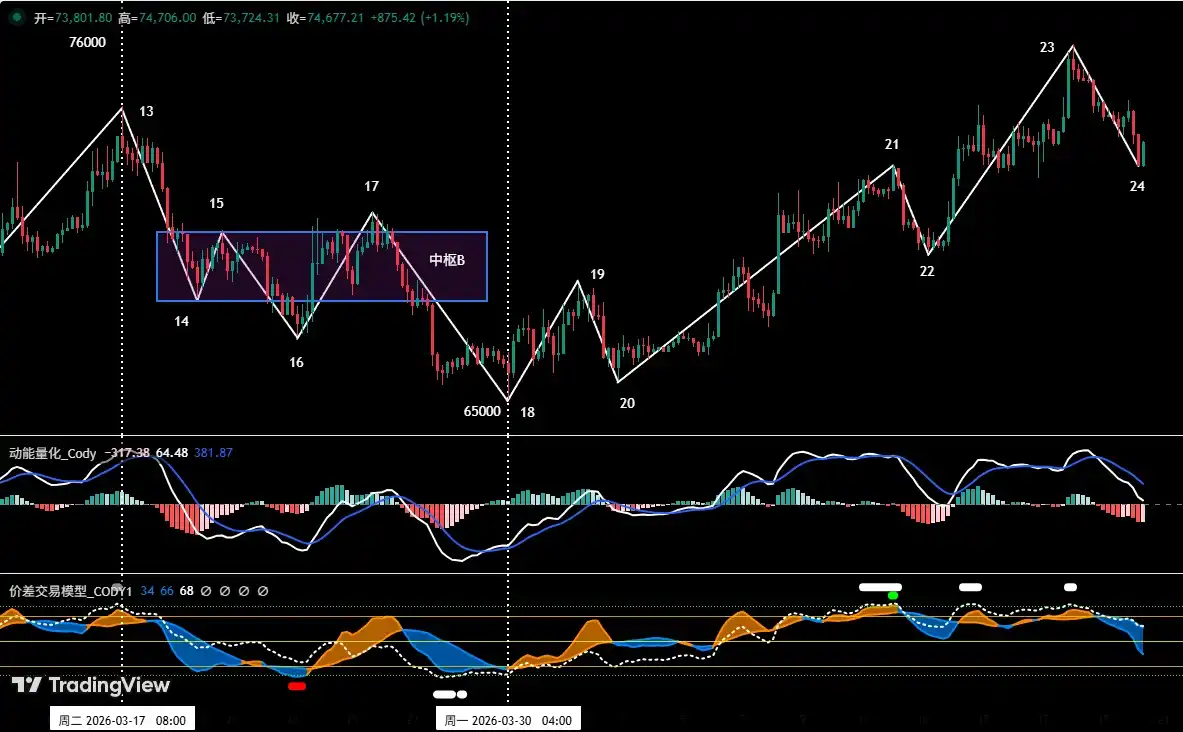
Рисунок 3
• На основе эволюции行情 после минимума 65 000 долларов 30 марта.
• Как показано на (Рисунке 3), BTC начал колебательное восходящее движение с минимума 30 марта. От точки 18 до точки 24 состоит из 6-сегментной структуры: 18-19, 19-20, 20-21, 21-22, 22-23, 23-24.
• На графике видно: от точки 18 до точки 23行情 уже отработала достаточно четкую 5-волновую структуру отскока, в настоящее время работает сегмент 23-24. С точки зрения нашей собственной модели торговли спредом, в последнее время постоянно подаются сигналы предупреждения о вершине (зеленые и белые точки на графике), это означает, что технические индикаторы находятся в состоянии серьезного перекупленности, рынок имеет краткосрочную потребность в коррекции волатильности.
四、Прогноз по Bitcoin на неделю и операционная стратегия
1、Прогноз движения BTC на неделю:
• Ключевая точка зрения на неделю:
В настоящее время сохраняется волатильность в диапазоне 73 500 ~ 79 000 долларов, следите за борьбой быков и медведей near границ этого диапазона. Если отскок пробивает верхнюю границу, рынок будет колебательно расти, но пространство ограничено; если эффективно пробита нижняя граница, цена монеты может further испытать ключевую поддержку near 69 500 долларов.
2、Ключевые уровни сопротивления:
• Первая зона сопротивления: область 79 000 ~ 80 600 долларов (near минимума ноября 2025 года)
• Вторая зона сопротивления: область 83 500 ~ 84 500 долларов (зона密集ных сделок между быками и медведями ранее)
3、Ключевые уровни поддержки:
• Первая поддержка: near 73 500 долларов (важный уровень поддержки ранее)
• Вторая поддержка: near 69 500 долларов (важный уровень поддержки ранее)
• Третья поддержка: область 65 000 ~ 66 000 долларов (near нижней границы диапазона волатильности)
4、Операционная стратегия на неделю (исключая влияние внезапных новостей):(20.04~26.04)
1、Среднесрочная стратегия:
Биткоин _ Дневной график:(Модель мониторинга позиций)
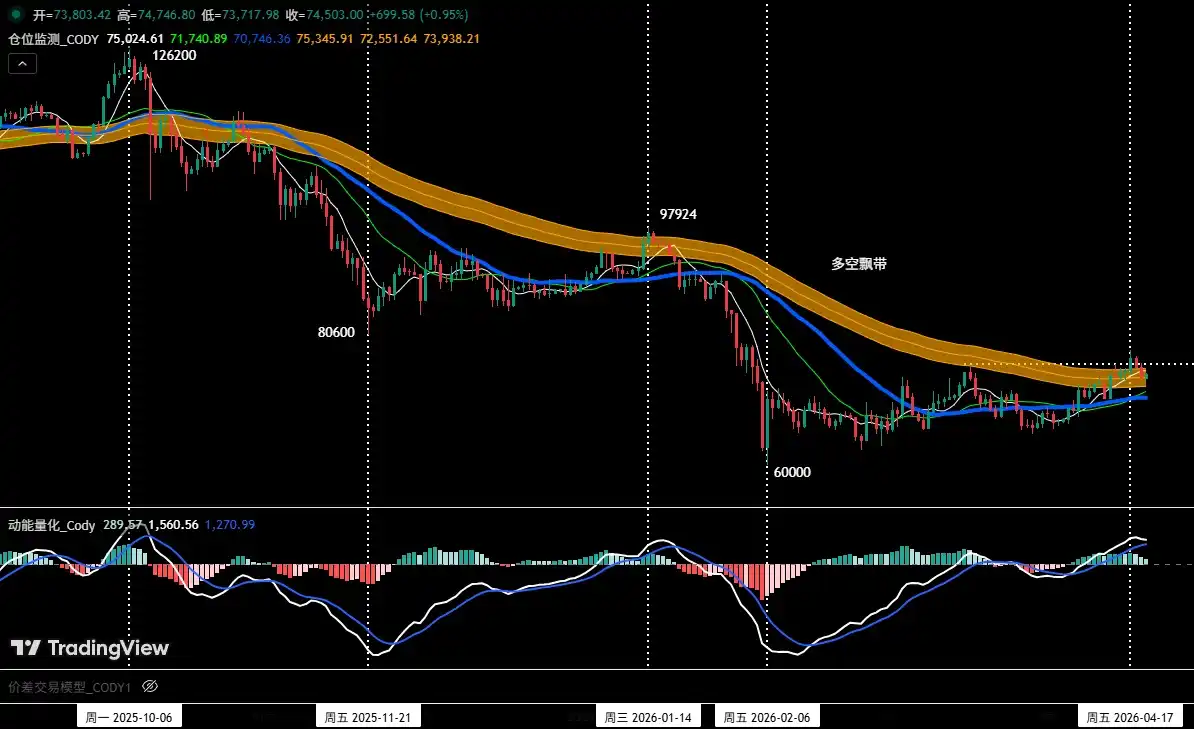
Рисунок 4
Модель мониторинга позиций: Как показано на (Рисунке 4), в настоящее время цена монеты колеблется near ленты быков и медведей. Мы, следуя правилам стратегии, временно удерживаем 60% короткую позицию, открытую на уровне 89 000 долларов (28 января).
• Если на этой неделе цена монеты при отскоке эффективно закрепится выше ленты быков и медведей, все среднесрочные позиции будут обнулены.
2、Краткосрочная стратегия: Использовать 30% капитала, установить стоп-лосс, искать возможности для сделок «спреда» на основе уровней поддержки и сопротивления. (Использовать 30-минутный/60-минутный таймфрейм в качестве операционного цикла).
3、Основываясь на прогнозе среднесрочного медвежьего тренда, в настоящее время следует придерживаться принципа операций «Следовать тренду, продавать на росте». Для динамичного应对 сложной эволюции рынка и combined с сигналами собственной торговой модели, мы拟定A/B два套 варианта краткосрочных операций:
• Вариант А:Отскок встречает сопротивление, продавать на росте.
• Открытие позиции: Когда цена монеты при отскоке достигает области 76 500 ~ 79 000 долларов, triggered сигнал сопротивления combined с сигналом вершины модели, можно建立 30% короткую позицию.
• Управление рисками: Начальный стоп-лосс устанавливается выше 80 600 долларов.
• Закрытие позиции: Когда цена монеты падает до важного уровня поддержки near combined с сигналом модели, можно постепенно закрывать позицию для фиксации прибыли.
• Вариант B: Короткая позиция по пробою по тренду.
• Открытие позиции: Цена монеты продолжает корректироваться, когда цена монеты эффективно пробивает поддержку near 73 500 долларов, combined с сигналом вершины модели, можно顺势建立 30% короткую позицию.
• Управление рисками: Начальный стоп-лосс устанавливается выше 74 500 долларов.
• Закрытие позиции: При падении до уровня поддержки combined с сигналом модели, можно постепенно закрывать позицию для фиксации прибыли.
五、HYPE: Разбор операций
1、Обзор краткосрочных операций:(см. Таблицу 1)
Мы строго следовали плану операций, руководствуясь交易信号ми самостоятельно построенной модели торговли спредом и модели количественной оценки импульса, на прошлой неделе завершили одну краткосрочную (длинную) сделку, совокупная торговая прибыль составила 6,80%.
2、Сводка деталей краткосрочных сделок HYPE:(Плечо*1х)
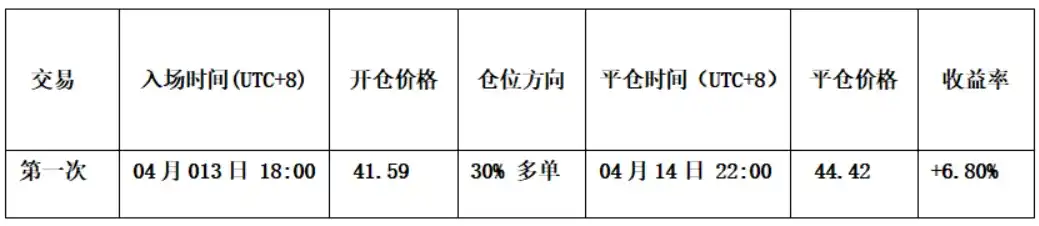
Таблица 1
3、Разбор краткосрочной сделки:(см. Рисунок 5)
• Стратегия открытия позиции: Во-первых, на основе суждения о восходящем тренде волны V рынка; во-вторых, модель торговли спредом уже заранее выдала сигнал предупреждения о дне (хорошие точки на графике); в-третьих, две линии импульса в модели импульса同步но работали выше нулевой оси, и две модели issued共振ный восходящий сигнал., мы建立 30% длинную позицию на уровне 41,59 доллара.
• Стратегия закрытия позиции: Когда цена выросла до about 45 долларов и встретила сопротивление, одновременно модель торговли спредом triggered сильный сигнал предупреждения о вершине (зеленая точка + белая точка), поэтому мы закрыли все позиции на уровне about 44,42 доллара.
• Итог: Прибыль от данной сделки составила about 6,80%.
График HYPE_60 минут:(Модель количественной оценки импульса + Модель торговли спредом)
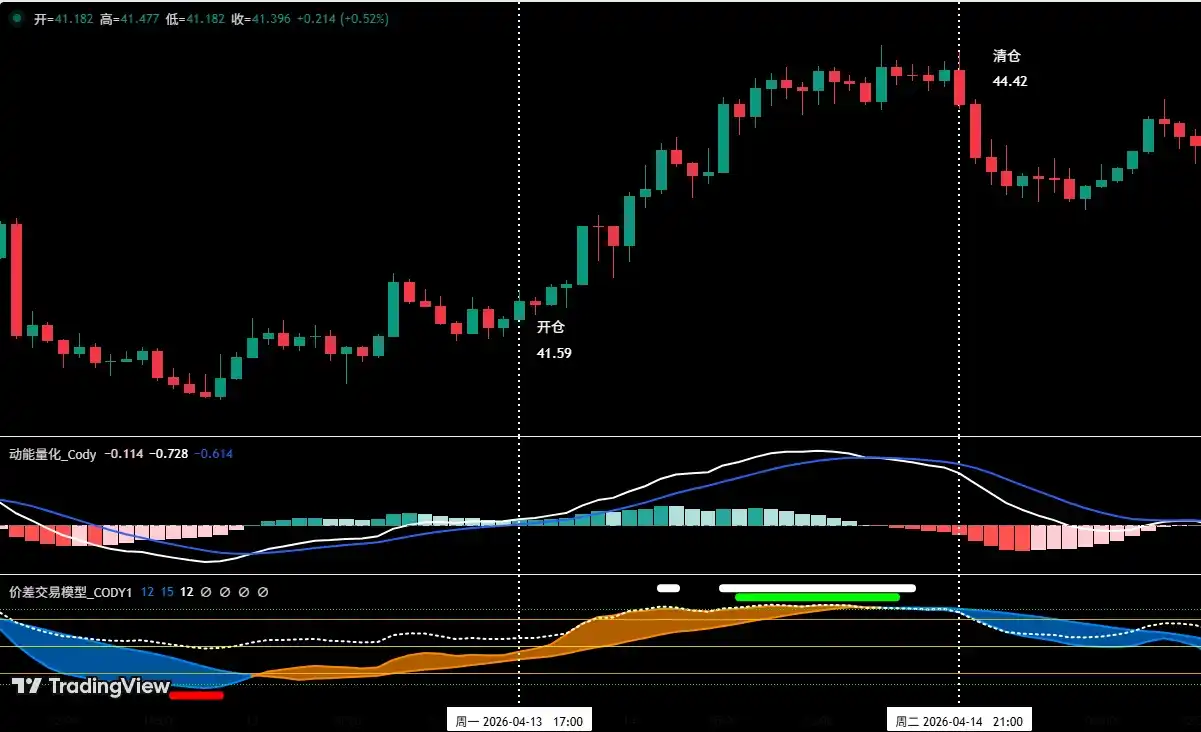
Рисунок 5 (Иллюстрация краткосрочной сделки)
六、Особое примечание:
1. При открытии позиции: Немедленно установите начальный стоп-лосс.
2. При достижении прибыли 1%: Переместите стоп-лосс на цену открытия позиции (точка безубыточности), обеспечивая безопасность本金.
3. При достижении прибыли 2%: Переместите стоп-лосс на позицию с прибылью 1%.
4. Постоянное отслеживание: После этого, с каждым дополнительным 1% прибыли, стоп-лосс перемещается同步но на 1%, динамически защищая и фиксируя прибыль.
Финансовые рынки瞬息万变, все анализ рынка и торговые стратегии требуют динамической корректировки. Все观点, аналитические модели и операционные стратегии,涉及енные в данной статье, основаны на личном техническом анализе и предназначены только для личного торгового журнала, не являются инвестиционной рекомендацией или основанием для действий. Рынок有风险, инвестиции требуют осторожности, пожалуйста, не принимайте решения на основе этого.


