Автор: Gino Matos
Компиляция: Deep Tide TechFlow
Глубинный анализ от Deep Tide: Биткоин, не сумев пробить уровень в 82 000$, откатился вниз два дня подряд, оказавшись в зоне поддержки 78 000$. Доходность 10-летних казначейских облигаций США приближается к 4,6%, 30-летних пробила отметку в 5,13%, а апрельский индекс потребительских цен ускорился до 3,8%. Цены на нефть превысили 105 долларов — макросреда крайне недружелюбна к рискованным активам. Потоки средств в ETF также в ключевой момент сменили направление на отток. Удержатся ли 78 000$? Если нет, следующая цель — 75 000$.
78 000 долларов: если этот рубеж не пройти, следующая остановка — 75 000
Биткоин в ходе торгов опускался до минимума 77 711$, после чего немного отскочил до уровня около 78 225$. Это второй торговый день подряд, когда он находится под макродавлением.
Доходность 10-летних казначейских облигаций США выросла до 4,599%, 30-летних — на 11,8 базисных пункта до 5,131%, достигнув максимума с мая 2025 года. BTC с 15 мая, когда он открывался выше 81 000$, упал на 3,9%, одновременно с этим ослабевали и фондовый рынок США, и рынок облигаций.
Когда BTC потерял уровень в 82 000$, следующим рубежом поддержки стала зона 77 700 — 78 000$. Сейчас на эту поддержку ложится вся тяжесть макродавления.
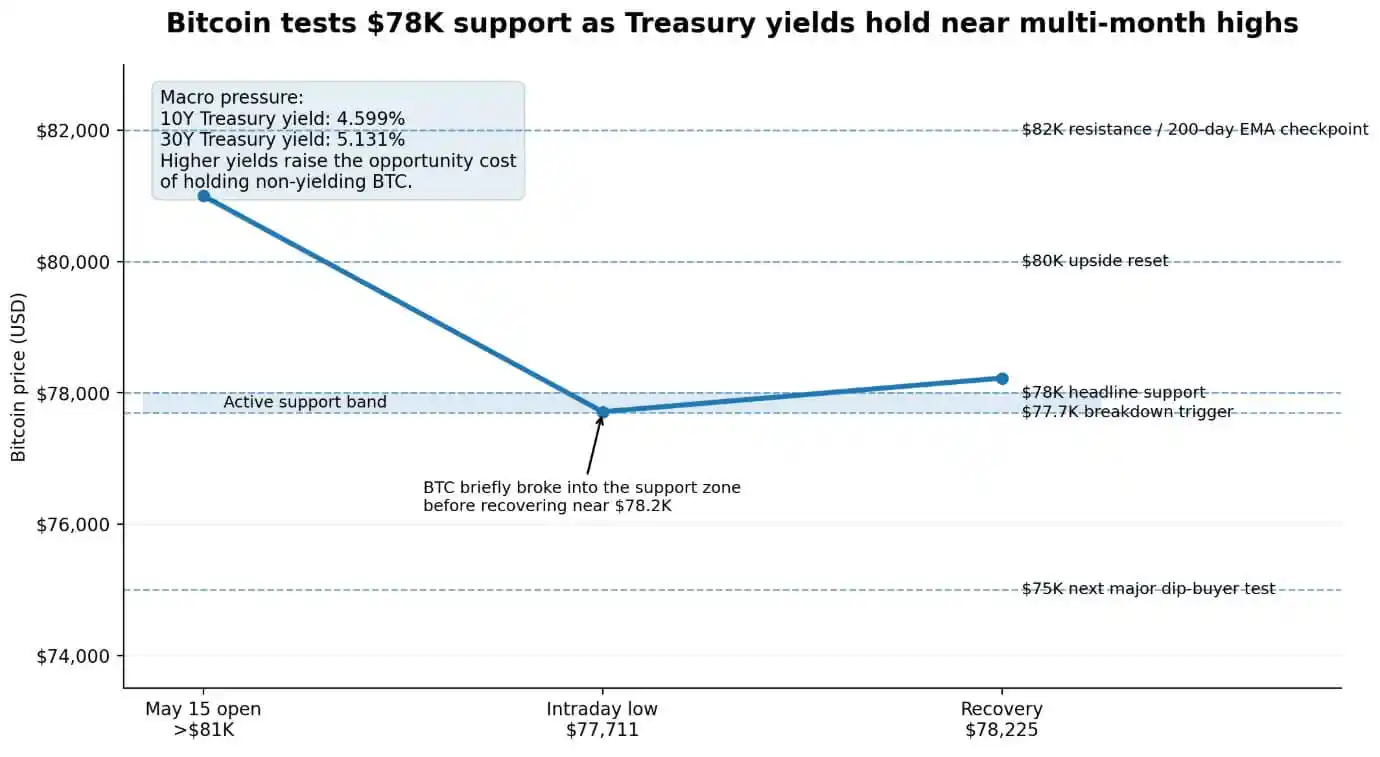
Подпись к графику: Биткоин упал с уровня открытия выше 81 000$ 15 мая до внутридневного минимума 77 711$, затем отскочил до 78 225$, тестируя зону поддержки 77 700 — 78 000$.
Вес макросреды
BTC — это актив с нулевой доходностью, и сейчас ему приходится конкурировать с американскими облигациями, приносящими 4,5–5,1%. Когда базовый уровень процентных ставок поднят до таких значений, альтернативные издержки владения BTC резко возрастают.
Данные K33 показывают, что 30-дневная корреляция биткоина с фьючерсами на Nasdaq превышает 0,7. Когда Nasdaq сильно падает, бета-коэффициент BTC также усиливается. В этом раунде продаж одновременно сработали два канала передачи, и макросреда почти не оставляет ФРС пространства для смягчения политики.
Апрельский индекс потребительских цен (ИПЦ) в годовом выражении ускорился до 3,8% (в марте было 3,3%). Базовый ИПЦ остался на уровне 2,8%, компонент «энергия» вырос на 17,9% за 12 месяцев.
Нефть марки WTI закрылась 15 мая на уровне 105,42$, поднявшись за день на 4,2%, за месяц рост составил 11,33%. Нефть марки Brent достигла 109,26$, прибавив 3,35%. Модель TradingEconomics прогнозирует, что Brent к концу квартала достигнет 111,28$. HSBC повысил прогноз средней цены Brent на 2026 год до 95$, отметив, что если соглашение по поставкам затянется до конца лета, средняя цена может составить 110$.
Данные Мичиганского университета за май показывают, что годовые инфляционные ожидания выросли до 4,5%. В заявлении ФРС по итогам апрельского заседания FOMC говорится о необходимости сначала оценить инфляцию, прежде чем рассматривать смягчение. Порог для послабления в политике высок.
Потоки в ETF подвели в ключевой момент
Данные CoinShares показывают, что на неделе, закончившейся 11 мая, инвестиционные продукты на биткоин привлекли чистый приток средств в размере 706,1 млн долларов — интерес институционалов по-прежнему силен.
Однако ежедневные данные Farside Investors показывают резкий разворот тренда после этого: 13 мая чистый отток составил 630,4 млн долларов, 14 мая наблюдался небольшой приток в 131,3 млн долларов, 15 мая вновь отток в размере 290,4 млн долларов.
Отток два дня за три. Подушка в виде притока средств в ETF исчезла в тот самый момент, когда защита уровня поддержки в 78 000$ требовалась больше всего. Именно эта подушка в предыдущие недели поглощала макросотрясения.
Карта поддержки
Внутридневной минимум 77 716,09$ уже находится внутри интервала поддержки. Если цена закроется на дневном графике выше 78 000$, технически эта коррекция все еще будет под контролем.
Как только уровень 77 700$ будет уверенно пробит, откроется путь вниз: 76 500$ станет первой промежуточной целью, и после подтверждения пробоя медведи запустят новую волну снижения к круглому уровню 75 000$, где исторически покупатели проявляют реальный интерес и вкладывают реальные деньги.
Если падение продолжится, в поле зрения попадет зона 73 000 — 74 000$. На этих уровнях рыночный нарратив сменится с «коррекции» на «макроэкономически обусловленное снижение рисков по всем классам активов».
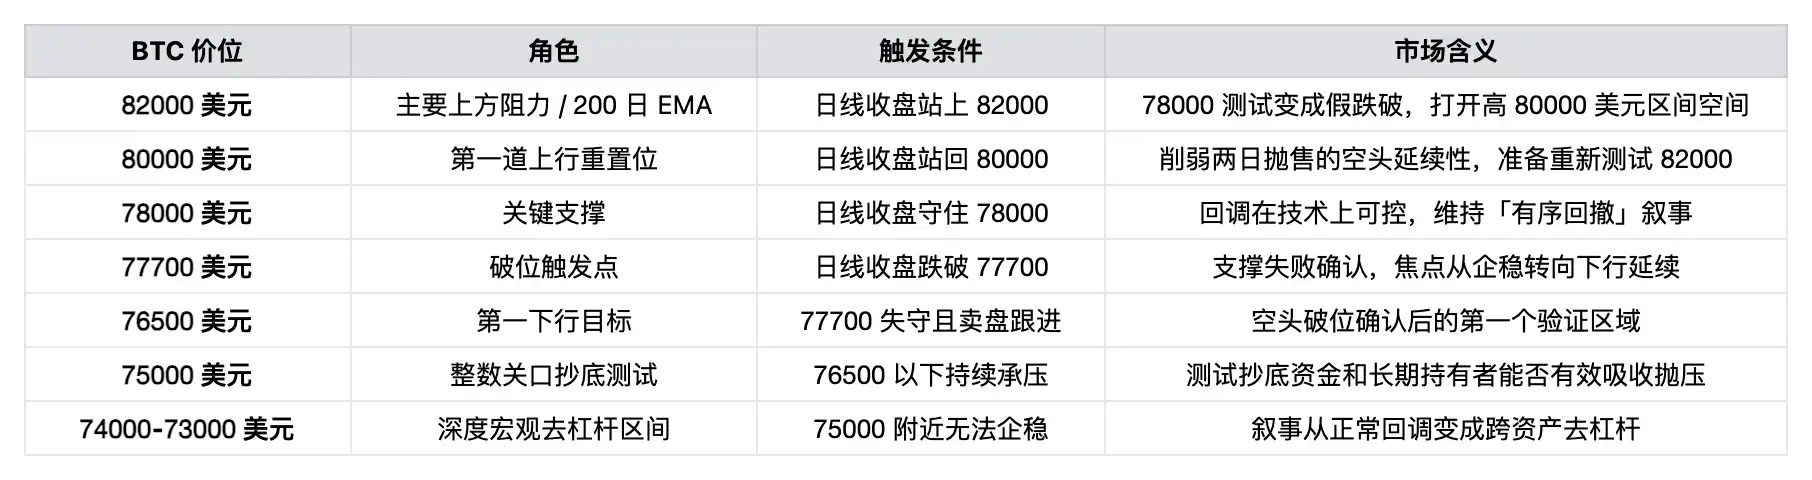
Возврат выше 80 000$ станет первым шагом к развороту медвежьего тренда — закрытие дневной свечи на этом уровне нарушит последовательность более низких минимумов последних двух торговых дней и даст быкам технически чистый сигнал к перезагрузке.
Более сложным рубежом является уровень 82 000$. 13 мая BTC уже пробил 200-дневную скользящую среднюю (примерно в районе 82 000$), что означает, что 82 000$ являются одновременно и психологическим уровнем сопротивления, и техническим барьером. Закрытие дневной свечи выше 82 000$ превратит тест уровня 78 000$ в ложный пробой.
Четыре сценария

На что смотреть дальше
Если доходность 10-летних облигаций откатится ниже 4,50%, цены на нефть отступят от отметок выше 105$, потоки в ETF снова станут положительными, биткоин сможет вернуться выше 80 000$. Это нарушит структуру более низких минимумов последних двух дней, после чего последует повторное тестирование уровня 82 000$ — позиции 200-дневной скользящей средней, которую BTC пробил 13 мая.
Закрытие дневной свечи выше 82 000$ превратит откат, вызванный динамикой доходности, в ложный пробой, открывая путь к более высоким уровням в районе 80 000$. Падение последней недели впоследствии могут расценить как коррекцию, цель которой — «встряхнуть» рынок, при этом базовая логика накопления активов не будет разрушена.
И наоборот, если BTC закроет день ниже 77 700$, при этом доходность казначейских облигаций останется около 4,60%, а ETF продолжат фиксировать отток, тест поддержки будет считаться провалившимся. Первой целью снижения станут 76 500$, после подтверждения пробоя медведи запустят новую волну падения. 75 000$ — это круглый уровень, где исторически покупатели демонстрируют реальную способность поглощать предложение.
Если ослабление продолжится ниже 75 000$, следующей целью станет диапазон 74 000 — 73 000$. На этих уровнях нарратив перестанет быть «коррекцией на крипторынке» и превратится в «макроэкономическое снижение рисков по всем классам активов» — переоценка затронет и акции, и облигации, BTC просто следует общей тенденции.
Сейчас макропеременные, определяющие краткосрочное направление биткоина, сначала должны стабилизироваться, чтобы мог сформироваться якорь для отскока. Доходность 10-летних облигаций 4,599%, 30-летних — 5,131%, что дает держателям минимальную доходность в 4,5–5,1%. BTC — это актив с нулевым купоном, и по разнице в ставках он изначально находится в невыгодном положении. Годовые инфляционные ожидания 4,5%, ФРС все еще находится на «стадии оценки», и быстрое смягчение политики далеко от текущих цен на рынке.
Зона 78 000$ сталкивается со структурным испытанием: смогут ли покупатели через ETF и долгосрочные держатели достаточно быстро поглотить давление продаж и стабилизировать цену, прежде чем уровень поддержки будет пробит.