Рыночная обстановка на этой неделе исключительно сложная — неожиданное выполнение иранского соглашения и разблокировка Ормузского пролива вызвали масштабную переоценку глобальных активов. Сильные колебания на эмоциональном фоне — это именно тот момент, когда структурный анализ наиболее ценен. Чем больше шума, тем важнее методика.
На этой неделе мы сосредоточимся на двух основных линиях: каким будет результат схватки за подтверждение отскока BTC после выхода выше 65 000 долларов, и приведет ли давление в зоне сопротивления 62.5–64.57 долларов для HYPE, завершившего четырехфазную коррекцию, к новым краткосрочным возможностям.
Полный анализ структуры движения, прогнозы по рынку и торговые стратегии смотрите в основном тексте.
Ключевые выводы для торговли на неделю:
• Анализ структуры движения BTC на часовом таймфрейме. (Подробности в разделе 1)
• Прогноз движения BTC на неделю и стратегии для среднесрочных и краткосрочных операций. (Подробности в разделе 2)
• Анализ структуры движения HYPE на часовом таймфрейме. (Подробности в разделе 3)
• Прогноз движения HYPE на неделю и стратегия для краткосрочных операций. (Подробности в разделе 4)
Проверка рыночной эффективности торговых стратегий и ключевых тезисов прошлой недели:
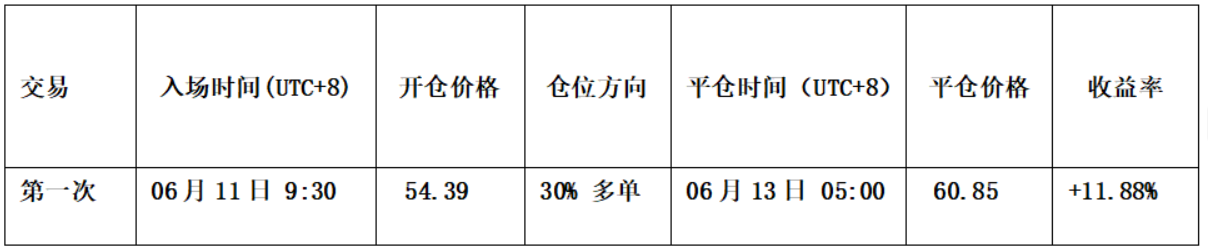
• Результаты краткосрочной торговли HYPE: На прошлой неделе была выполнена одна краткосрочная операция на покупку (кредитное плечо 1x) с доходностью около 11.88%. (Подробности в Таблице 1)
• Проверка прогноза движения BTC: В статье на прошлой неделе указывалось, что после кратковременного пробития уровня в 60 000 долларов цена получила поддержку и начнет краткосрочный отскок для подтверждения валидности пробития ключевого уровня. Текущее движение рынка подтверждает наш предыдущий прогноз.
• Проверка прогноза движения HYPE: В статье на прошлой неделе указывалось, что когда цена HYPE вернется к тестированию ключевой зоны поддержки 55–57 долларов, появятся сигналы остановки падения и стабилизации, и одновременно сработают сигналы дна по двум моделям, можно рассмотреть легкую позицию на покупку. Текущее движение рынка полностью соответствует нашему прогнозу.
1. Глубокий анализ структуры движения Биткоина на часовом таймфрейме
График BTC, свечи 4 часа
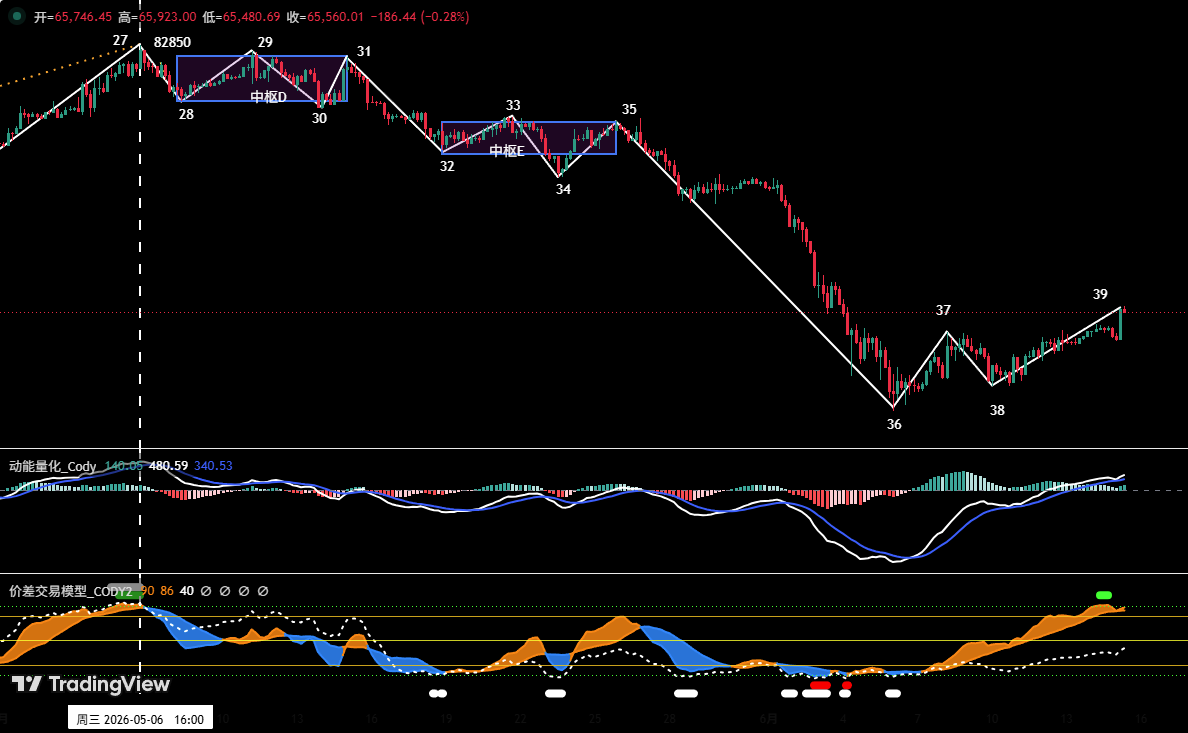
Рисунок 1
1. Как показано на (Рисунке 1), с момента коррекции от максимума 82 850 долларов 6 мая на 4-часовом графике можно детально выделить 12-фазную корректирующую структуру. Она включает два нисходящих центра: центра D и центра E. Общая структура четкая, демонстрирует типичную сложную корректирующую форму.
2. С точки зрения структуры движения на 4-часовом таймфрейме, в настоящее время идет отскок сегмента 38-39. Текущая цена уже вышла выше 65 000 долларов. Если впоследствии эффективность прорыва подтвердится, то следующим важным сопротивлением для отскока станет зона 69 500–70 500 долларов.
2. Прогноз движения Биткоина на неделю и торговая стратегия
1. Прогноз движения BTC на неделю:
Ключевая идея недели: следить за результатом подтверждения отката после прорыва уровня 65 000 долларов.
• Если при откате уровень не удержится, рынок может снова протестировать ключевой интервал поддержки 60 000–62 000 долларов.
• Если эффективно закрепится выше, то последует вызов ключевой зоны давления 69 500–70 500 долларов. Эта зона станет важным регионом для планирования нами среднесрочных позиций на продажу.
2. Ключевые уровни сопротивления:
• Первая зона сопротивления: 69 500–70 500 долларов (регион с высокой концентрацией предыдущих сделок)
• Вторая зона сопротивления: 72 500–74 500 долларов (регион с высокой концентрацией предыдущих сделок)
3. Ключевые уровни поддержки:
• Первый уровень поддержки: около 65 000 долларов
• Второй уровень поддержки: зона 59 000–60 000 долларов (предыдущий важный уровень поддержки)
• Третий уровень поддержки: около 55 000 долларов (предыдущий важный уровень поддержки)
4. Торговая стратегия на неделю (исключая влияние внезапных новостей)
1. Среднесрочная стратегия:
График BTC, свечи 1 день: (Модель мониторинга позиций)
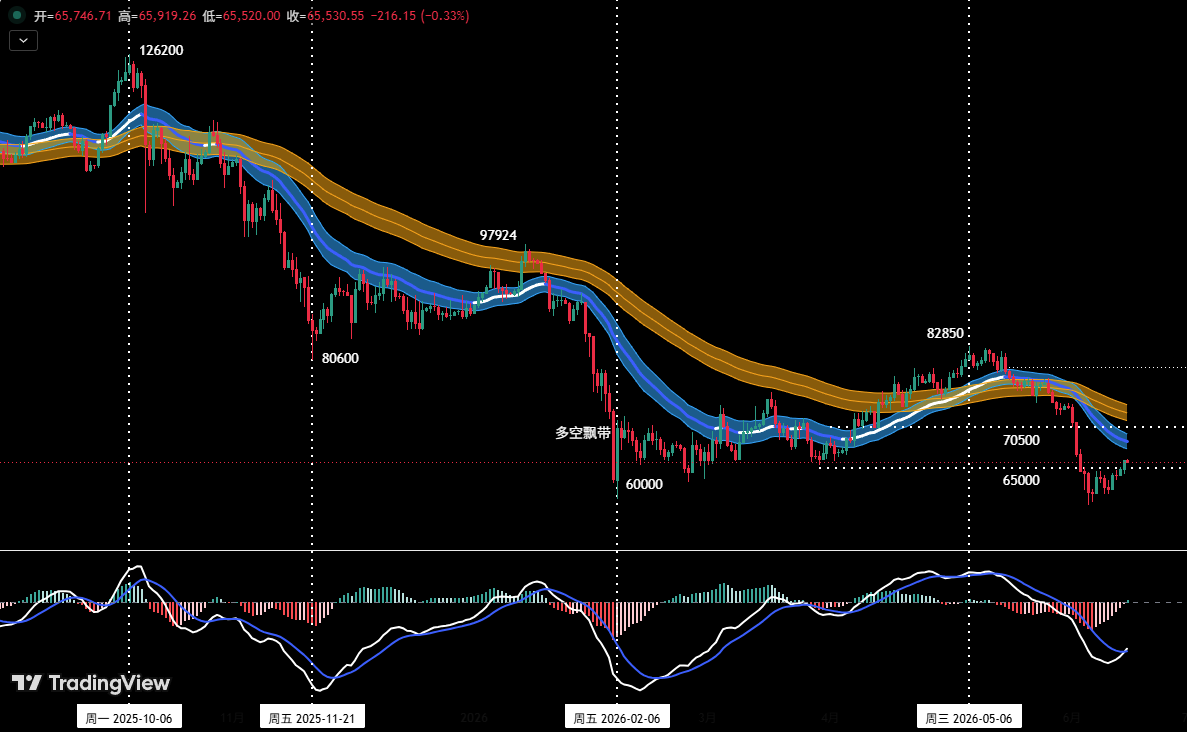
Рисунок 2
Модель мониторинга позиций: Как показано на (Рисунке 2), текущая цена эффективно пробила «канал быков/медведей», техническая картина перешла в формат, контролируемый медведями. На прошлой неделе рынок не удовлетворил условия нашего плана по открытию позиций (на продажу), поэтому среднесрочные позиции временно отсутствуют.
На этой неделе, основываясь на результате схватки быков и медведей за уровень 65 000 долларов, можно постепенно наращивать короткие позиции по следующей трехступенчатой стратегии:
• Добавление в зоне сильного сопротивления: Если цена успешно закрепится в зоне 65 000 долларов, и при последующем отскоке до зоны 69 500–70 500 долларов появятся четкие признаки давления, можно рассмотреть среднесрочную позицию на продажу, общий объем позиций должен контролироваться ниже 60%.
• Продажа по пробитию поддержки: Если цена потеряет поддержку на уровне 65 000 долларов и подаст сигнал эффективного пробития, можно последовательно открыть предварительную среднесрочную короткую позицию объемом 30%.
• Догоняющая продажа по пробитию: Если цена потеряет поддержку на уровне 65 000 долларов и эффективно пробьет интервал поддержки 59 000–60 000 долларов, можно последовательно добавить короткую позицию, общий объем позиций должен контролироваться ниже 60%.
2. Краткосрочная стратегия: используйте 30% капитала, установите стоп-лосс, ищите возможности для сделок на «разнице цен», опираясь на уровни поддержки и сопротивления. (Операционный цикл 30/60 минут).
3. В краткосрочных операциях для динамичного реагирования на сложную эволюцию рынка мы заранее разработали две конкретные операционные схемы A/B.
• Схема A: Открытие позиции в зоне сильного сопротивления.
• Открытие: Если цена успешно закрепится в зоне 65 000 долларов, и при последующем отскоке до зоны около 69 500–70 500 долларов появятся сигналы затухания роста, совмещенные с сигналами верха от количественной модели, можно открыть короткую позицию объемом ниже 30%.
• Управление рисками: Установите начальный уровень стоп-лосса.
• Закрытие: При коррекции до важных уровней поддержки в сочетании с сигналами модели можно постепенно фиксировать прибыль.
• Схема B: Эффективное пробитие поддержки, продажа по тренду.
• Открытие: Если цена потеряет поддержку на уровне 65 000 долларов и подаст сигнал эффективного пробития, можно последовательно открыть короткую позицию объемом ниже 30%.
• Управление рисками: Установите начальный уровень стоп-лосса.
• Закрытие: При падении до важных уровней поддержки в сочетании с сигналами модели можно постепенно фиксировать прибыль.
3. Анализ структуры движения HYPE на часовом таймфрейме
График HYPE, свечи 4 часа
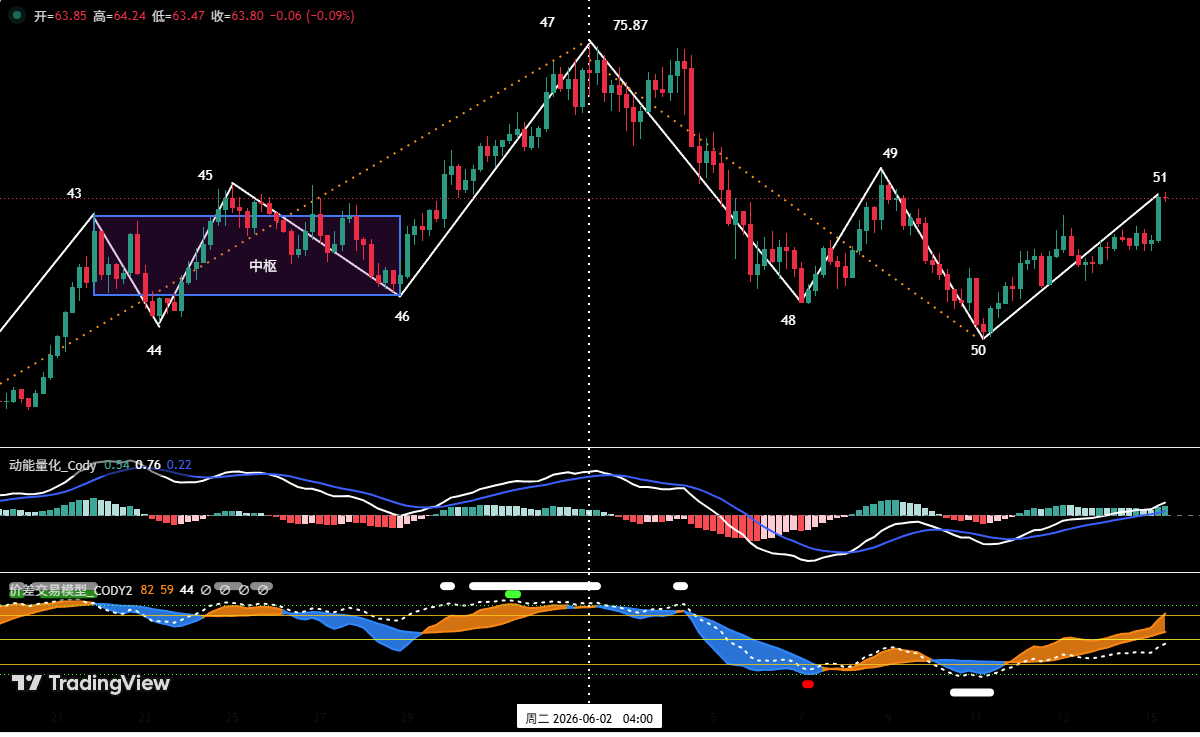
Рисунок 3
1. Как показано на (Рисунке 3), на 4-часовом периоде движение HYPE с момента коррекции от максимума 75.87 долларов 2 июня можно детально разделить на четырехфазную корректирующую структуру: сегменты (47-48), (48-49), (49-50), (50-51).
2. В настоящее время цена HYPE стабилизировалась и начала рост в зоне поддержки 52 доллара, находится в процессе отскока сегмента (50-51). Сопротивление сверху находится в зоне 62.5–64.57 долларов. Если (точка 51) сформирует максимум в этой зоне (вероятность того, что общее движение сформирует здесь «нисходящий центр», довольно высока), то цена продолжит поиск сильной поддержки ниже.
4. Прогноз движения HYPE на неделю и стратегия для краткосрочных операций
1. Прогноз движения HYPE на неделю:
1. Ключевые уровни сопротивления:
• Первый уровень сопротивления: зона 62.5–64.57 долларов;
• Второй уровень сопротивления: зона 68–70 долларов;
2. Ключевые уровни поддержки:
• Первый уровень поддержки: зона 52–55.5 долларов;
• Второй уровень поддержки: зона 47–49 долларов;
Ключевая идея по HYPE на неделю:
• Наблюдать за эффектом давления в зоне 62.5–64.57 долларов и за тем, в каком положении сформируется максимум цены для «точки 51».
2. Стратегия краткосрочных операций с HYPE на неделю: (покупка на поддержке)
Краткосрочная торговля HYPE на этой неделе должна следовать стратегии «накопления на снижениях, избегания покупок на росте».
Краткосрочная стратегия: Пробная покупка при стабилизации в зоне поддержки
Когда цена HYPE вернется к тестированию ключевой зоны поддержки 52–54.5 долларов или более глубокой зоны 47–49 долларов, появятся сигналы остановки падения и стабилизации, одновременно сработают сигналы дна от двух моделей, можно рассмотреть легкую пробную позицию на покупку. Объем позиции должен строго контролироваться ниже 30%, и необходимо строго соблюдать дисциплину по стоп-лоссу.
5. Разбор операций с HYPE
1. Обзор краткосрочных операций: (см. Таблицу 1)
Мы строго следовали операционному плану, основываясь на сигналах от самостоятельно созданных «Модели торговли на разнице цен» и «Количественной модели импульса», и выполнили одну краткосрочную операцию на покупку на прошлой неделе, получив прибыль 11.88%.
2. Сводка деталей краткосрочной сделки с HYPE: (кредитное плечо *1x)
3. Разбор краткосрочной сделки: (см. Рисунок 4)
1. Стратегия открытия позиции:
• Ранее была пройдена довольно полная структура нисходящей коррекции;
• Самостоятельно созданная «Модель торговли на разнице цен» заранее выдала сильный сигнал предупреждения о дне (красная и белая точки на графике);
• Самостоятельно созданная «Количественная модель импульса» выдала сигнал дивергенции импульса на дне;
На основе этих трех пунктов мы открыли позицию на покупку объемом 30% около 54.39 долларов.
2. Стратегия закрытия позиции:
• Когда цена поднялась до уровня около 62.5 долларов, появились сигналы встречи сопротивления;
• Самостоятельно созданная «Модель торговли на разнице цен» заранее выдала сигнал предупреждения о вершине (белая точка на графике);
• Самостоятельно созданная «Количественная модель импульса» выдала сигнал дивергенции импульса на вершине;
Поэтому мы закрыли всю позицию около 60.85 долларов.
3. Итог: данная сделка принесла прибыль около 11.88%.
График HYPE, свечи 30 минут: (Количественная модель импульса + Модель торговли на разнице цен)
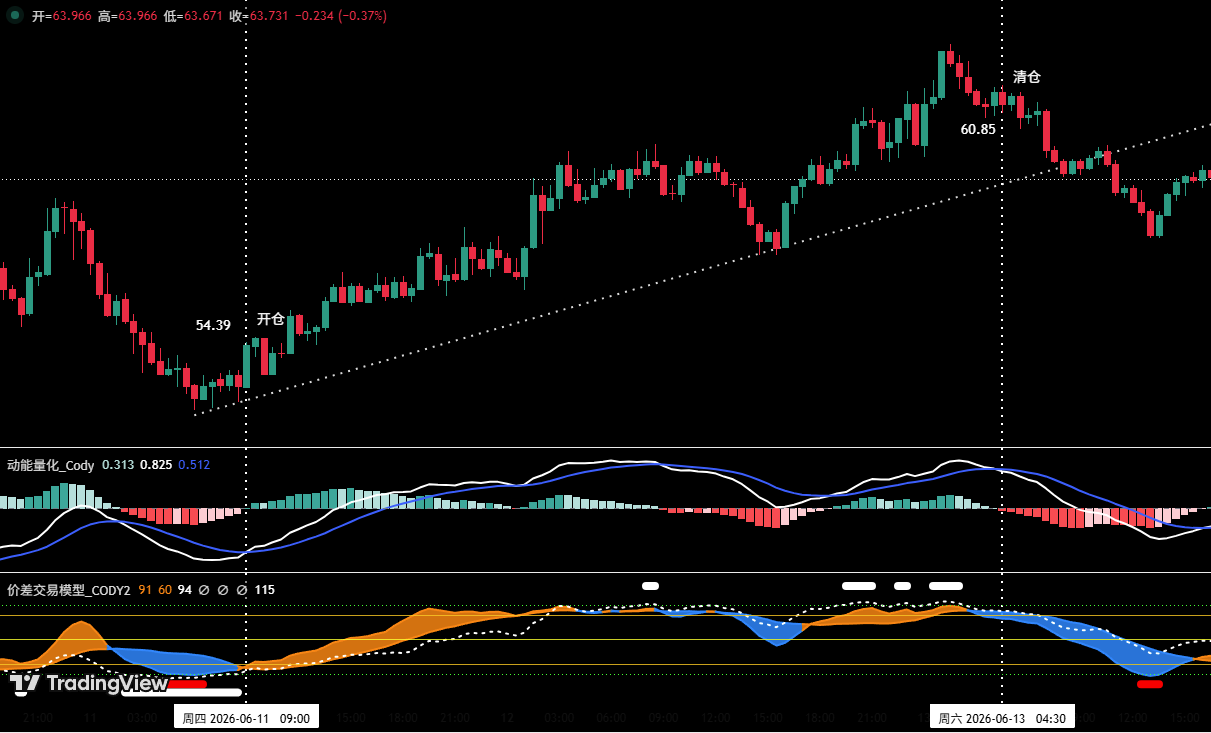
Рисунок 4 (Иллюстрация краткосрочной сделки)
6. Особое примечание:
1. При открытии позиции: Немедленно установите начальный уровень стоп-лосса.
2. При достижении прибыли 1%: Переместите стоп-лосс на цену открытия позиции (точка безубыточности), чтобы обеспечить безопасность основного капитала.
3. При достижении прибыли 2%: Переместите стоп-лосс на уровень прибыли 1%.
4. Постоянное отслеживание: В дальнейшем при каждом увеличении прибыли на 1% уровень стоп-лосса синхронно перемещается на 1%, динамично защищая и фиксируя прибыль.
Финансовые рынки меняются мгновенно, весь рыночный анализ и торговые стратегии требуют динамической корректировки. Все мнения, аналитические модели и операционные стратегии, затронутые в данной статье, основаны на личном техническом анализе, предназначены исключительно для личного торгового дневника и не являются инвестиционной рекомендацией или основой для действий. Рынок несет риски, инвестиции требуют осторожности, не принимайте решений на основе этой информации.