Author: Glassnode
Compiled by: AididiaoJP, Foresight News
Bitcoin fell 13% this week, profitability collapsed significantly, realized losses surged, and spot sellers regained control. US spot ETF investors fell back into unrealized losses after encountering resistance near their cost basis, while the options market continues to price high risk.
Summary
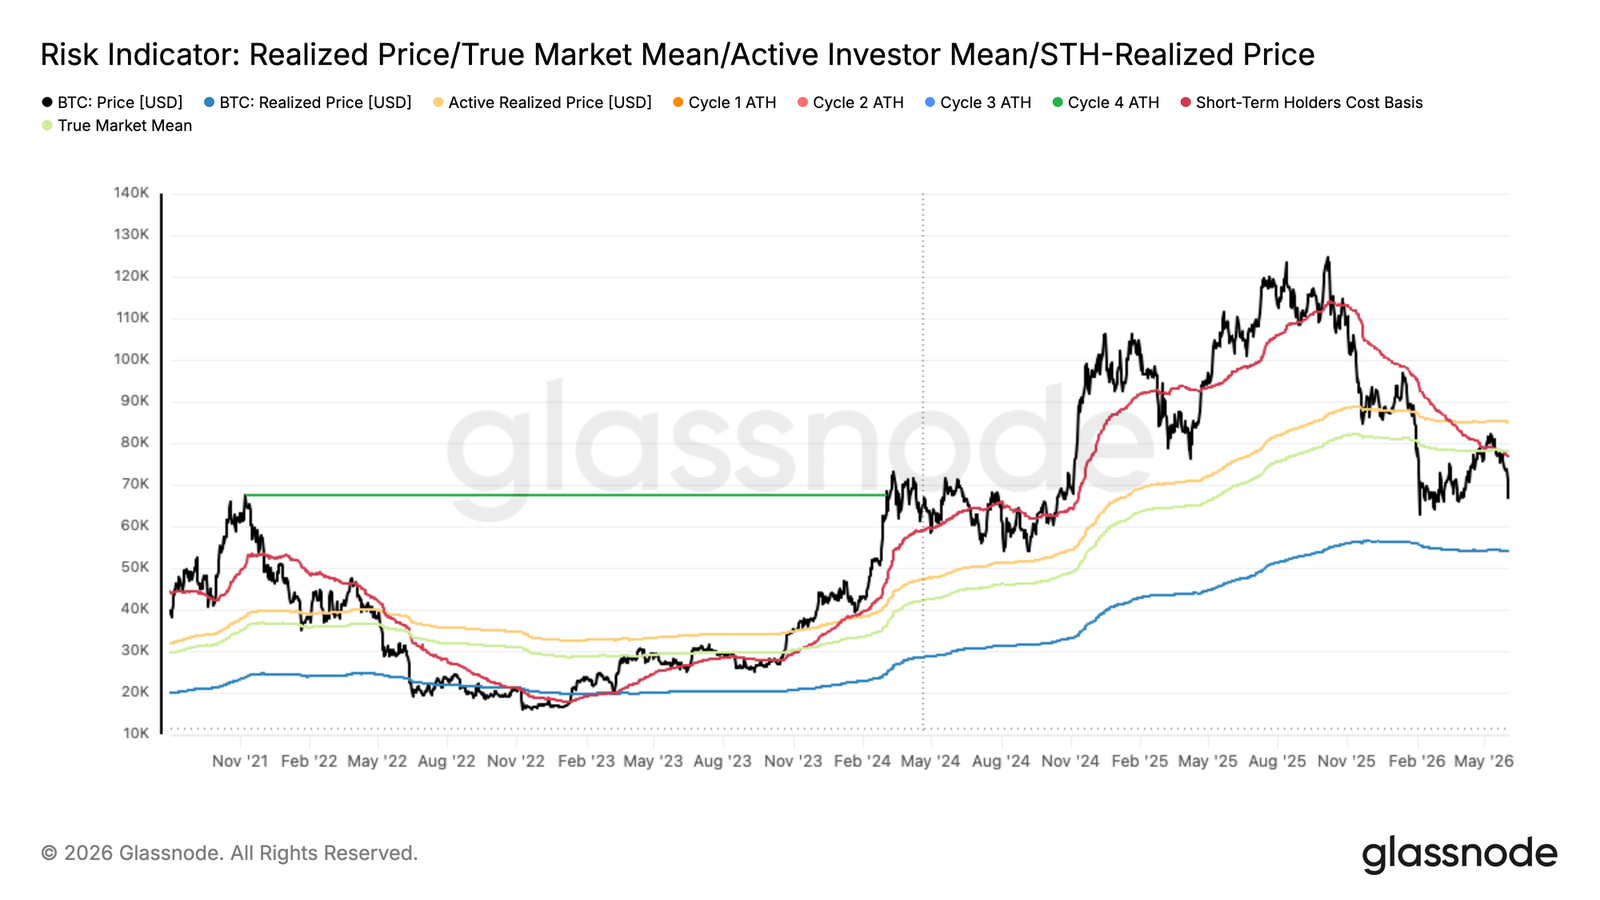
- Bitcoin fell 13% over the past 7 days, retreating to the midpoint between the realized price and the Realized Cap Mean. The cost basis of Short-Term Holders has fallen below the Realized Cap Mean for the first time (since January 2022), confirming late-bear market characteristics.
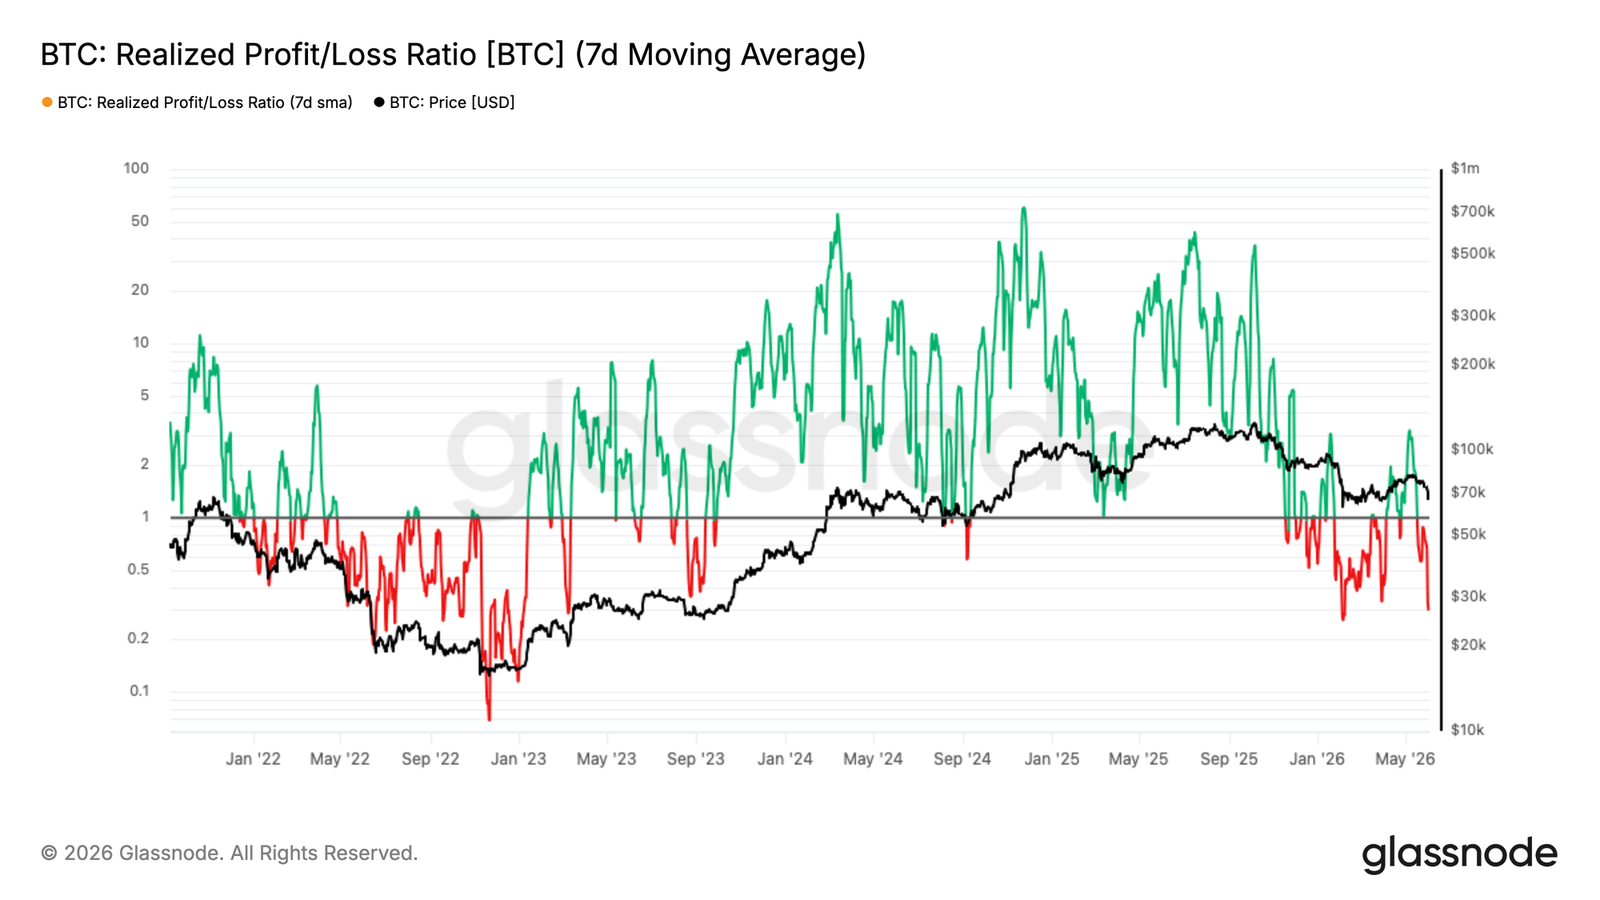
- The 7-day moving average of the Realized Profit/Loss Ratio plummeted from a local high of 3.16 to 0.29, almost identical to the panic wave in February; while the 90-day moving average never breached the threshold of 2, confirming that the rally to $82k was just a bear market rally, not a structural shift.
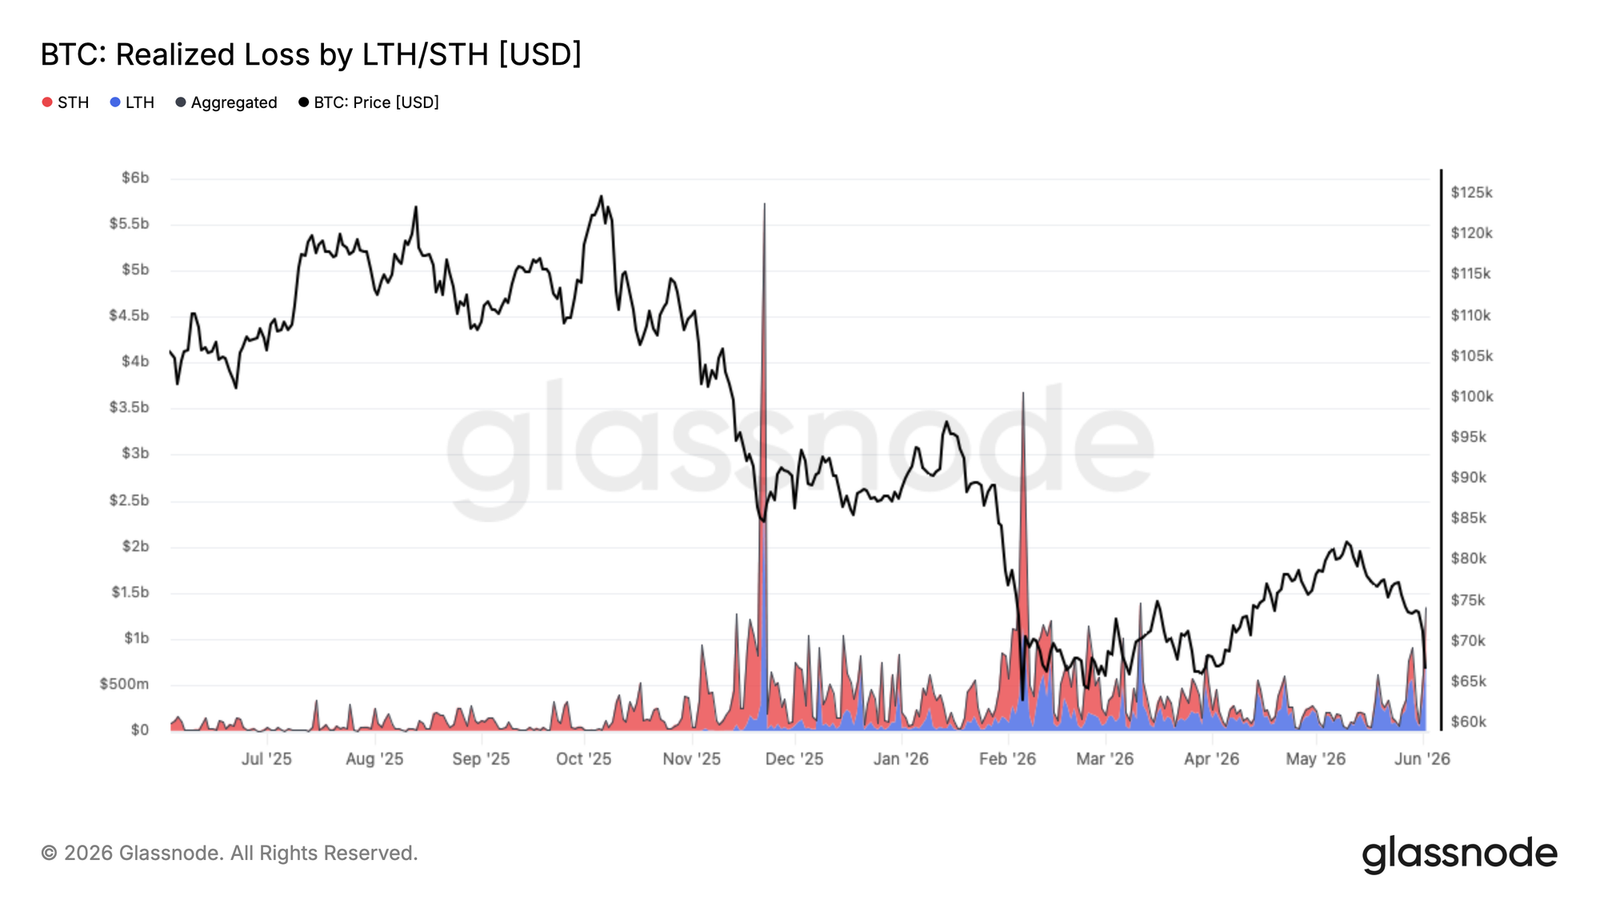
- The daily total realized loss surged to $1.35 billion, of which $770 million came from long-term holders capitulating near cycle tops, indicating the supply redistribution process is accelerating but remains incomplete.
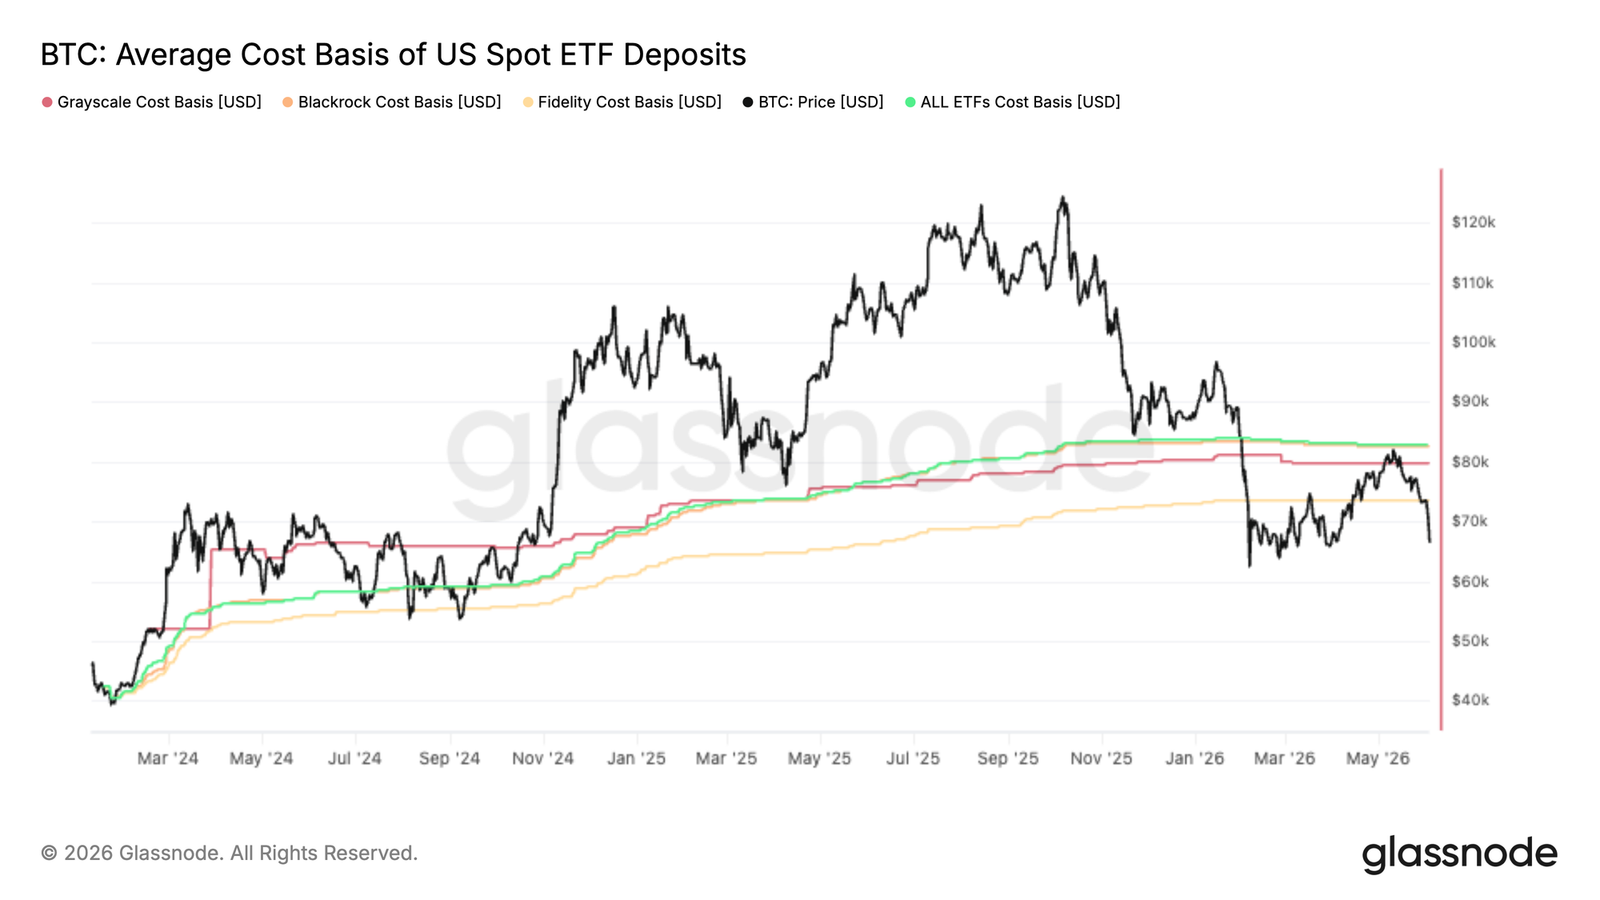
- Bitcoin encountered rejection almost precisely at the aggregate US spot ETF cost basis of $83k, pushing the average ETF investor back into an unrealized loss, reinforcing this level as a key resistance.
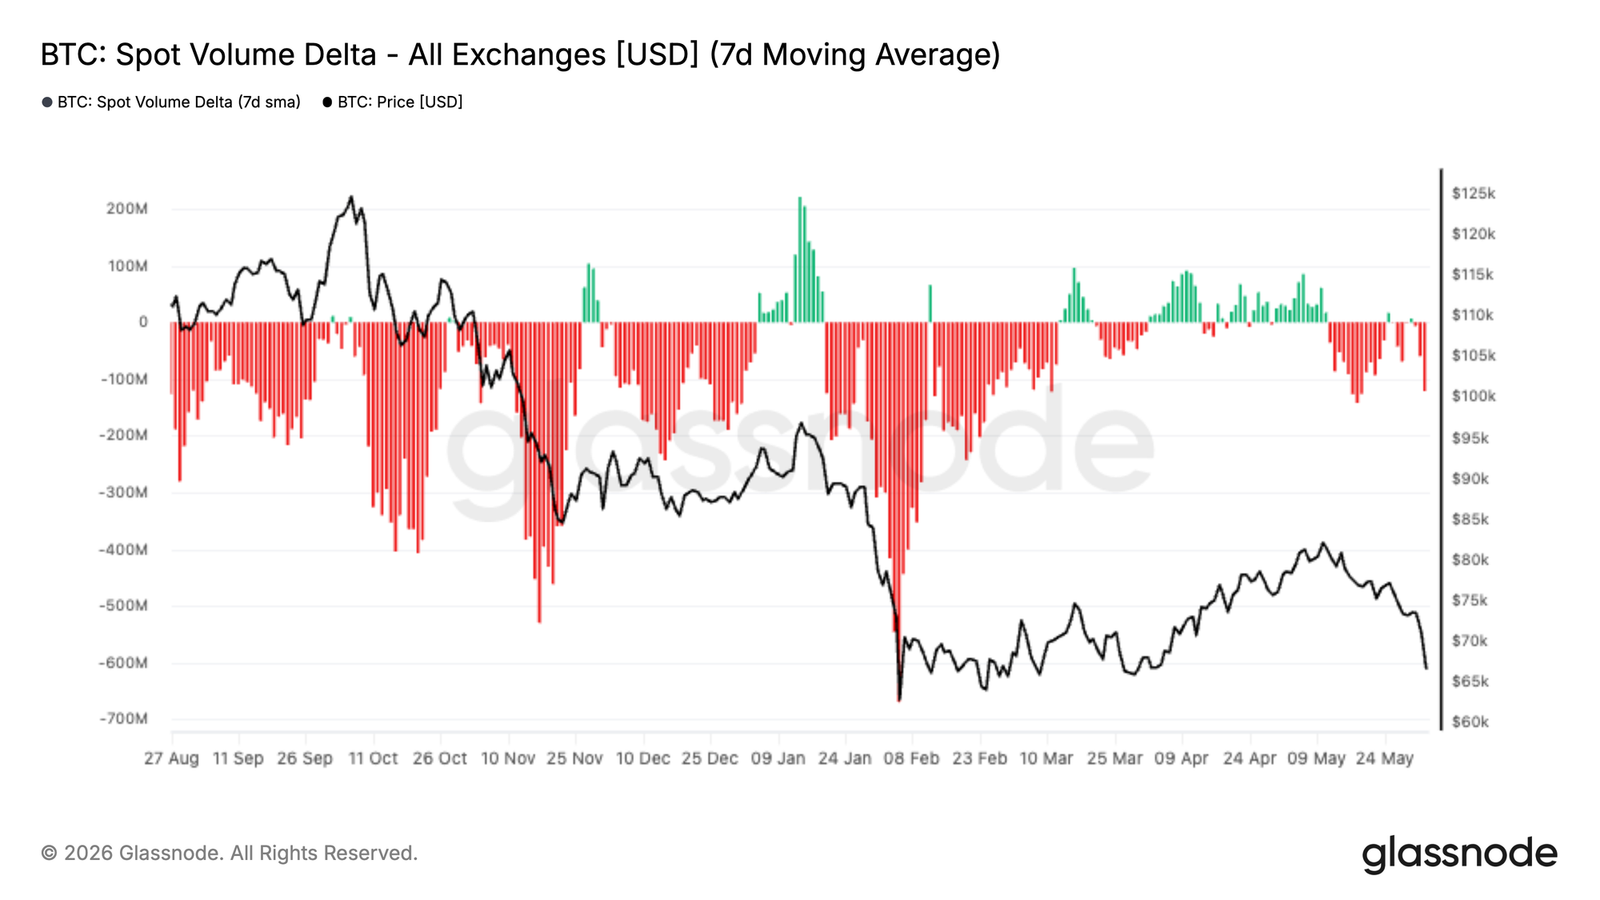
- Spot market selling pressure intensified, with the 7-day spot volume delta turning significantly negative, reaching its weakest level since February, indicating sellers continue to dominate the order book despite the pullback.
- Implied volatility continues to compress, while the volatility risk premium expanded, with the options market pricing future volatility higher than recent realized market performance.
- Skew remains in the put premium region, but the recent sell-off did not trigger a significant increase in demand for downside hedging.
- Market maker positioning is concentrated near the current spot price, with Bitcoin sitting in a maximum negative gamma zone, and order flow continues to favor protective demand.
Macro Insights
US JOLTs job openings rose to 7.62 million in April, the highest in nearly two years, 750k above market expectations. The 10-year Treasury yield climbed back above 4.45%, and the market is pricing over a 50% probability of a Fed rate hike by year-end, with no rate cuts expected for the full year. The Dollar Index holds above 99. Financial conditions are marginally tightening, not easing.
Bitcoin has absorbed this shift more sharply than any other risk asset, falling 13% over the past week to the $67,000 range. US spot ETFs saw outflows for three consecutive weeks, totaling $4.21 billion, the largest institutional redemption wave of 2026. Institutions are de-risking ahead of price declines, not reacting after the fact. Friday's Non-Farm Payrolls data is a key watchpoint. Strong data will extend the current distribution pressure; weak data may provide the first reset condition.
On-Chain Insights
Back in Bear Territory
The macro headwinds directly translated into a deterioration in on-chain structure. The 13% drop last week pulled the price back down from the Realized Cap Mean of $77.8k, which tracks the cost basis of actively traded supply and historically acts as a bull/bear market divider. The current price of $67k sits in the middle of this range, failing to hold above the Realized Cap Mean, reconfirming that a bearish continuation remains the dominant framework.
Notably, the Short-Term Holder cost basis has now fallen to $76.4k and dipped below the Realized Cap Mean, a configuration last seen in January 2022. This setup indicates new buyers are accumulating below the market's key mean valuation, a classic feature of late bear markets: the time dimension of the drawdown begins to pressure investor conviction, historically making structural failures or large-scale capitulation more likely at this stage.
Profitability Bias Collapses in Decline
Against this structural deterioration, the short-term flow environment shifted sharply with the recent price drop. The 7-day moving average of the Realized Profit/Loss Ratio has contracted to 0.29, indicating loss realization is now heavily dominating on-chain spending behavior. This is almost identical to the panic wave in early February. On May 7th, this 7-day MA spiked to 3.16 as investors realized profits during the $82k rally, but the 90-day MA never breached the threshold of 2 associated with truly bullish flows. This divergence between short-term and medium-term readings is a clear signal of the rally's lack of structural conviction, fitting a local top pattern within a bear market, not a credible structural shift. The subsequent fall to 0.29 further confirms this.
New Buyers Under Pressure
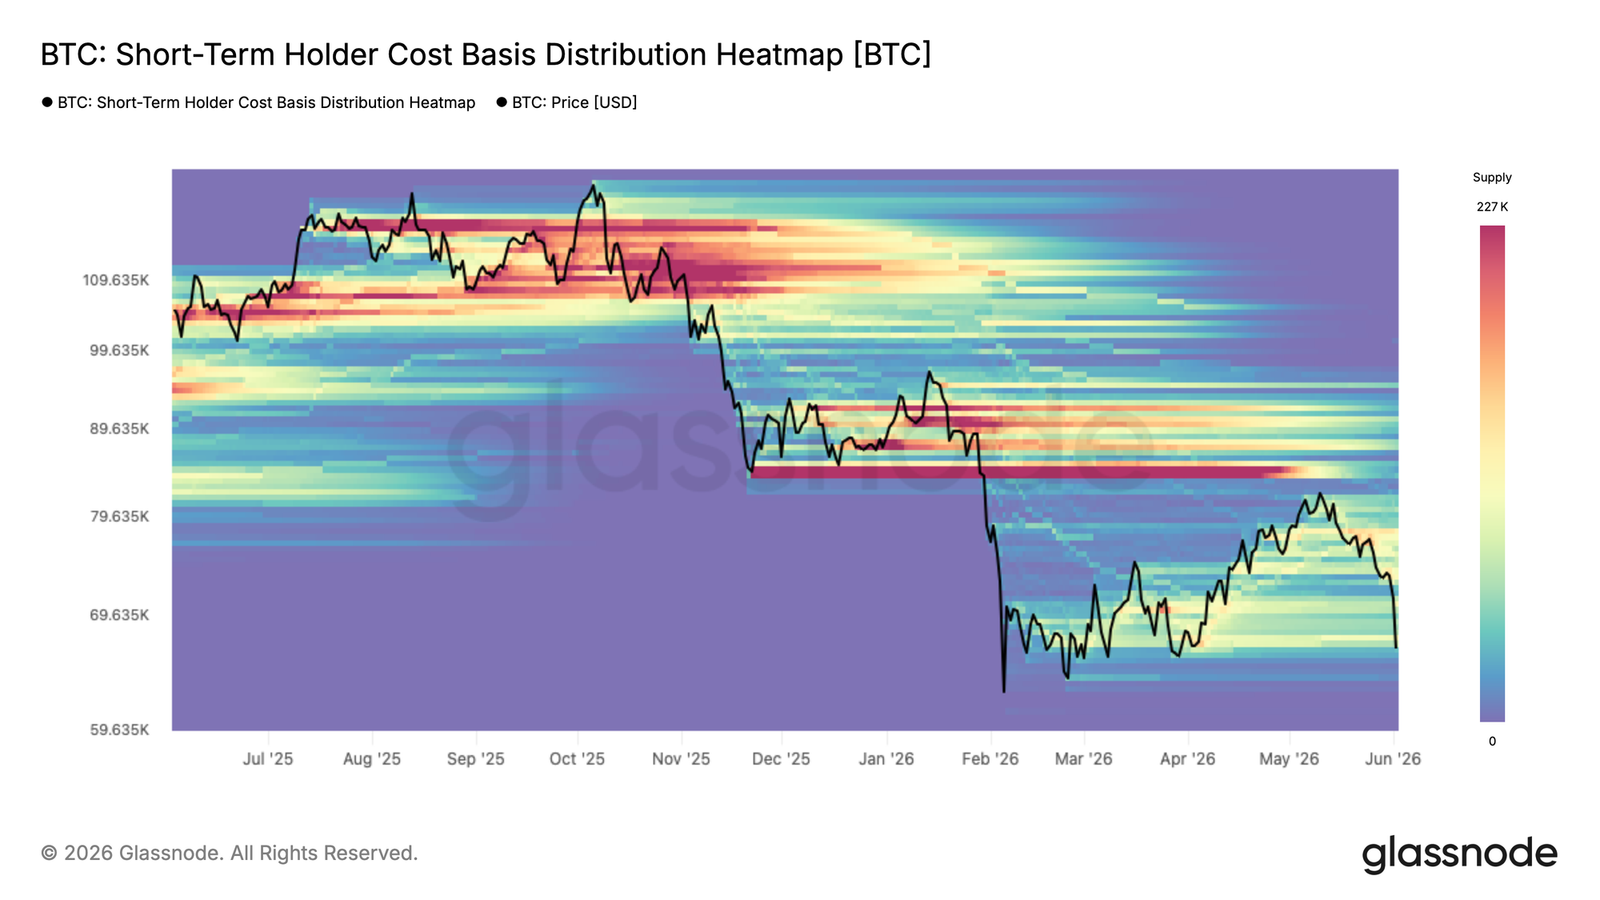
Resistance from the bear market top range has directly exposed the most recently accumulated supply to loss. The Short-Term Holder Cost Basis Distribution heatmap shows the density of supply held by recent buyers across price clusters, revealing where the STH cost basis is concentrated, and thus where behavioral pressure is most likely.
As price retraces to the ~$67k region, it is approaching the lower bounds of supply clusters accumulated since February. At this zone, a significant volume of Short-Term Holders are seeing their unrealized gains compressed to breakeven or turning negative. Those who accumulated near the $78k-$82k local top face the most immediate pressure. Their decision to hold or capitulate will determine whether the current price can absorb selling pressure or give way to deeper declines.
Accelerating Loss Realization Across Cohorts
As recent buyers are pressed back to the lower bounds of their three-month range, the pressure for loss realization has expanded beyond the latest accumulated supply to a broader base. The current retracement to $67k has pushed the daily total realized loss to $1.35 billion, a significant acceleration from baseline levels during the prior consolidation.
Of this, $770 million daily is being realized by Long-Term Holders who acquired before January 2026, reflecting continued capitulation by cycle-top buyers as the bear market extends in time. The remainder comes from more recent buyers who accumulated within the $67k-$82k range in 2026 and are now being forced to realize losses as price falls below their cost basis.
This pattern of Long-Term Holder capitulation and supply transfer to new buyers at lower prices is a recurring and necessary feature of cycle bottoming processes as bear markets mature. However, the current pace of loss realization suggests this process remains incomplete.
Off-Chain Insights
Breaking Below ETF Cost Basis
Bitcoin's latest rally stalled almost precisely near the aggregated US spot ETF cost basis of $83k, turning a level that previously acted as support into clear resistance. This suggests a significant number of previously underwater ETF investors used the rally to lighten positions or exit at breakeven.
This rejection is particularly notable given that ETF flows have been a dominant source of demand this cycle. When price struggles to reclaim the average holder's cost basis, it often indicates that supply from trapped investors is overwhelming new demand, creating overhead resistance.
Looking ahead, the aggregated ETF cost basis remains a key watch level. A decisive reclaim would return the average ETF investor to profitability and potentially improve sentiment within that cohort. Until then, failure to hold above it suggests ETF holdings remain a headwind, with investors using strength to de-risk rather than accumulate.
Spot Buying Disappears
Spot market flow deteriorated sharply over the past two weeks, with the 7-day spot volume delta turning negative and reaching its weakest level since the February sell-off. This indicates aggressive sellers are again dominating the spot order book, further reinforcing the weakness of recent price action.
What's distinctive about the current move is that it follows a period of sustained spot-led accumulation in April and early May. During that ascent, buyers consistently lifted offers, pushing spot volume delta into positive territory and helping Bitcoin recover from the mid-$60ks to the $80ks. That demand impulse has now faded, with sellers regaining control as price failed to break higher.
A persistently negative spot volume delta is typically associated with either a capitulation event or the early stages of a broader trend reversal. For now, it suggests the market remains in a distribution phase, with spot participants selling into rallies rather than accumulating. A notable improvement in spot demand remains a key signal needed to underpin a sustainable recovery.
Futures Liquidations
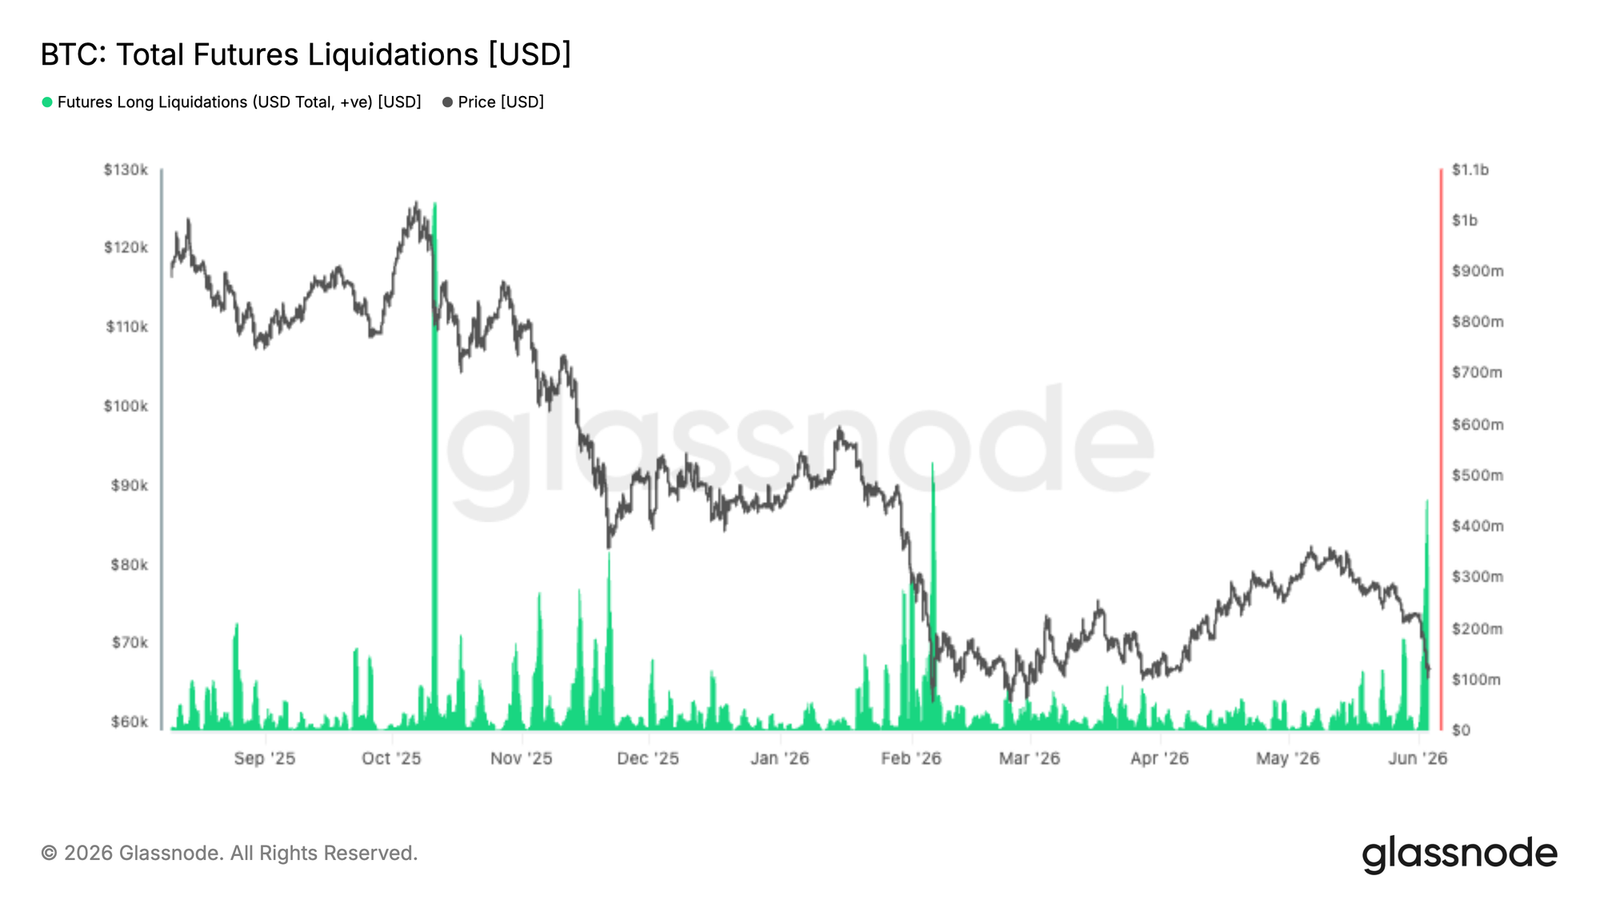
The latest market downturn triggered one of the largest liquidation events of the cycle, with over $400 million in leveraged long positions forcibly closed as Bitcoin broke below $70k. While painful for late entrants, such events often purge excess leverage from the system and reset market positioning.
Notably, the scale of this liquidation remains smaller than during the corrections in October 2025 and February 2026, suggesting leverage was not excessively stretched entering this decline. Historically, large long liquidations often coincide with local exhaustion points, as forced selling cascades through derivatives markets and flushes out weak hands.
The key question ahead is whether spot demand can step in to absorb the supply. If liquidation-driven selling pressure begins to subside while spot buyers return, the market may be left with a cleaner positioning backdrop and lower overhang of leverage, setting the stage for a more sustainable recovery.
Implied Volatility Continues its Descent
Looking at implied volatility, the dominant trend remains compression across the term structure despite the spot breakdown. The 1-month tenor fell from ~38% to 34%, with the 3-month and 6-month tenors also compressing by roughly 3 volatility points over the past two weeks.
This move reflects a market unwilling to pay up for options even after Bitcoin broke below recent range lows. While front-end volatility saw brief reactive spikes during sharp spot moves, these were quickly sold, maintaining the broader downtrend.
The term structure remains in contango, with forward volatility still trading at a premium to the front end. This indicates traders continue to view recent price weakness as a local event, not a catalyst for a broader volatility repricing.
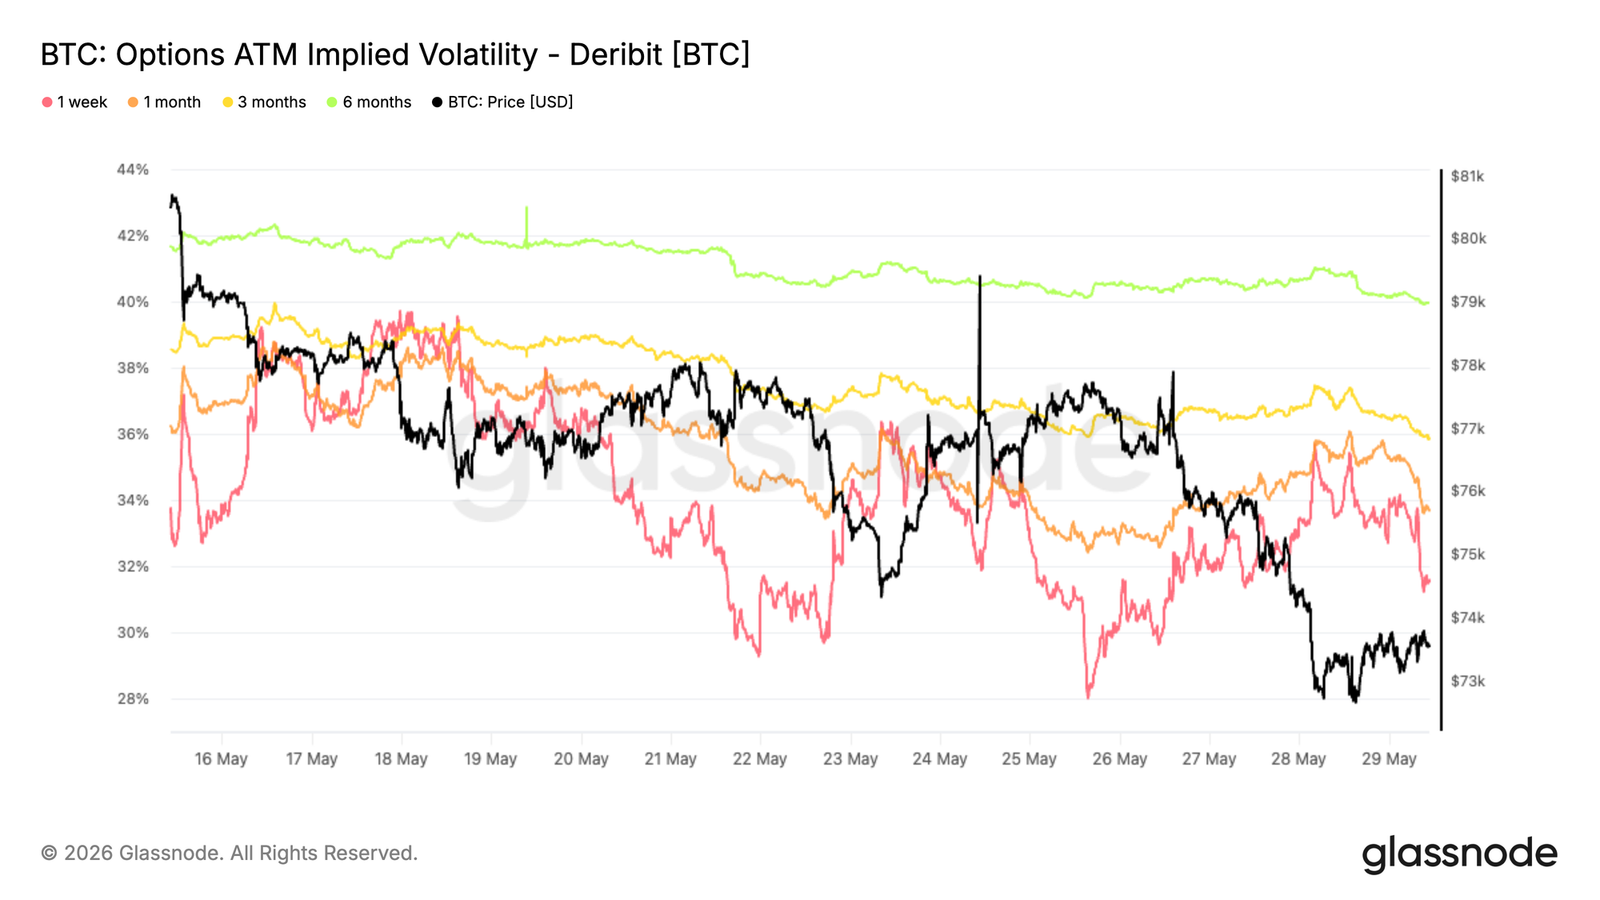
Volatility sellers remain in control, with no acceleration in demand for protection despite price weakness.
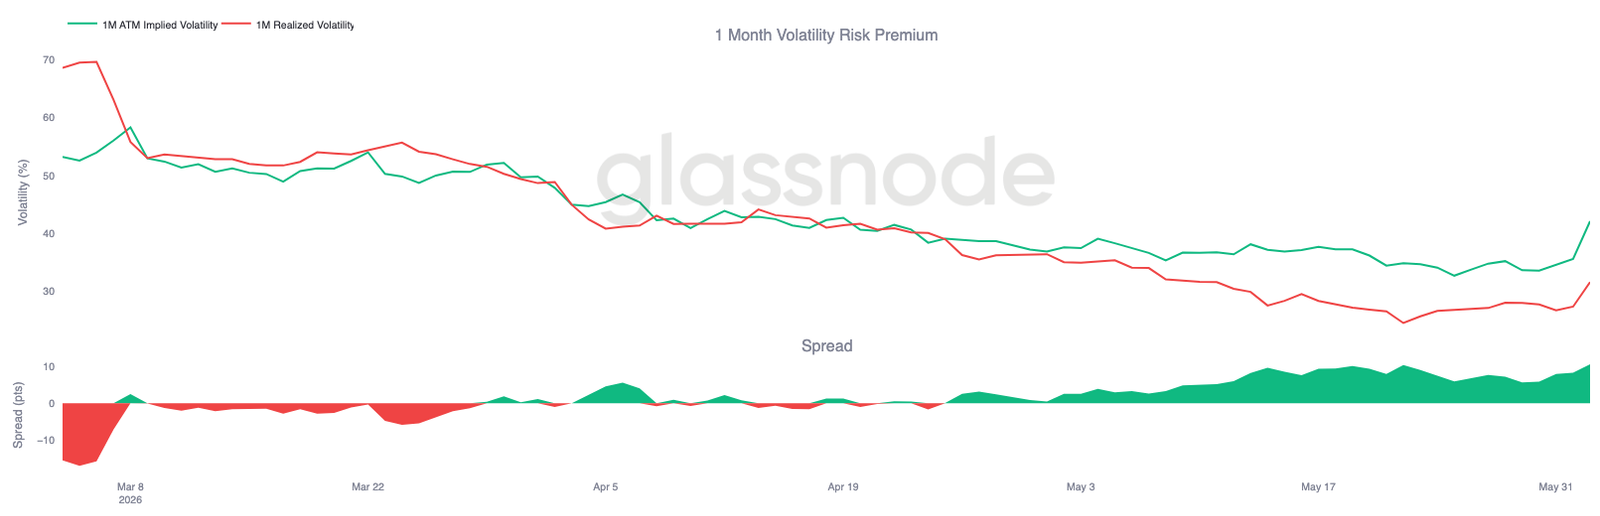
Volatility Risk Premium Nears Three-Month Highs
As implied volatility declines, its relationship with realized volatility tells a different story. Despite Bitcoin experiencing a volatile period, the options market continues to price future volatility significantly higher than what the spot market has recently delivered.
The 1-month implied volatility has rebounded to ~42%, while realized volatility remains near 32%. The result is an expanded volatility risk premium, now near its highest levels of the past three months.
This dynamic was particularly evident during the recent sell-off. While realized volatility picked up as spot broke key supports, implied volatility rose faster, reflecting fresh demand for options and protection.
The options market continues to assign a higher probability to future volatility than recent price action alone would imply, keeping volatility premiums elevated significantly.
Put Premiums Remain Elevated
As the volatility risk premium expands, skew shows where traders continue to concentrate their option demand. Despite the spot breakdown, put options remain persistently more expensive than calls across the term curve.
Conclusion
Bitcoin's latest decline further reinforces the view of a still fragile market, with weakness evident across profitability, investor behavior, ETF holdings, and spot market demand. Rejection near the aggregate ETF cost basis of ~$83k indicates many investors remain trapped above current prices, creating overhead supply that continues to cap Bitcoin's rallies.
Meanwhile, realized losses are accelerating, long-term holders are beginning to sell in size, and spot order flow has decidedly shifted to sellers. While recent liquidation events help clear leverage from the system, there is little evidence yet of a durable demand response capable of absorbing the resulting supply.
A similar story holds in the options market. Traders continue to pay for downside protection and future volatility, but there is no sign of the panic that often accompanies large declines. Until spot demand strengthens, ETF investors return to profitability, and selling pressure begins to abate, the market remains at risk of further declines and continued consolidation within a broader bear market structure.