Key Takeaways
- Ethereum (ETH) is the second-biggest cryptocurrency in the world.
- Ethereum traded above $4,000 in December 2024 but has fallen since.
- Our Ethereum price prediction suggests ETH could return above $3,000.
Ethereum launched the Pectra upgrade on May 7, its most significant upgrade since Dencun. This upgrade had the unintended consequence of making the ETH supply inflationary.
Pectra aims to remedy this by doubling the number of Blobs, which has already had a deflationary effect on the ETH supply.
Ethereum’s price has reacted positively to the upgrade, increasing by over 50%.
Let’s examine our price predictions for ETH, made on May 15, 2025. We will also examine the history of ETH prices and explain what ETH is and what it does.
Ethereum Price Prediction
Here are the Ethereum price predictions from CCN on May 15, 2025. The projections are made using the wave count method, while the minimum and maximum targets depend on the price movement during each specific year.
Minimum Ethereum Price Prediction Average Ethereum Price Prediction Maximum Ethereum Price Prediction 2025 $1,385 $2,600 $3,750 2026 $740 $1,100 $2,400 2030 $5,000 $7,230 $15,000
The most likely wave count suggests that Ethereum has completed a five-wave upward movement since 2016 and corrected inside a W-X-Y structure (red) since its all-time high in 2021.
If the count is accurate, Ethereum is in sub-wave B (black) of the final wave Y. Giving wave Y the same length as wave X leads to a low of $740.
The Fib Time Zone tool suggests ETH will reach the low in June 2026.
During this projected upward movement, the wave count method predicts an Ethereum price of $2,600 by the end of 2025.

ETH/USDT Weekly Chart | Credit: Valdrin Tahiri/TradingView Then, we will use the daily rate of increase for the past seven years to make an Ethereum price prediction for the end of 2026 and 2030.
Ethereum’s price has increased by 370% in the past seven years, for a daily rate of 0.225%. Projecting this rate of increase forward from the June 2026 low leads to prices of $1,100 and $7,230 for the end of 2026 and 2030, respectively.
Ethereum Price Prediction for 2025
The wave count method predicts that Ethereum’s price will range between $1,385 and $3,750 by the end of 2025.
Ethereum Price Prediction for 2026
The wave count method and the daily rate of increase predict that Ethereum’s price will range between $740 and $2,400 by the end of 2026.
Ethereum Price Prediction for 2030
The wave count method and the daily rate of increase predict that Ethereum’s price will range between $5,000 and $15,000 by the end of 2026.
Ethereum Price Analysis
Ethereum’s price has completed a five-wave upward movement with an unusually extended wave five since April 7.
While the movement became parabolic on May 10, it has lost some momentum this week, becoming much more gradual.
Furthermore, technical indicators are showing weakness. The Relative Strength Index (RSI) and Moving Average Convergence/Divergence (MACD) created bearish divergences, a characteristic of wave five tops.
If the analysis is accurate, the ETH price has started an A-B-C correction (red), which can end at three support levels.
An extremely shallow retracement would reach the $2,420 area, a Fibonacci and horizontal support.

ETH/USDT Six-Hour Chart | Credit: Valdrin Tahiri/TradingView
A deeper retracement could bring the $2,220 and $2,060 levels into play, coinciding with an ascending parallel channel.
Because of the highly extended wave five, it is unlikely that Ethereum’s price will fall below $2,060 without invalidating the count.
Short-term ETH Price Prediction
The Ethereum price prediction for the next 24 hours is bearish. ETH will likely retrace toward $2,060 before eventually resuming its upward movement.
Ethereum Average True Range (ATR): ETH Volatility
The Average True Range (ATR) measures market volatility by averaging the largest of three values: The current high minus the current low, the absolute value of the current high minus the previous close, and the absolute value of the current low minus the previous close over a period, typically 14 days.
A rising ATR indicates increasing volatility, while a falling ATR indicates decreasing volatility.

Ethereum ATR | Credit: Valdrin Tahiri/TradingView On Jan. 3, 2025, ETH’s ATR was 44, a sign of average volatility.
ETH Relative Strength Index (RSI): Is ETH Overbought or Oversold?
The Relative Strength Index (RSI) is a momentum indicator that traders use to determine whether an asset is overbought or oversold. Movements above 70 and below 30 show over- and undervaluation, respectively.
Movements above and below the 50 line indicate whether the trend is bullish or bearish.

ETH Weekly RSI | Credit: Valdrin Tahiri/TradingView On May 15, 2025, Ethereum’s RSI was 52, suggesting a neutral trend gradually turning bullish.
ETH Market Cap to TVL Ratio
The Market Cap to Total Value Locked (TVL) ratio measures the valuation of a decentralized finance project by comparing its market capitalization to the total value of assets locked in its smart contracts. This ratio shows the project’s utilization and links the platform’s health to locked asset value.
A ratio above 1.0 indicates overvaluation because the market cap exceeds the value of assets used in the platform. A ratio below 1.0 indicates undervaluation because the market cap is lower than the value of locked assets.
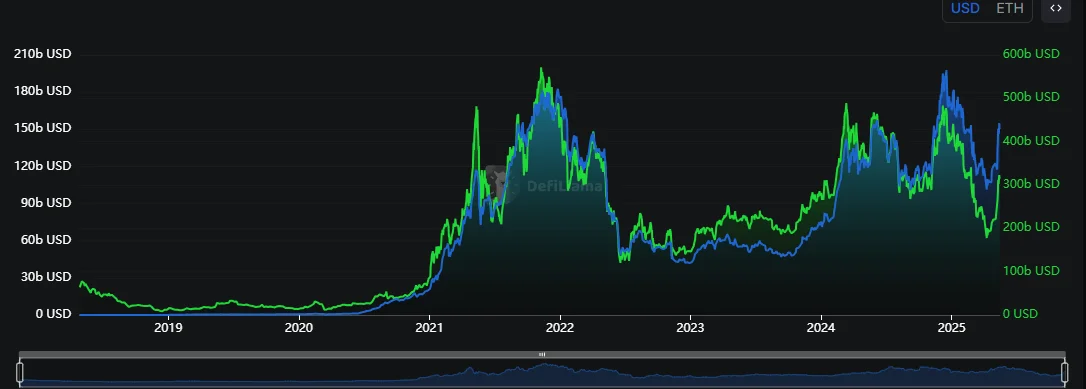
ETH MCAP/TVL | Credit: DeFiLlama On May 15, 2025, the Ethereum TVL ratio was 2.12, indicating a slight overvaluation.
CCN Strength Index
The CCN Strength Index combines an array of advanced market signals to measure the strength of individual cryptocurrencies over the last 30 days.
Every day, it assigns a strength score, ranging from 0 to 100, to the top 500 assets by market capitalization on CoinMarketCap, focusing on both trend direction and the intensity of price movements.
- 0 to 24: Assets exhibit significant weakness, showing signs of sustained downtrend behavior.
- 25 to 35: The price tends to move within stable bounds with minimal volatility.
- 36 to 49: Assets begin a stable uptrend but without strong surges.
- 50 to 59: Consistent growth with moderate price advances, building momentum.
- 60+: Sharp price movements and high demand indicate more volatility and trend shifts.
The index dynamically adapts to rapid changes. For example, an asset experiencing a 100% increase within a short timeframe would see a sharp jump in its score to reflect the intensity of the rise.
However, should that asset stabilize at this new price level, the score will gradually taper down and align with the dampened momentum as the movement normalizes.
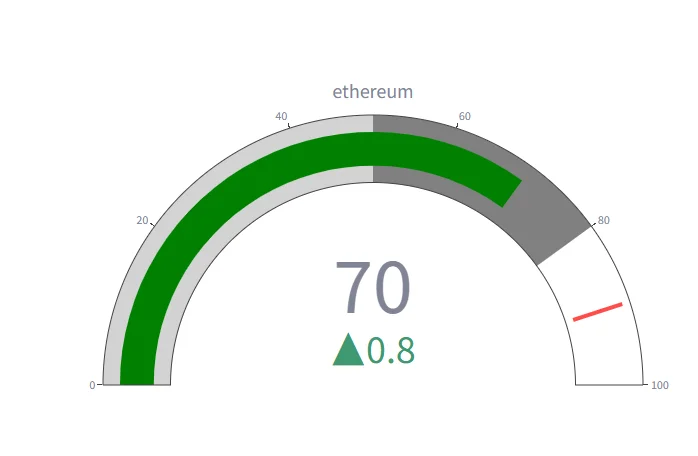
ETH CCN Index | Credit: CCN May 15, 2025, Ethereum scored 70 on the CCN Index, suggesting strong momentum.
Best Days and Months to Buy
We looked at the ETH price history and found the times when the price was at its lowest across certain days, months, quarters, and even weeks in the year, indicating the best times to buy Ethereum.
Time to Buy ETH Days, Weeks, Months, and Quarters Best Day Wednesday Best Week 33 Best Month January Best Quarter First
ETH Price Performance Comparison
Ethereum is a blockchain that deals with smart contracts, so let’s compare its performance with similar projects.
Current Price One Year Ago Price Change Ethereum $2,552 $3,035 -12.1% Solana $170.52 $158.01 +17.6% Cardano $0.77 $0.45 +76.9% Avalanche $23.79 $34.63 -27.8%
Advantages and Disadvantages
CCN’s Senior Research Analyst, Toghrul Aliyev, studied Ethereum in depth and found its advantages and disadvantages.
Advantages of Ethereum
Development
- Ethereum ranks number one across multiple key development metrics: 112,535 repositories, 1,540 sub-ecosystems, 43,475 weekly commits, and 2,913 active developers. These numbers demonstrate Ethereum’s extensive range of applications and projects. The active development results in fewer bugs, faster issue resolution, and the ability to swiftly meet user demands and stay ahead of competitors.
Centralization and Decentralization
- The 2016 The DAO hack led to the theft of 3.6 million ETH. In response, Ethereum implemented a hard fork to restore the stolen funds. Critics argue this decision contradicted Ethereum’s decentralized ethos. However, the hard fork demonstrated true decentralization only after achieving majority consensus through extensive community discussions and voting. With 14% of the total supply at risk and the ecosystem’s future in jeopardy, the move was not a bailout. In contrast, no hard fork was implemented when the Parity multi-signature wallet was exploited in 2017. Other critics compare The DAO hack to the Mt. Gox collapse, but this comparison misses key differences. When MtGox’s losses were revealed, the funds had already been widely dispersed, making a simple revert impossible. In the case of The DAO, the funds were locked for several weeks after the transfer, allowing for a different response.
Market Position
- The approval of ETH ETFs makes Ethereum accessible to institutional investors like pension funds, mutual funds, and insurance companies. As a result, Ethereum is now part of traditional finance, which enhances its liquidity and price stability.
- Ethereum ranks 1st in DEX trading volume, holding a 33.4% market share in the first quarter of 2024, with $144.2 billion in trades.

2024 Spot DEX Trading Volume Q1, 2024. Credit: CoinGecko
- Ethereum leads in real-world asset tokenization. It has an almost 72% market share in tokenized US Treasuries. Ethereum also holds more than 98% of the commodities and more than 53% of the stablecoin supply on its network.
US Treasuries Stablecoins Commodities Ethereum $1384.49M $88604.92M $864.89M Stellar $433.27M $226.43M $9.83M Solana $47.96M $3199.73M – Mantle $39.72M – – Polygon $10.32M $361.26M – Arbitrum $5.22M $1309.82M – Gnosis $2.23M – – TRON – $61680.08M – BNB Smart Chain – $4994.37M – Base – $2,972.77 – Avalanche – $2185.47M – NEAR – $714.01M –
- Positive: Ethereum dominates the DeFi sector by total value locked, holding more than 56% of the market share.

Total Value Locked – All Chains. Source: DefiLlama Supply and Scalability
- Positive: Users can stake Ethereum to earn rewards by participating in the network’s validation process.
- Positive: Ethereum’s burning mechanism, introduced through the EIP-1559 upgrade, reduces the total supply of ETH over time. Each transaction on the Ethereum network includes a base fee, which gets burned, permanently removing that ETH from circulation. If the rate of ETH being burned is greater than the rate at which new ETH is created, the total supply of ETH decreases, leading to increased scarcity and potentially higher value per token.
Disadvantages of Ethereum
Development
- When problems arise in the Ethereum network, solutions often involve outsourcing tasks to external organizations. This practice can compromise the protocol’s integrity because it relies on outside parties rather than the community or core developers. It creates a situation where external companies have significant influence over the network, leading to conflicts of interest and reducing the system’s trustworthiness.
- Layer 2 solutions offer faster and cheaper transactions, causing users and developers to focus on them rather than the Ethereum network. As a result, developers prioritize creating and enhancing Layer 2 or Layer 3 solutions, shifting their innovation and development efforts away from Ethereum itself.
- Ethereum developers focus on long-term solutions that take years to implement, mainly concentrating on Layer 2s and Layer 3s. Meanwhile, competitors are addressing Ethereum’s issues more quickly, thus attracting more users, developers, and investment. The dynamic leads to a loss of market share for Ethereum as other platforms offer immediate improvements and capture more of the market.
Centralization and Decentralization
- Liquid staking lets users stake Ether and receive tokens representing their staked assets, which can be traded or used in other DeFi applications. However, it poses a risk to the protocol’s health. If too much Ether concentrates in liquid staking services, a few entities could gain significant control over the network. This is already a reality because Lido and Coinbase control over 40% of the market share in Ethereum’s staking. For proof-of-stake platforms, control by more than 33% of the stake is problematic because it increases the risk of collusion and potential network compromise.

Credit: Dune Analytics/Hildobby
- As the hardware requirements for running a node on the Ethereum network increase, only entities with large data centers can afford to keep up. Smaller, individual node operators may find it too expensive to continue participating. This trend leads to a more centralized network, where a few large players dominate, reducing the network’s resilience and decentralization. As of July 2024, five ISPs—Amazon, Hetzner Online, OVH SAS, Comcast Cable, and Spectrum—are responsible for 1/3 of the network’s nodes out of 893 providers. The situation has improved since August 2022, when three ISPs hosted 2/3 of the nodes . However, this improvement still does not fully resolve the centralization issue.

Credit: Ethernodes.org
- MEV refers to the profit miners can make by reordering, including, or excluding transactions within the blocks they produce. Instead of finding ways to solve this problem, Ethereum has started accommodating it by supporting proprietary MEV builders. The focus on MEV builders gives them precedence over local, smaller block producers, which can lead to a more centralized and unfair system.
- Staking requires a minimum of 32 ETH, equivalent to $112,000 at an Ethereum price of $3,500, making it inaccessible for the average retail investor. The barrier reduces the level of decentralization, as fewer individuals can participate in securing the network.
- Ethereum’s decision-making relies heavily on a small group of developers, which centralizes control and slows the decision-making process. The absence of on-chain governance means fewer community voices influence major updates, leading to less flexible responses to challenges. A centralized structure hampers Ethereum’s ability to adapt quickly and increases the risk of users and developers moving to more responsive platforms.
Market Position
- Negative: Year-to-date inflows and outflows of Ethereum have resulted in a net outflow of $0.85 billion. More money leaving the chain than coming in indicates that investors and users prefer other chains over Ethereum, which could lead to decreased network activity and hinder its growth and development.

Inflows and outflows: Credit: Artemis.xyz Supply and Scalability
- Ethereum’s low throughput of 13 Transactions Per Second (TPS) causes network congestion when transaction volume spikes. As a result, users face high fees, sometimes even exceeding $100 per transaction .

ETH Average Transaction Fee. Source: Etherscan
- Ethereum relies on Layer 2 solutions like Arbitrum and Optimism to handle more transactions. These help reduce congestion and fees but make Ethereum less viable as a standalone option. The significant market share of these Layer 2 platforms indicates a preference for alternatives. Although these solutions operate within the Ethereum ecosystem, relying on external chains instead of in-house solutions is not ideal.
- Due to congestion and inefficiency, Ethereum’s inability to scale results in a poor user experience. Additionally, fragmentation across Layer-2 solutions complicates dApp interoperability. It also complicates integrating new projects with existing ones, while reduced composability hampers innovation and growth within the ecosystem.
- Ethereum’s focus on being a secure data availability layer for Layer 2 solutions highlights its scalability limitations. The mainnet remains less scalable, affecting the efficiency of the DA Layer. Meanwhile, scalable blockchains can process more transactions, capture higher revenue, and enhance security. This puts Ethereum at a competitive disadvantage as it struggles to match the performance and efficiency of more scalable blockchains.
- Successful Layer 2 solutions may abandon Ethereum for more scalable Layer 1 blockchains. If Ethereum doesn’t provide sufficient revenue for these protocols to thrive, they will likely migrate to other platforms that offer better scalability and profitability, further weakening Ethereum’s ecosystem.
- Due to scalability issues, congestion, and high fees, Ethereum’s DEX trading volume market share has been chipped away by other chains, mainly its Layer 2 solution, Arbitrum, and Ethereum’s biggest competition, Solana. In October 2023, Ethereum’s DEX trading volume market share was 56.49%, but by March 2024, it had dropped to 33.4%.
- Recently, interest in Ethereum has dropped, leading to inflation exceeding the amount of ETH burned. Since April 2024, the net increase in ETH supply has been about 60,000 ETH monthly. If this trend continues, by Dec. 2024, the total supply of ETH could return to the levels seen at the time of the Merger.
Ethereum Price History
Now, look at some key dates in the ETH price history . While past performance is not an indicator of future results, knowing what the token has done can help provide context when making or interpreting an Ethereum price prediction.
Period Ethereum Price Last Week (May 8, 2025) $1,939 Last Month (April 15, 2025) $1,645 Three months ago (Feb. 15, 2025) $2,704 One year ago (May 15, 2024) $3,035 Five years ago (Jan. 3, 2020) $207.85 Launch price (Aug. 7, 2015) $2.83 All-time high (Nov. 16, 2021) $4,891 All-time low (Oct. 21, 2015) $0.42
Ethereum Market Cap
The market capitalization, or market cap, is the sum of the total ETH in circulation multiplied by its price.

Ethereum market cap for the last 12 months | Credit: CoinMarketCap On May 15, 2025, Ethereum’s market cap was $306 billion, making it the second-largest crypto by that metric.
Who Owns the Most Ethereum (ETH)?
On May 15, 2025, one wallet held more than 50% of ETH’s supply.
Richest ETH Wallet Addresses
As of May 15, 2025, the five richest ETH wallets were
- 0x00000000219ab540356cbb839cbe05303d7705fa. This wallet held 61,413,109 ETH, or 50.86% of the supply.
- 0xc02aaa39b223fe8d0a0e5c4f27ead9083c756cc2. This wallet held 2,694,435 ETH, or 2.23% of the supply.
- 0xbe0eb53f46cd790cd13851d5eff43d12404d33e8. This wallet, listed as Binance, held 1,996,008 ETH, or 1.65% of the supply.
- 0x40b38765696e3d5d8d9d834d8aad4bb6e418e489. This wallet held 1,376,695 ETH, or 1.14% of the supply.
- 0x49048044d57e1c92a77f79988d21fa8faf74e97e. This wallet held 1,107,296 ETH, or 0.92% of the supply.