Perspectivas On-Chain
Atrapado en el Rango
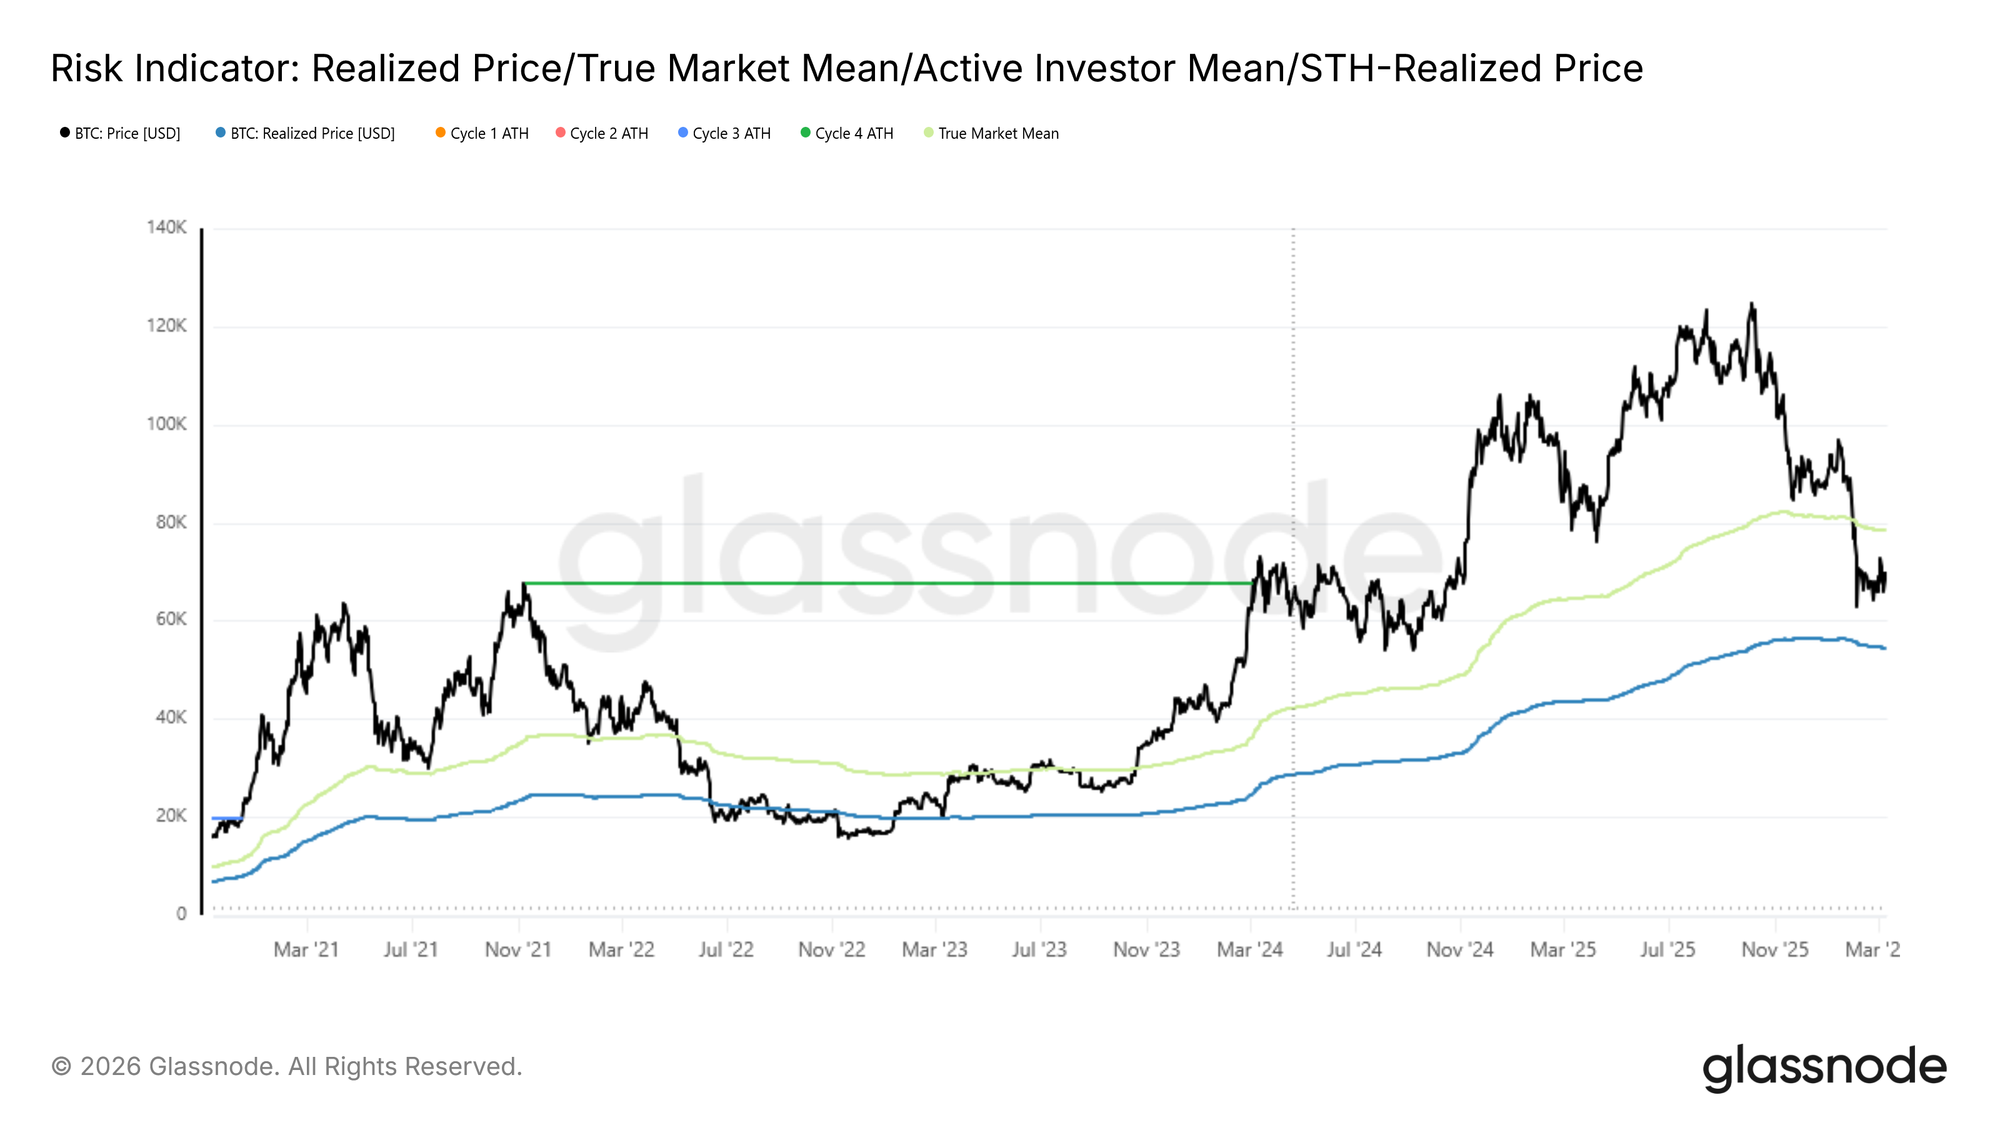
Bitcoin ha pasado más de un mes consolidándose dentro de un rango de $62.8k–$72.6k, con múltiples intentos fallidos de establecerse por encima de $70k, cada rechazo acompañado de breves picos en la Ganancia Neta Realizada que superaron los $5M por hora, lo que indica una toma de ganancias oportunista en lugar de una demanda sostenida. En una vista más amplia, el precio actualmente está intercalado entre dos modelos de coste base estructuralmente significativos: el Precio Realizado en $54.4k, que representa el coste de adquisición promedio de todo el suministro en circulación, y la Media Verdadera del Mercado en $78.4k, que rastrea el coste base de las monedas transaccionadas activamente.
En ausencia de vientos macroeconómicos adversos más amplios, este rango podría plausiblemente soportar un rebote de alivio del mercado bajista limitado por la Media Verdadera del Mercado. Sin embargo, la superposición de la incertidumbre geopolítica sobre una estructura ya frágil que ha fallado repetidamente en mantenerse por encima de $70k inclina la distribución de rendimientos a medio plazo hacia la baja, con el Precio Realizado sirviendo como el principal nivel de soporte a monitorizar.
Acumulación Sin Convicción
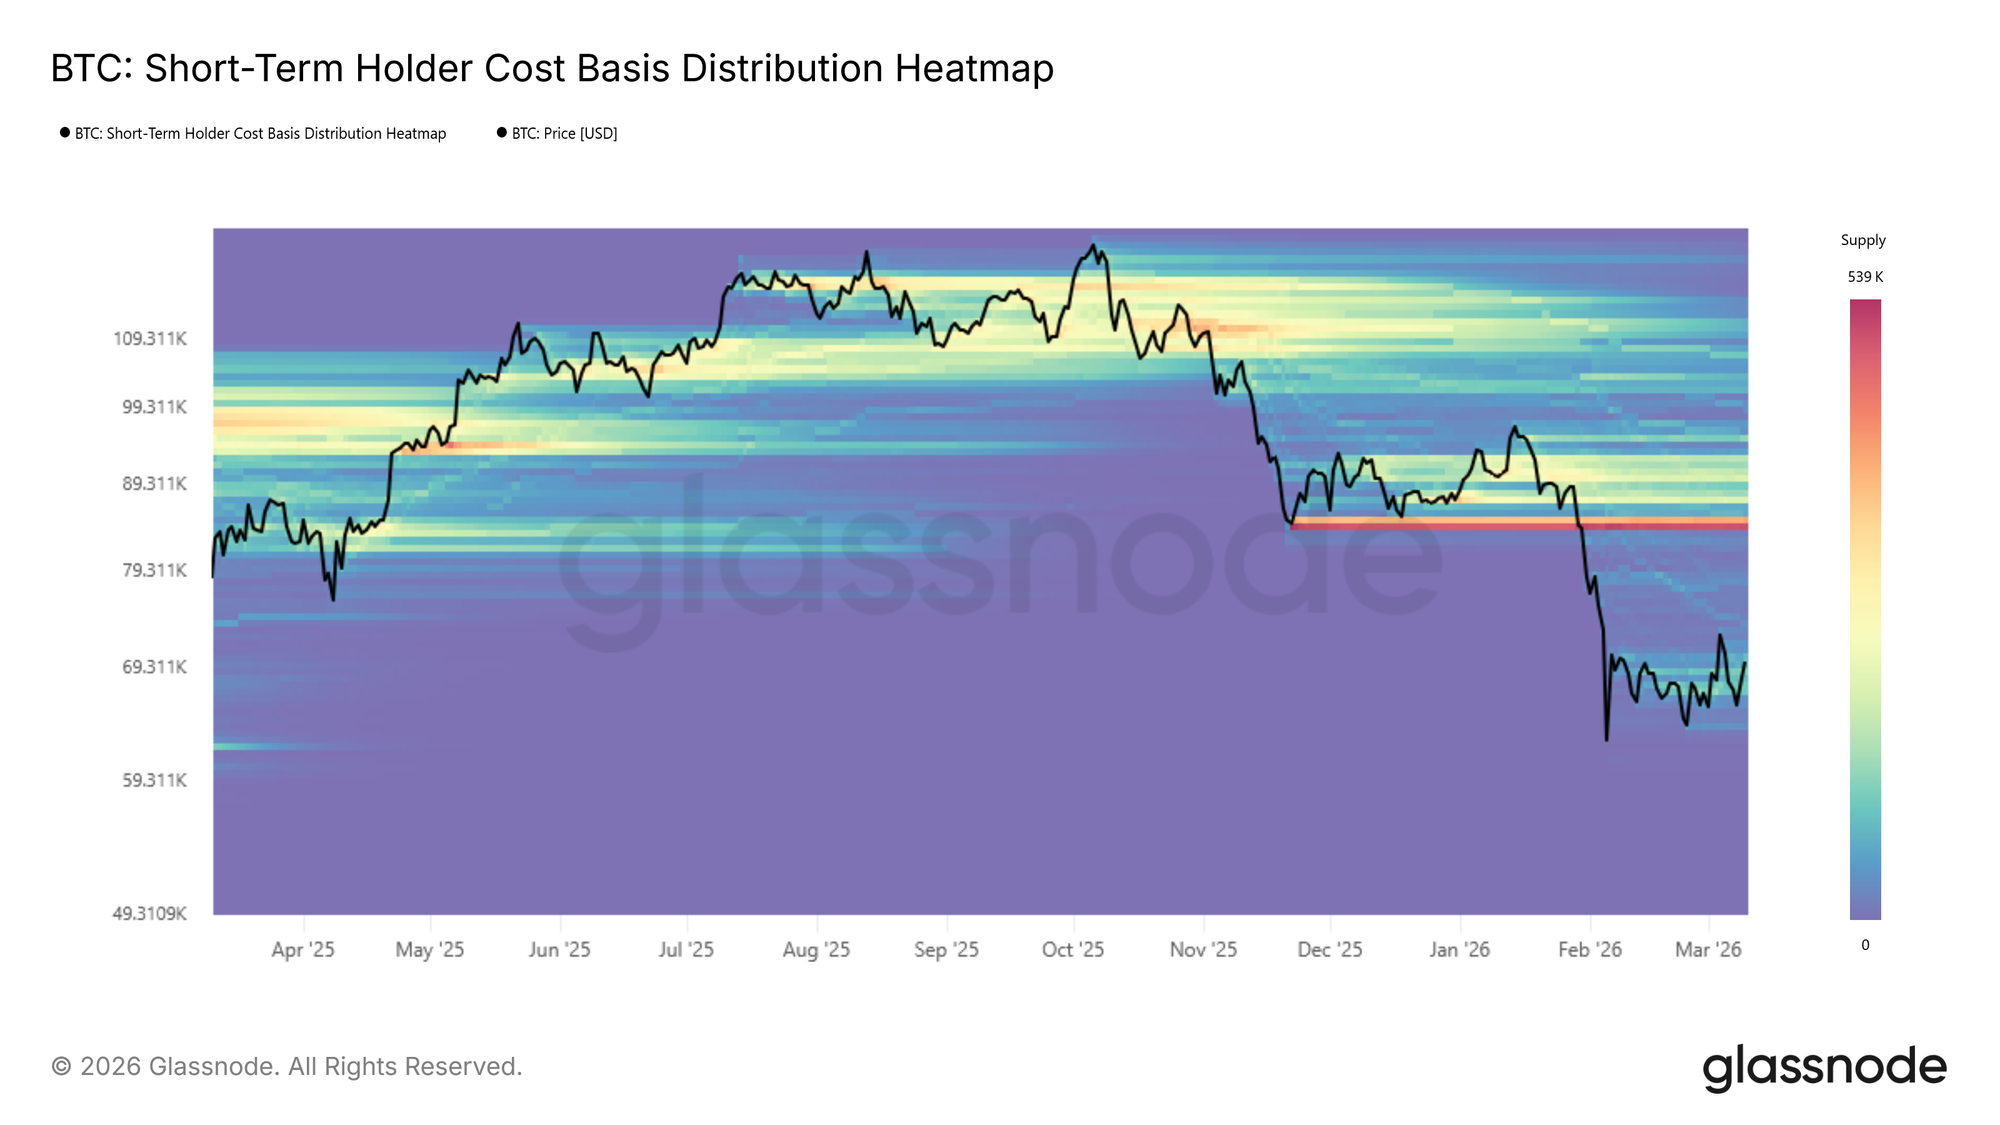
Basándose en la estabilidad observada alrededor del punto medio del rango entre el Precio Realizado y la Media Verdadera del Mercado, un clúster de acumulación on-chain está comenzando a tomar forma. Utilizando el Mapa de Calor de Distribución de Coste Base, los clústeres de acumulación identifican niveles de precio en los que un volumen significativo de suministro ha cambiado de manos recientemente, sirviendo como un indicador de la convicción de los inversores a corto plazo y la densidad potencial de soporte.
Sin embargo, la intensidad del clúster actual es relativamente modesta en comparación con fases de acumulación anteriores que precedieron a expansiones de precio decisivas. Esos episodios anteriores se caracterizaron por un compromiso de capital más pesado, mientras que el clúster actual refleja un reposicionamiento más tentativo. Por lo tanto, si bien la acumulación emergente presta cierta credibilidad a la tesis del rebote del mercado bajista descrita anteriormente, su falta de intensidad sugiere que la base para una expansión sostenida a medio plazo sigue siendo débil.
Nuevos Inversores Bajo Presión
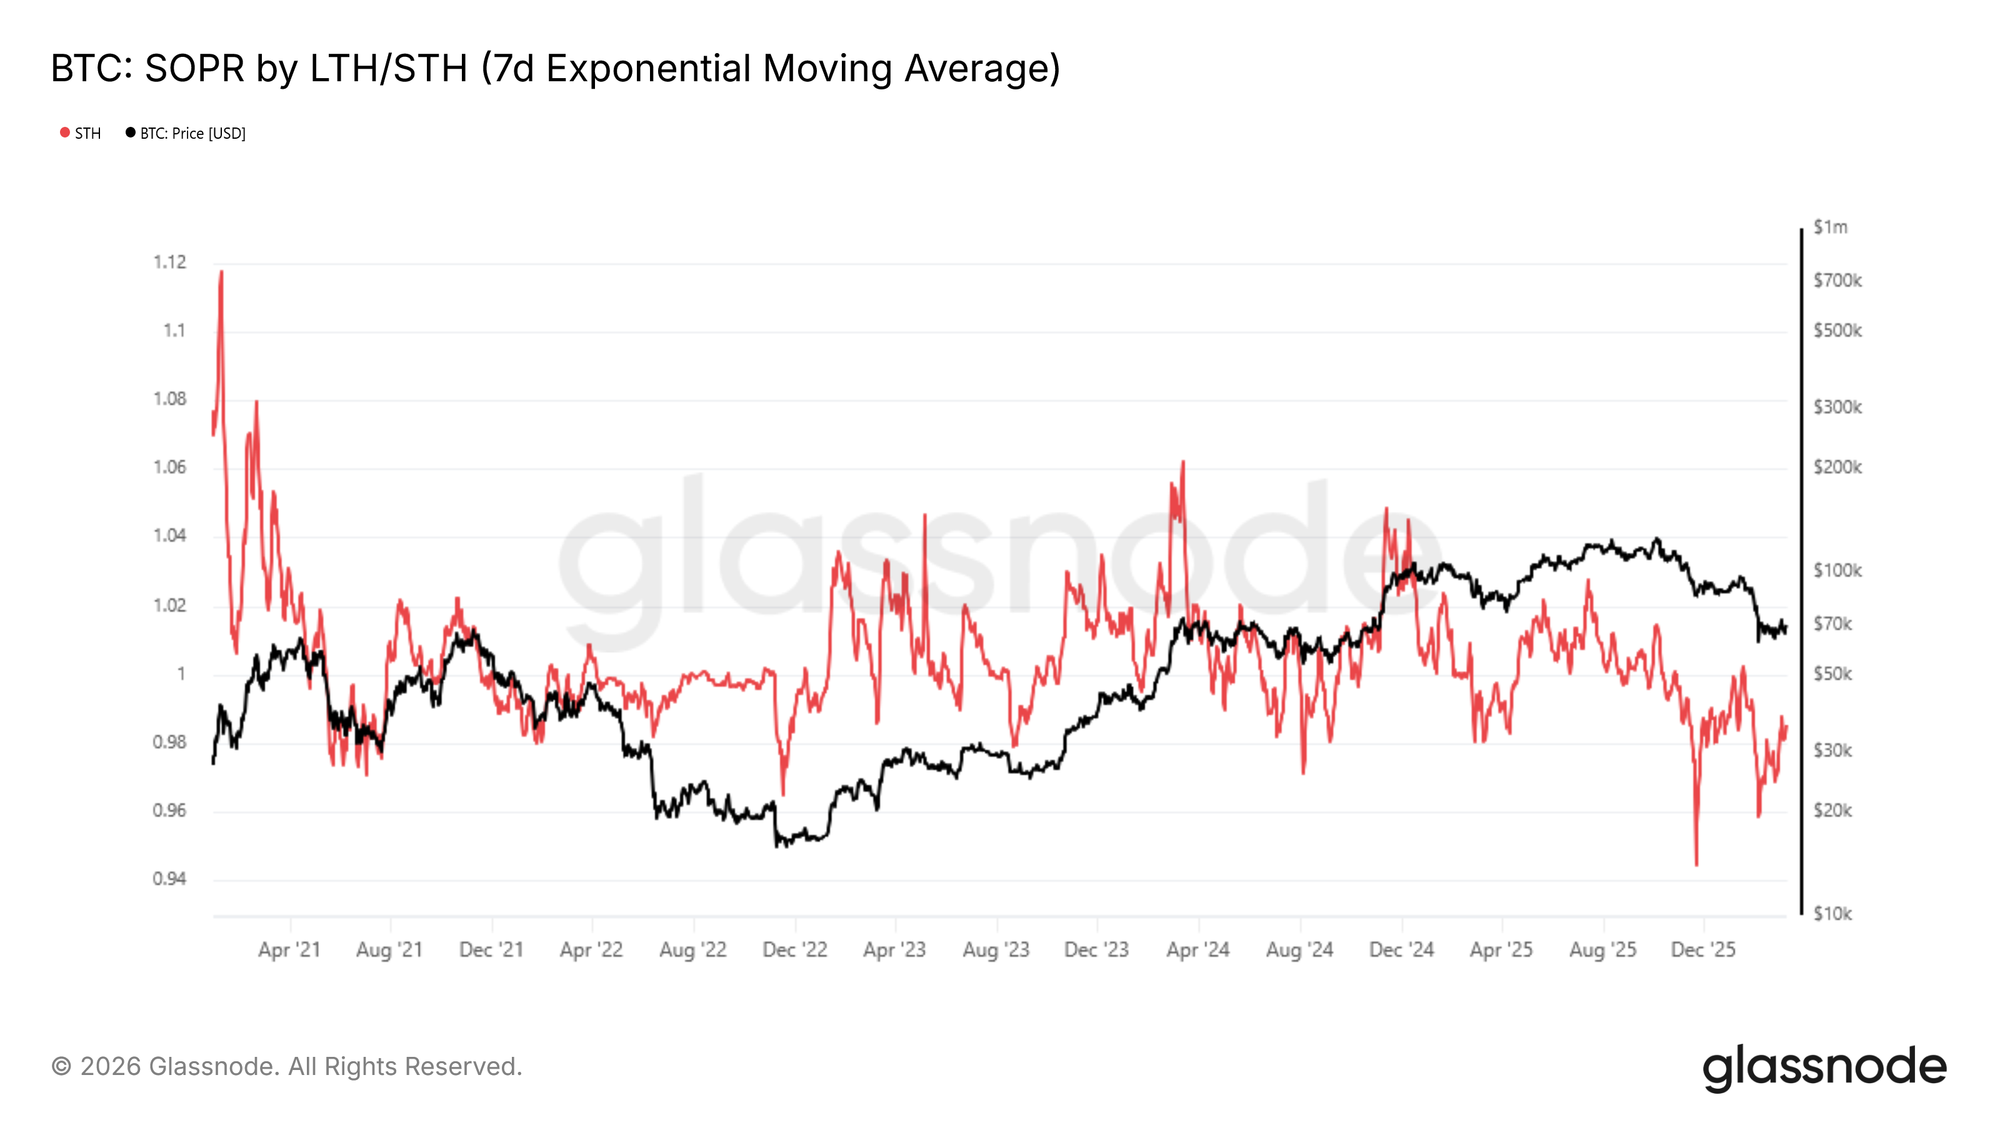
Agravando la señal de acumulación tibia, un lastre clave para el impulso del mercado es la erosión sostenida de la rentabilidad entre los participantes más nuevos del mercado. Esta dinámica es capturada directamente por la Ratio de Beneficio de Salida Gastada de los Tenedores a Corto Plazo (STH-SOPR), que mide la relación entre el precio al que los tenedores a corto plazo adquirieron sus monedas y el precio al que las están gastando. Una lectura por debajo de 1 indica que este grupo, en agregado, está realizando pérdidas.
La media móvil exponencial de 7 días (7D-EMA) del STH-SOPR ha cotizado continuamente por debajo de 1 desde octubre de 2025, y actualmente se sitúa en 0.985, confirmando que los compradores recientes carecen de ganancias no realizadas significativas para desplegar o defender posiciones. Esta es una característica de libro de texto de un régimen de mercado bajista, uno que históricamente requiere un período prolongado de construcción de base antes de que las condiciones se normalicen.
Tácticamente, el STH-SOPR también sirve como un indicador de techo local. Los picos hacia 1 durante los rebotes de alivio tienden a marcar puntos de agotamiento, ya que los compradores recientes aprovechan la oportunidad para salir cerca del punto de equilibrio en lugar de mantener para obtener más ganancias.
Perspectivas Off-Chain
Reaparecen las Entradas de ETF
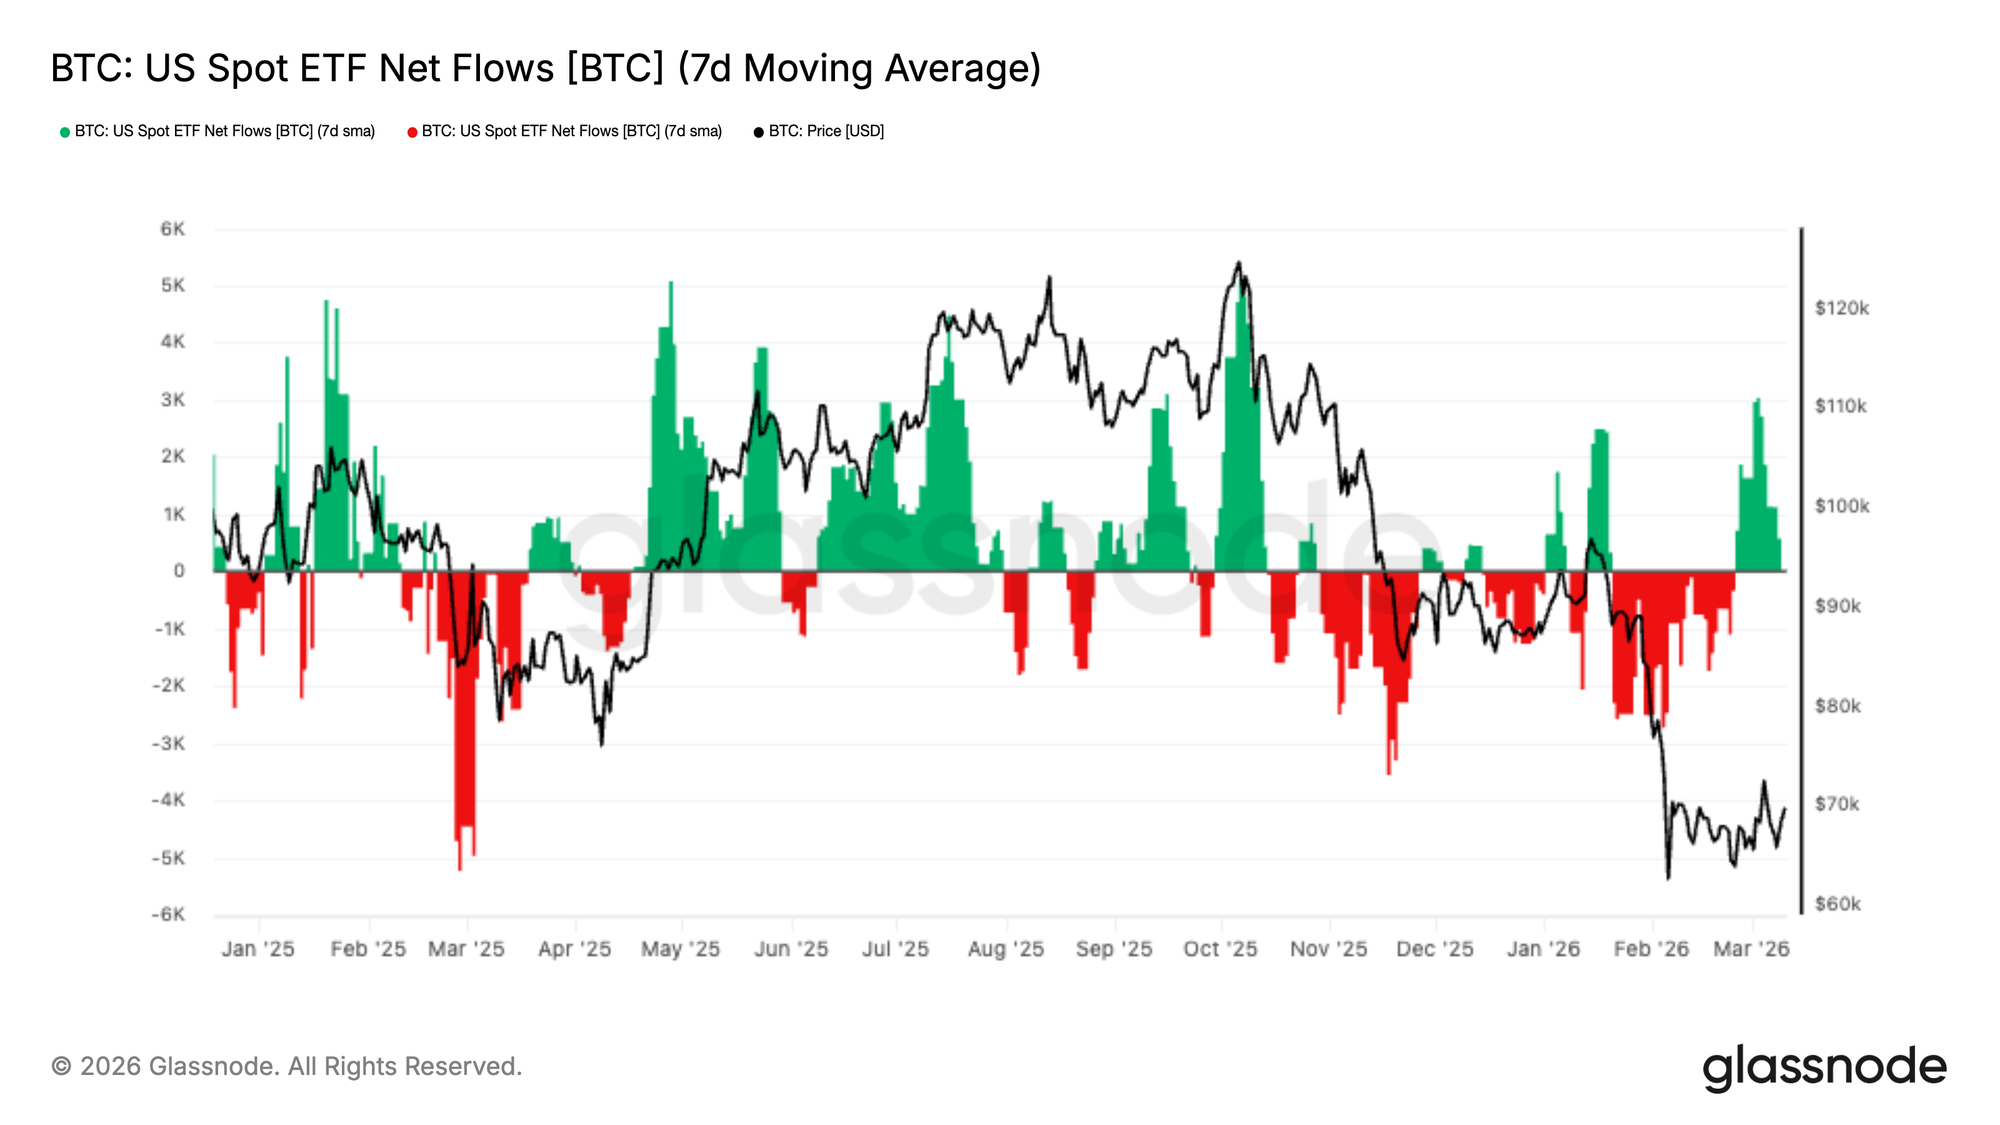
Los ETF de Bitcoin al contado en EE.UU. experimentaron un período sostenido de salidas netas a lo largo de la reciente corrección del mercado, con la media móvil de 7 días permaneciendo negativa a medida que los precios caían hacia la región de $65k. Esta presión de reembolso persistente reflejó una fase de des-riesgo institucional más amplia en los vehículos de inversión regulados.
Sin embargo, durante la última semana, los flujos han cambiado significativamente, con un fuerte estallido de entradas emergiendo y empujando la media de 7 días firmemente de vuelta a territorio positivo. Esto marca el impulso de demanda más significativo desde que comenzó la corrección, lo que sugiere que los compradores institucionales podrían estar entrando a medida que Bitcoin se estabiliza cerca de los mínimos recientes.
Aunque es temprano para confirmar un cambio estructural en la demanda, una continuación de los flujos positivos de los ETF señalaría una mejora en el sentimiento institucional y podría restablecer a los ETF como una fuente importante de apoyo del lado spot para el mercado.
La Demanda Spot se Recupera
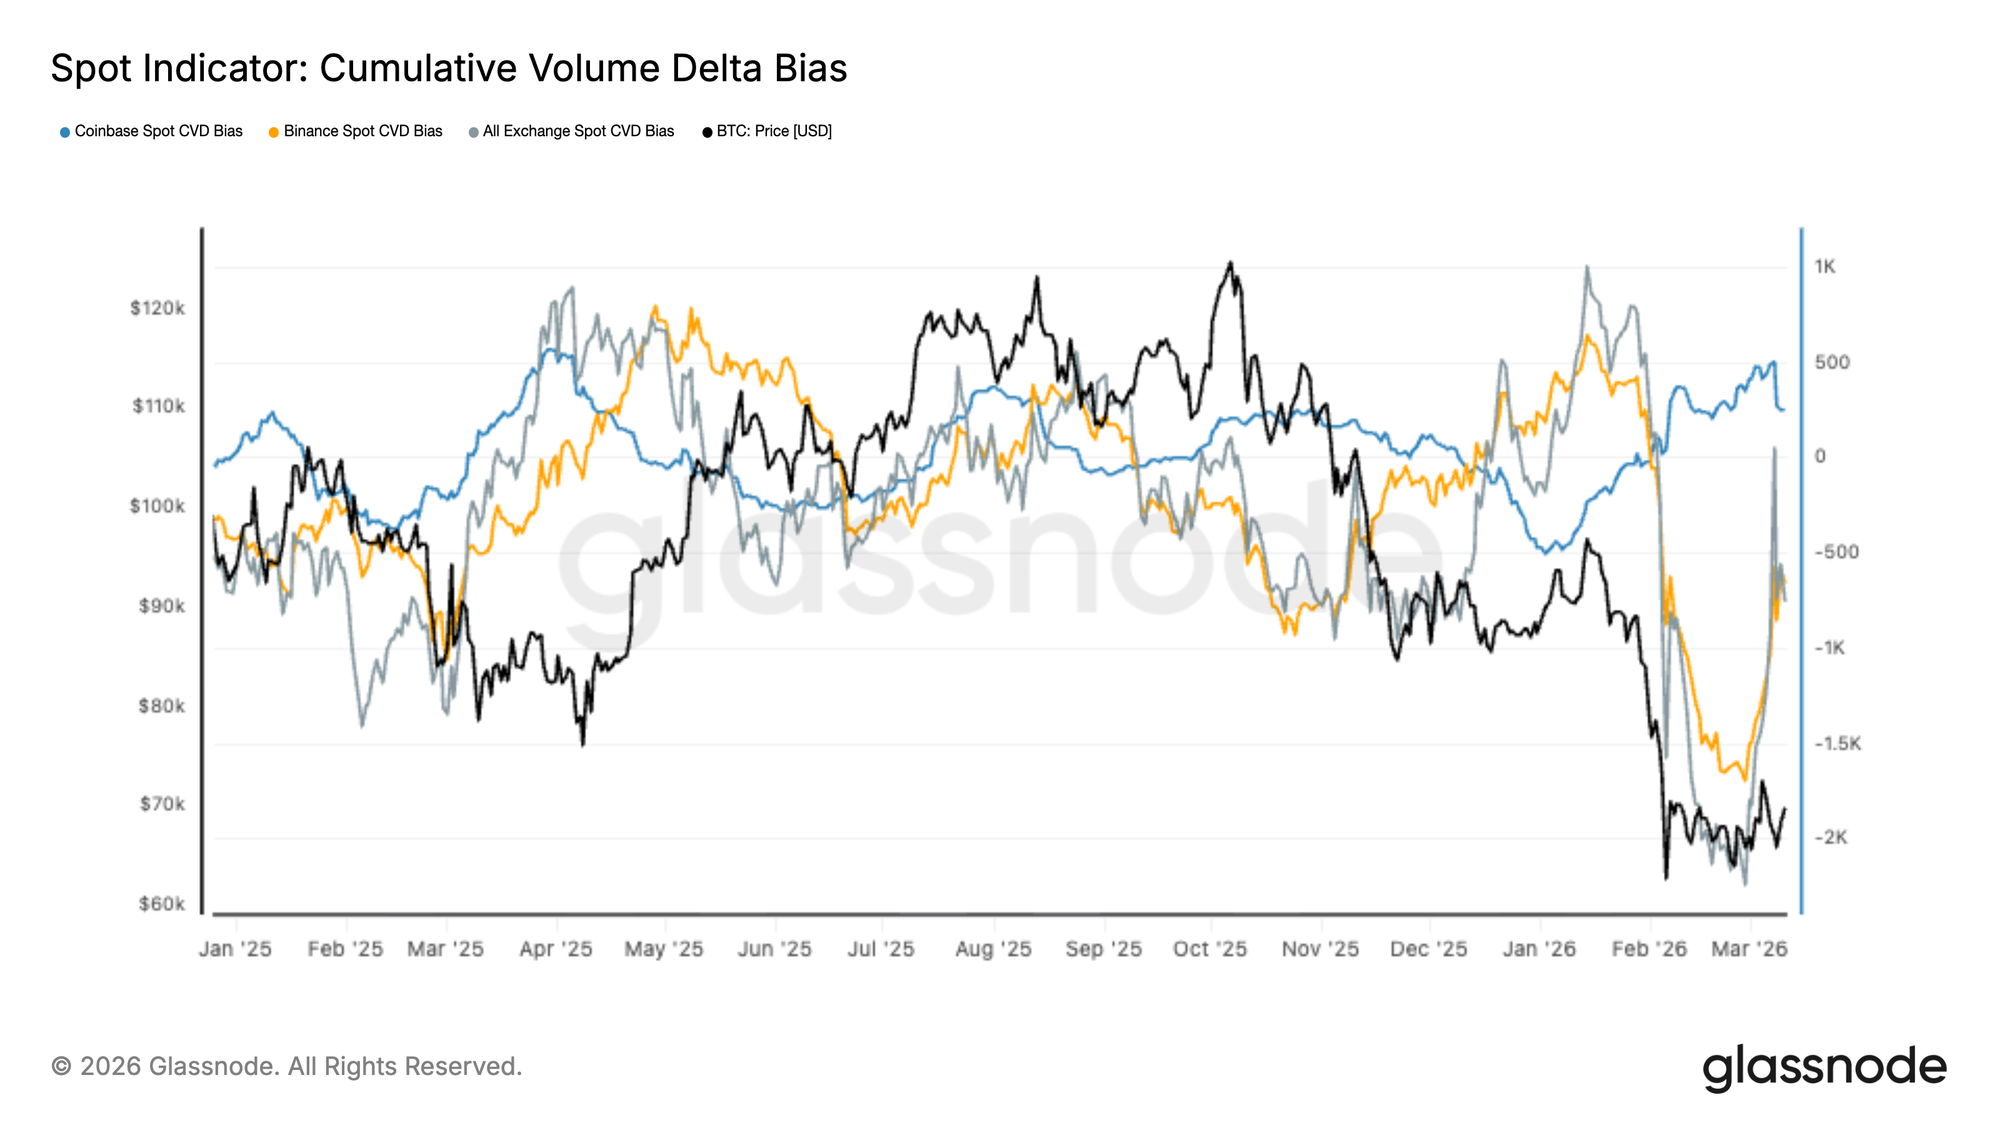
El flujo de órdenes del mercado spot muestra signos tempranos de recuperación tras un período prolongado de presión agresiva del lado vendedor. El delta de volumen acumulado en los principales exchanges cayó bruscamente durante la reciente caída del mercado, con los flujos de Binance y del mercado en general reflejando una presión de venta persistente del mercado a medida que el BTC caía hacia el rango de $60k–$70k.
Sin embargo, en las sesiones recientes, el CVD spot ha comenzado a revertirse al alza, lo que indica que los compradores están empezando a absorber la liquidez del lado vendedor. La recuperación es particularmente visible en los agregados de exchanges globales, lo que sugiere una mejora generalizada en la demanda spot en lugar de una actividad aislada de un exchange.
Aunque este cambio apunta a una potencial estabilización en las condiciones del mercado spot, se requerirá un dominio sostenido de los compradores para confirmar que la demanda es lo suficientemente fuerte como para apoyar una recuperación duradera del precio.
El Funding se Vuelve Negativo a Medida que Aumenta el Posicionamiento Corto
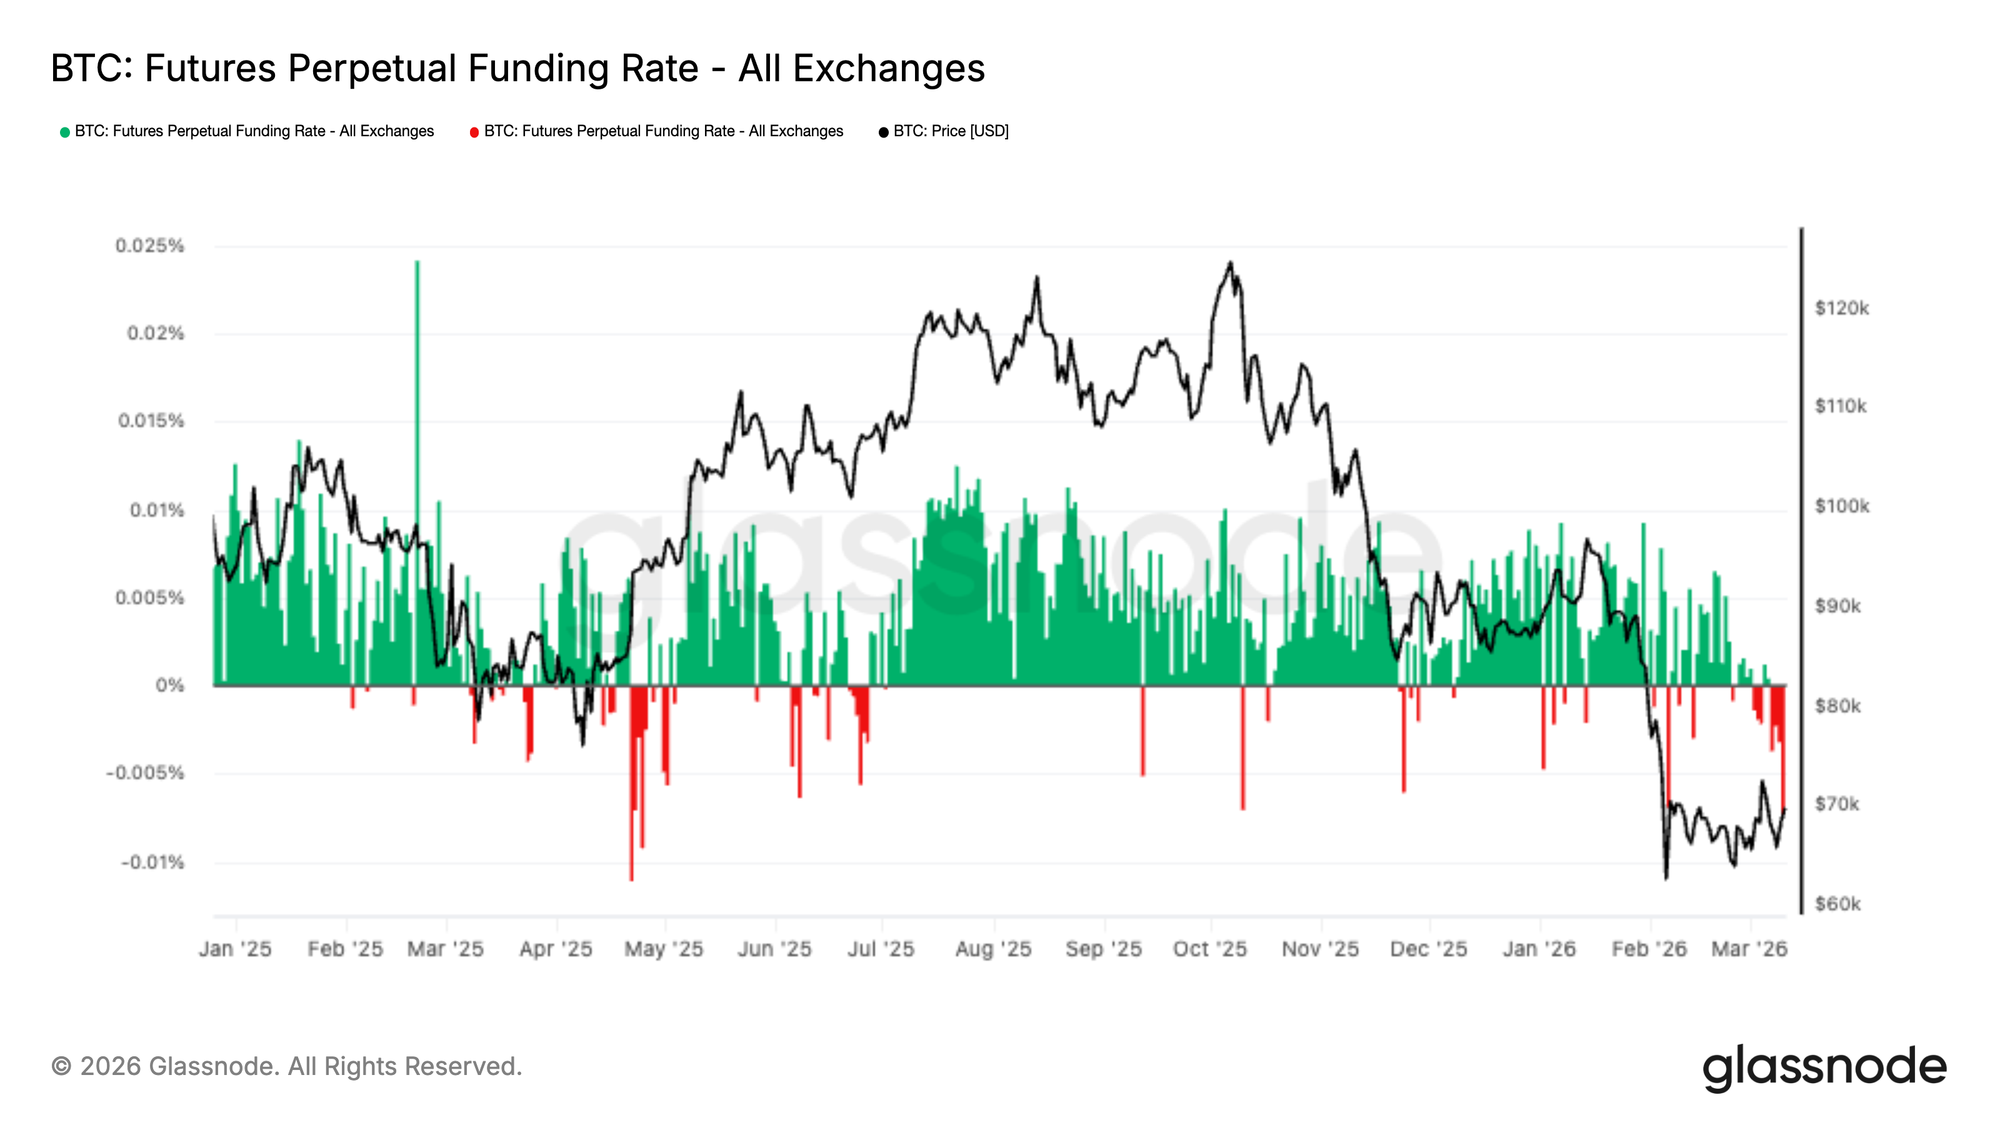
Las tasas de funding de los futuros perpetuos han cambiado decisivamente a negativo en las sesiones recientes, reflejando una creciente dominancia del posicionamiento corto en los mercados de derivados. Este cambio se produce mientras Bitcoin cotiza cerca del extremo inferior de su rango reciente tras la fuerte caída hacia la región de $60k–$70k.
Un funding negativo indica que los vendedores en corto (short sellers) ahora están pagando una prima para mantener sus posiciones, lo que sugiere un consenso creciente en torno a la continuación a la baja. Sin embargo, un posicionamiento corto tan concurrido también puede crear condiciones asimétricas, donde un movimiento brusco al alza obliga a los cortos a cubrirse.
Si la demanda spot continúa recuperándose, la acumulación de exposición corta aumenta el potencial de un squeeze corto (short squeeze), que podría amplificar la volatilidad al alza si las liquidaciones forzadas comienzan a cascadear.
Volatilidad Implícita: La Prima a Corto Plazo Comienza a Ceder
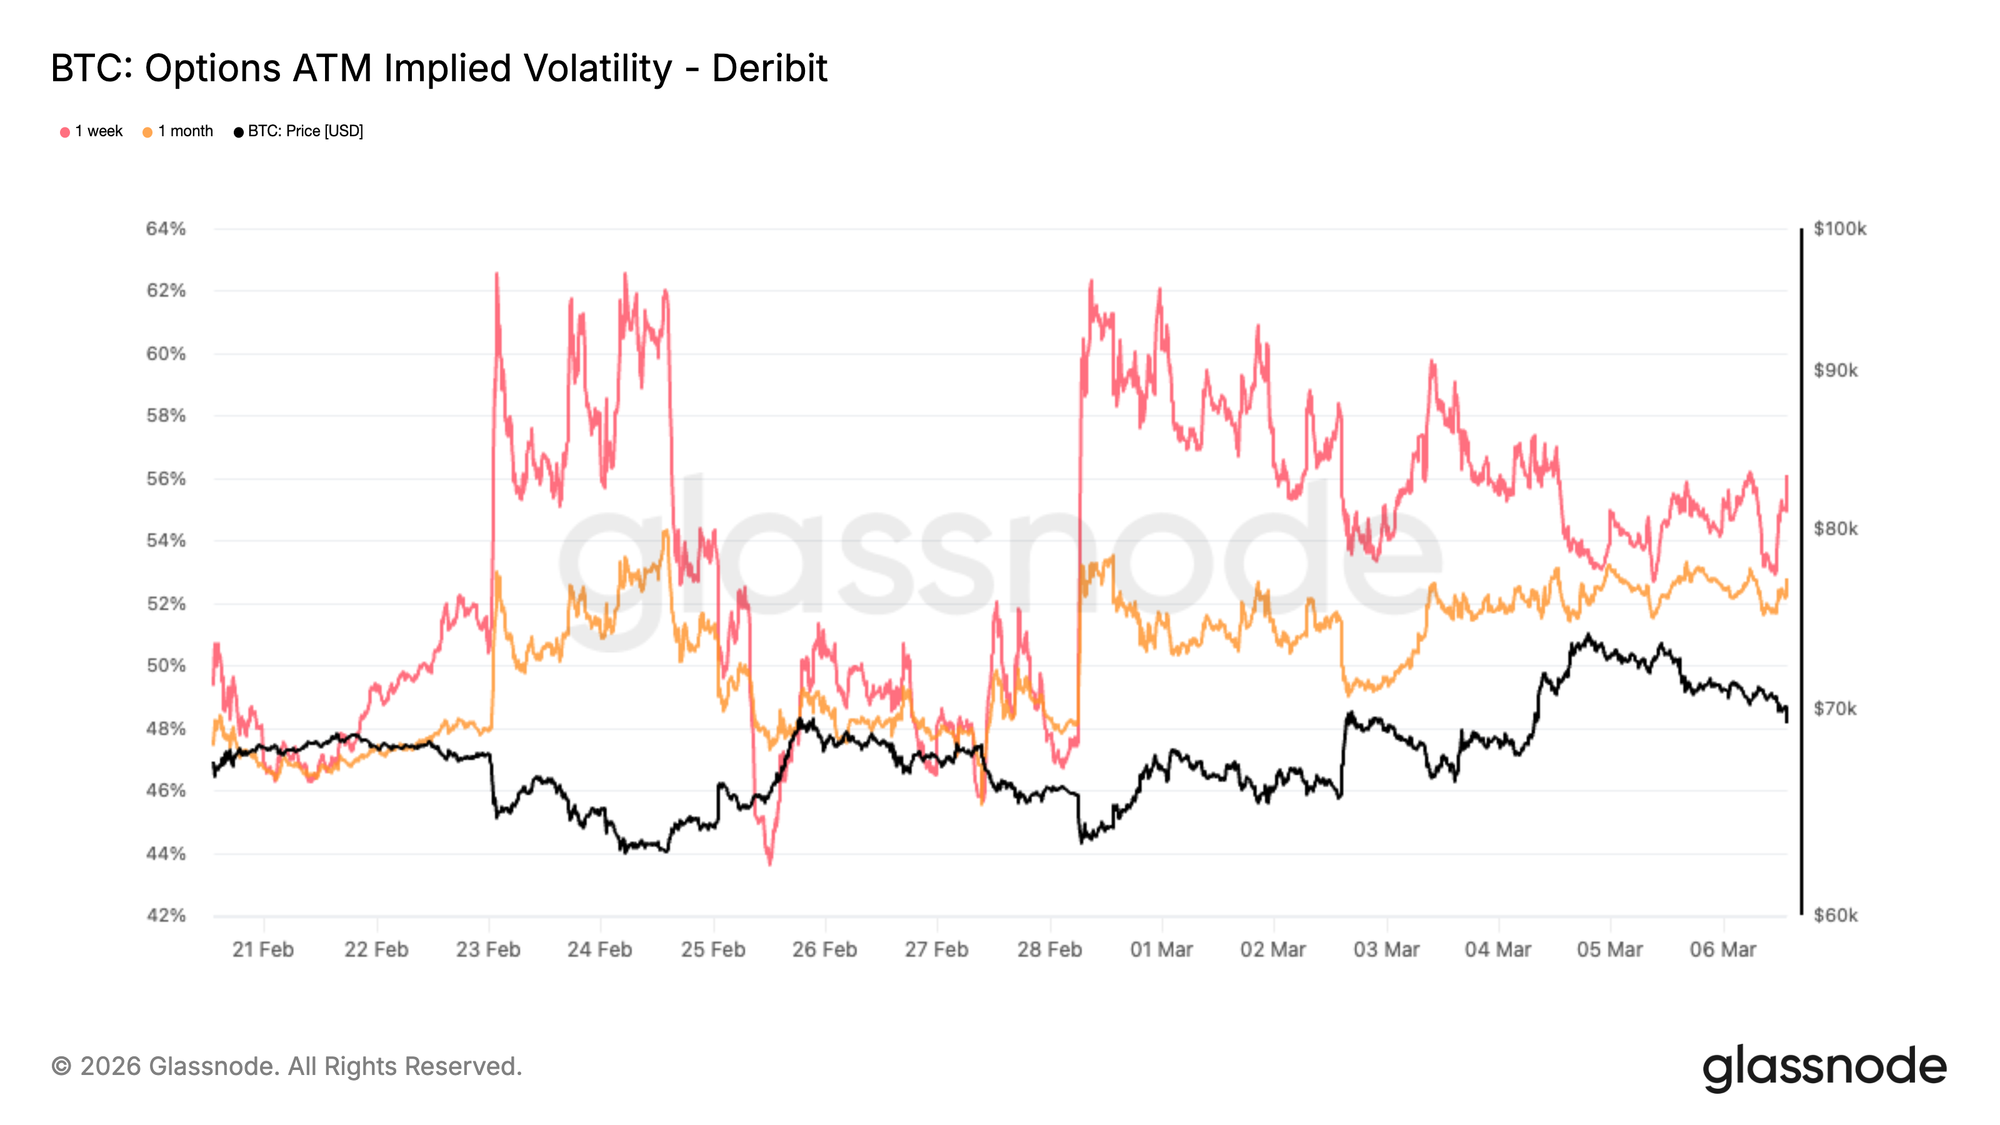
Bitcoin se ha mantenido sorprendentemente resiliente tras el reciente shock geopolítico. Esa resiliencia ahora se refleja en el mercado de opciones, donde la volatilidad implícita a corto plazo ha comenzado a ceder.
Durante la última semana, la caída ha sido más visible en el corto plazo de la curva, con la volatilidad implícita a corto plazo cayendo de vuelta hacia el área del 50 y pico por ciento. La volatilidad implícita representa el precio que los traders están dispuestos a pagar por la opcionalidad. Cuando la incertidumbre se dispara, la protección se vuelve cara. El reciente movimiento a la baja sugiere que el mercado ve menos riesgo de evento inmediato del que veía a principios de semana.
El gráfico muestra que la volatilidad a corto plazo, representada por el tenor de 1 semana, se está comprimiendo más rápido que los vencimientos más largos, como el de 1 mes, lo que confirma que el riesgo de evento inmediato se está desvaneciendo. Este cambio no significa que la volatilidad se haya normalizado por completo. Los niveles siguen elevados en comparación con los meses recientes, lo que muestra que el mercado todavía está valorando un grado de incertidumbre.
Lo que ha cambiado es la urgencia. Los traders parecen menos concentrados en shocks inmediatos a la baja y se están alejando gradualmente de la cobertura agresiva a corto plazo.
Sesgo de 25 Delta: El Posicionamiento Defensivo Comienza a Ceder
Con la volatilidad enfriándose, el sesgo (skew) ofrece información sobre cómo los traders se están posicionando para el riesgo direccional.
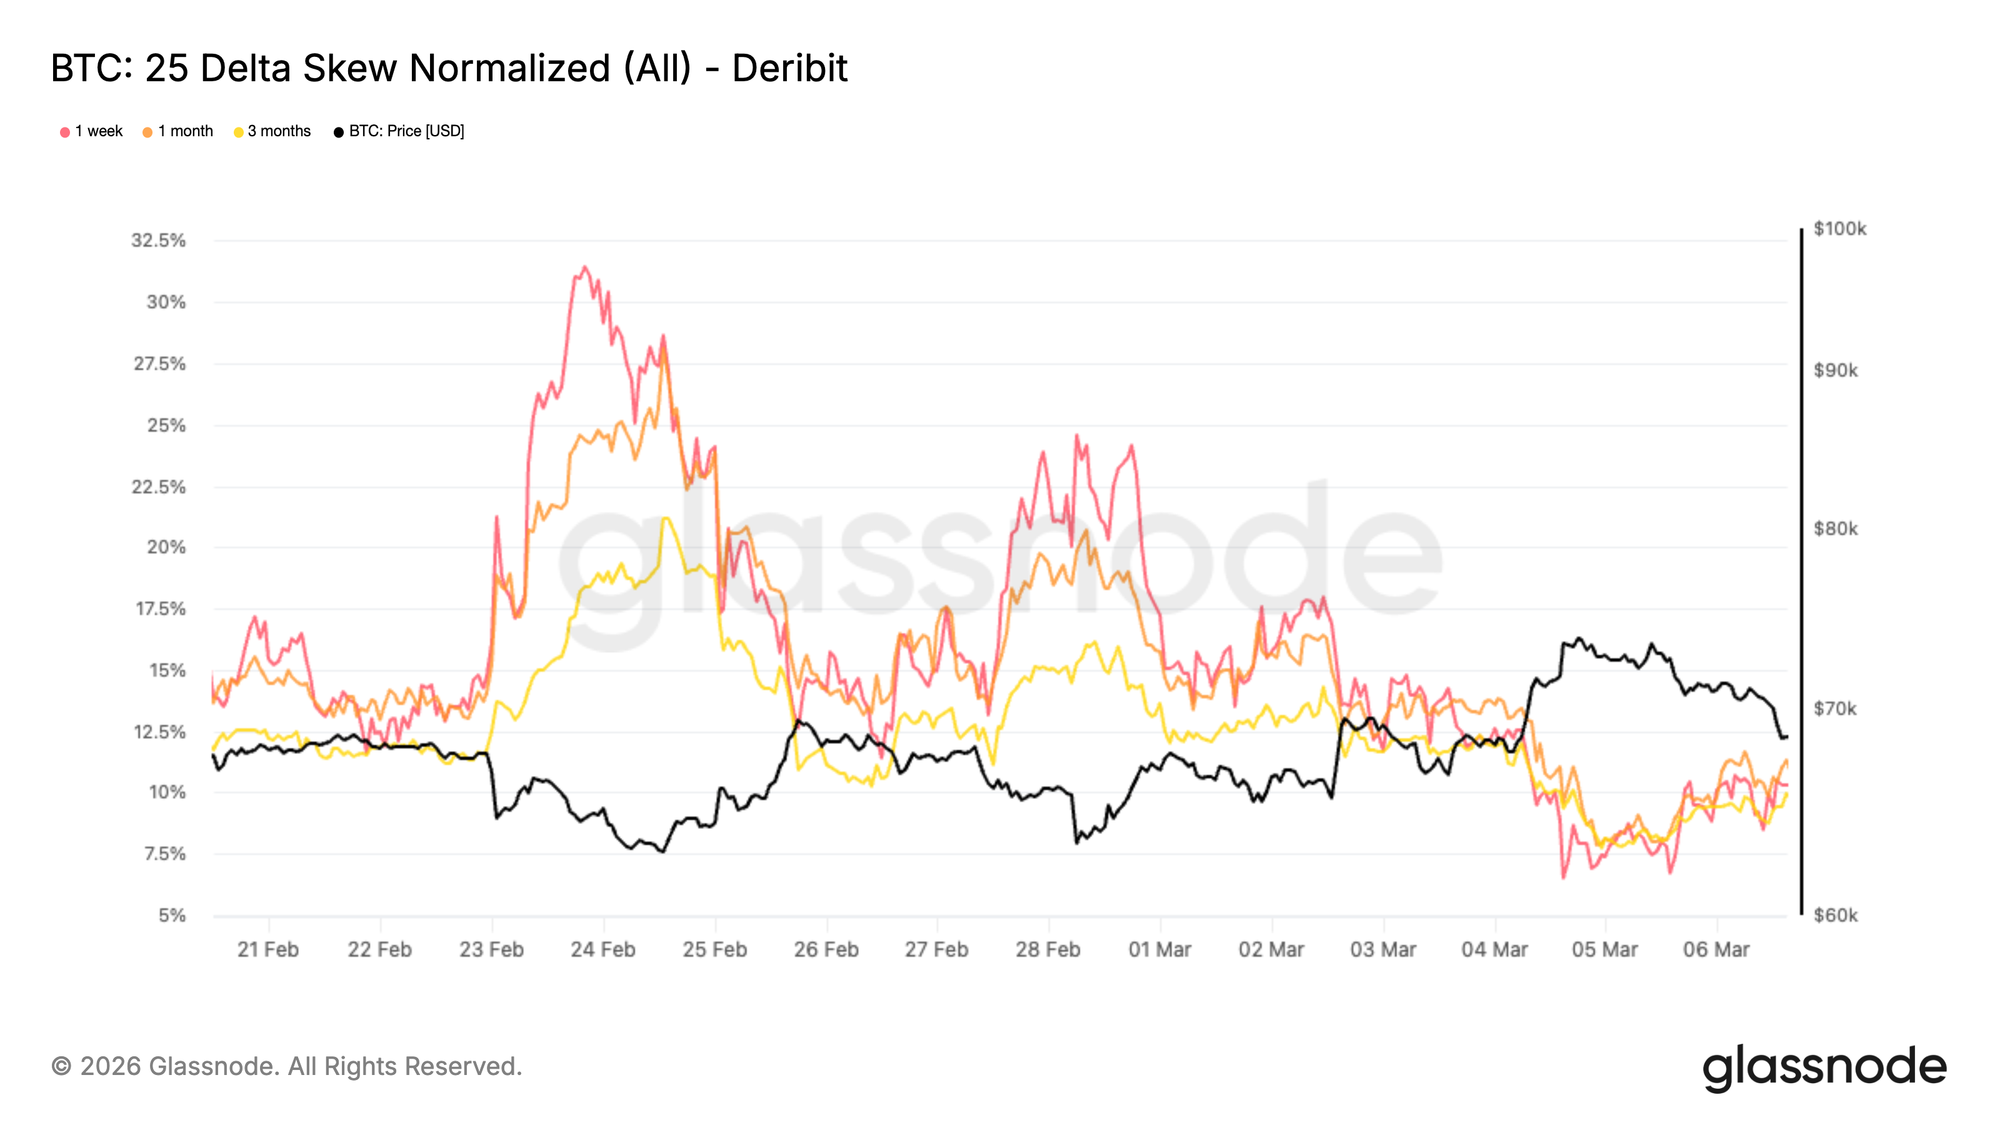
En todos los vencimientos, las reversiones de riesgo de 25 delta permanecen negativas, lo que significa que las opciones de venta (puts) continúan cotizando con una volatilidad implícita más alta que las opciones de compra (calls) comparables. Esto refleja el hecho de que la demanda de protección a la baja todavía está presente en el mercado.
Sin embargo, la magnitud de ese sesgo ha comenzado a comprimirse. En las sesiones pasadas, el sesgo se ha ajustado significativamente, lo que indica que la intensidad del posicionamiento defensivo está comenzando a desvanecerse.
El sesgo esencialmente mide la demanda relativa de protección versus participación. Cuando los traders cubren agresivamente el riesgo a la baja, las puts se vuelven significativamente más caras que las calls. A medida que ese desequilibrio se estrecha, normalmente señala que el mercado se está sintiendo más cómodo tomando exposición direccional nuevamente.
Como se muestra en el gráfico, el sesgo a 1 semana ahora se sitúa alrededor del 10% de sesgo put, por debajo del máximo reciente del 31% alcanzado el 23 de marzo. Este cambio sugiere que, aunque la cautela permanece, el tono defensivo que dominó durante el shock se está aliviando gradualmente.
Flujo de Opciones: La Exposición Alcista Gana Tracción
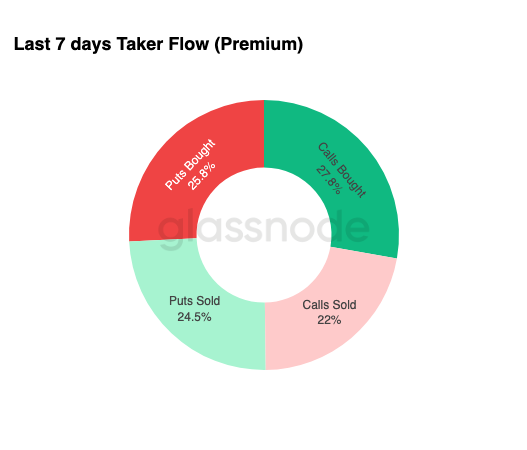
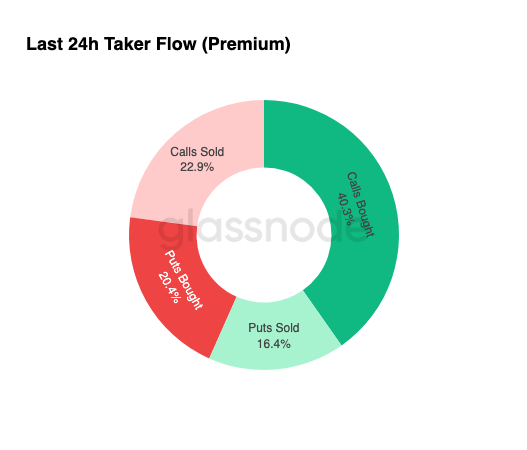
Las transacciones de opciones más grandes observadas en las últimas 24 horas se han concentrado en la compra de calls, representando el 40.3% de la actividad total de opciones. Durante la última semana, la compra de calls ya era el flujo dominante, representando el 27.8% de la actividad de opciones. Esta tendencia se ha acelerado, con la participación de la compra de calls subiendo al 40.3% en las últimas 24 horas.
Las calls proporcionan exposición a movimientos alcistas mientras limitan el riesgo a la baja, lo que las convierte en un instrumento común para posicionarse durante las primeras etapas de una recuperación.
Lo que hace que la configuración actual sea particularmente interesante es el contraste entre el flujo y la fijación de precios. El sesgo sigue siendo negativo, lo que significa que la protección a la baja sigue siendo relativamente cara, sin embargo, los traders están acumulando cada vez más exposición alcista a través de calls.
Este patrón suele aparecer cuando el sentimiento comienza a mejorar pero el mercado en general no ha revalorizado completamente el riesgo. Los participantes comienzan a posicionarse para oportunidades alcistas mientras mantienen algunas estructuras defensivas en su lugar.
En lugar de señalar un cambio alcista absoluto, el flujo sugiere una transición gradual, con los traders probando cautelosamente el alza mientras mantienen protección contra riesgos potenciales a la baja.
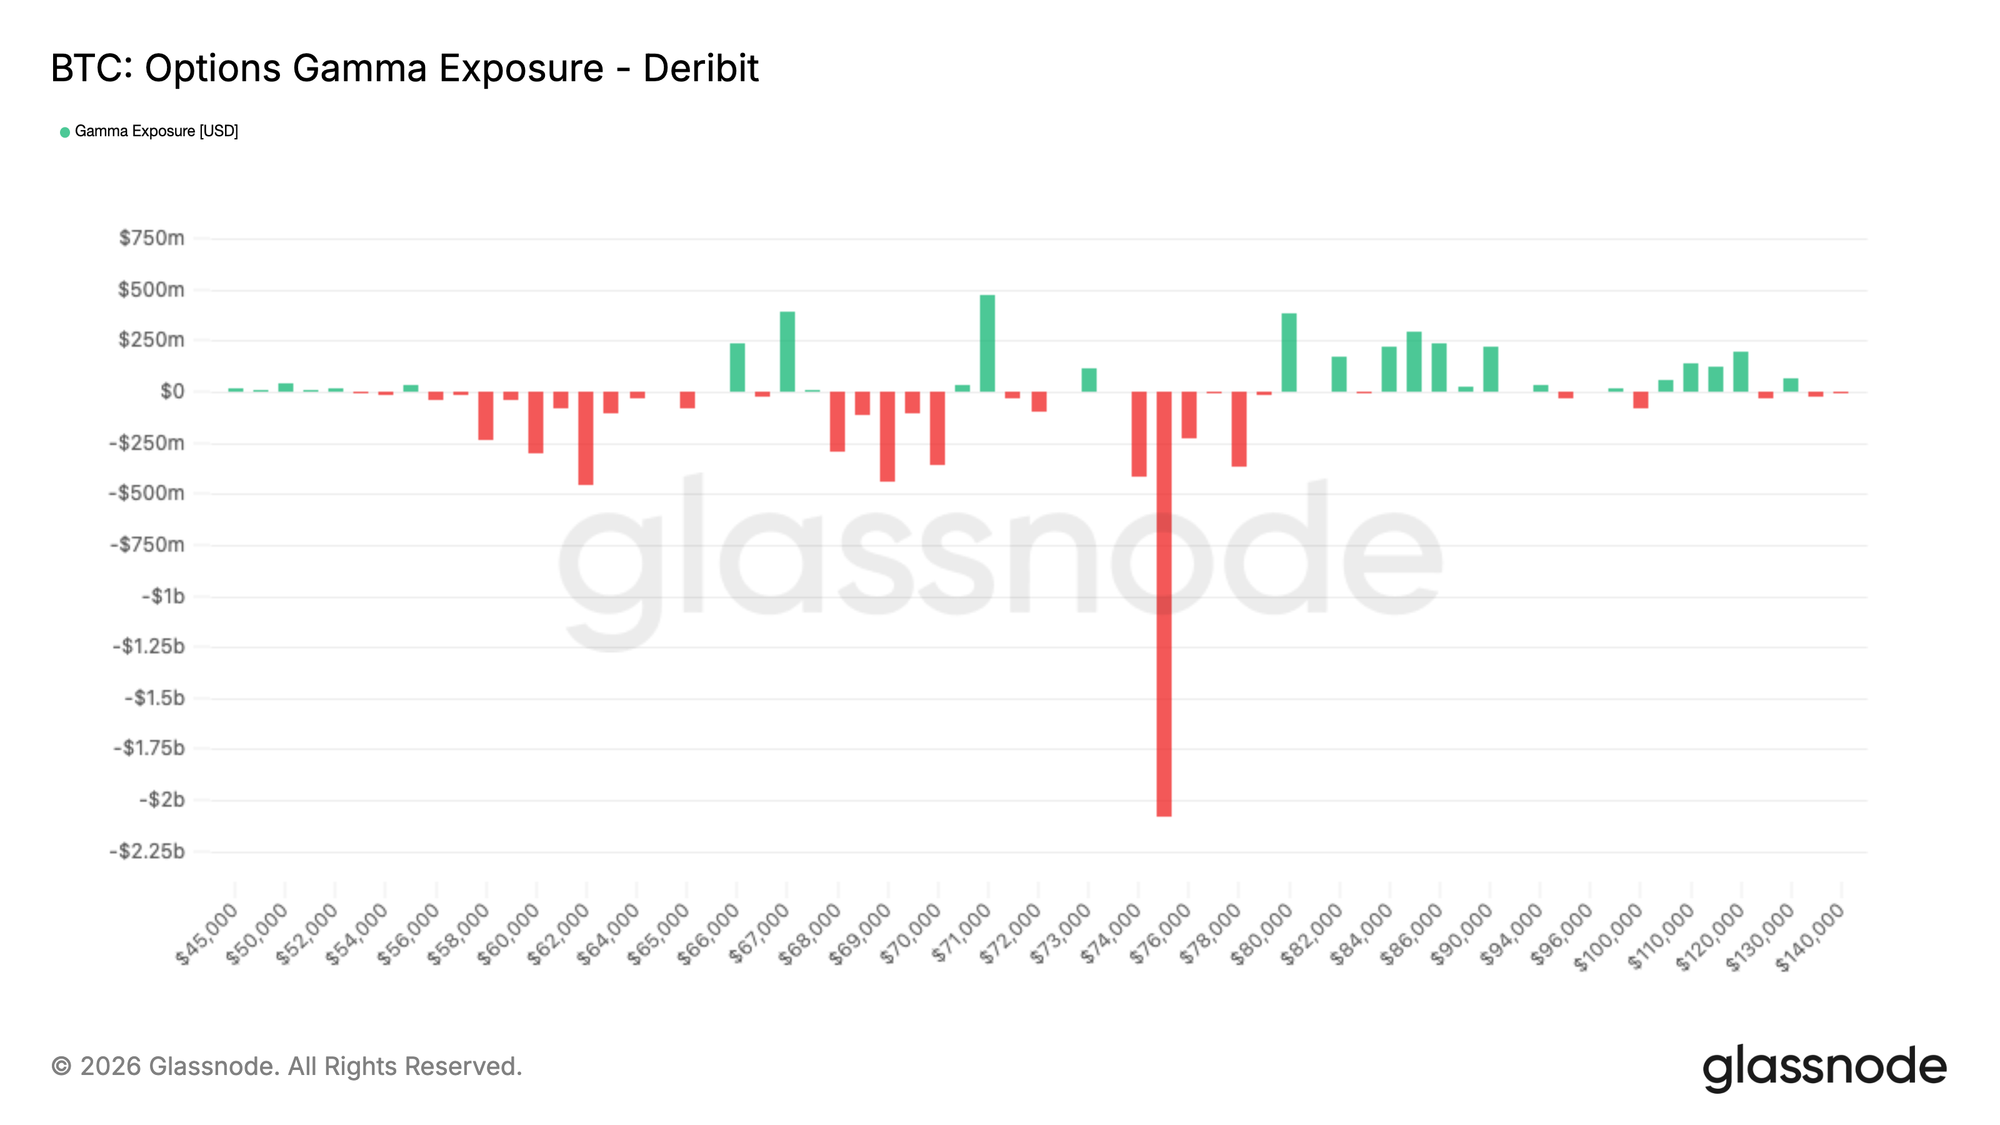
Exposición Gamma: $75K como el Imán Alcista Clave
Con Bitcoin cotizando alrededor de $69.5K en el momento de escribir esto, el spot actualmente se encuentra en un corredor de gamma corto suave entre aproximadamente $67K y $71K. Alrededor de $400 millones de gamma positivo se sitúan a cada lado de este rango, creando niveles cercanos donde la cobertura de los dealers (creadores de mercado) puede estabilizar temporalmente el precio.
Gamma describe cómo reaccionan los flujos de cobertura de los dealers a los cambios de precio. Cuando los dealers mantienen gamma positivo alrededor de un strike, tienden a vender rallies y comprar caídas para mantenerse cubiertos, lo que puede ralentizar los movimientos de precios y crear soporte y resistencia a corto plazo.
Sin embargo, no se necesitaría un volumen significativo para romper cualquier lado de este corredor. El nivel más importante se encuentra más alto.
Alrededor del strike de $75K, se concentran aproximadamente $2 mil millones de gamma negativo. En una zona de gamma corto, los flujos de cobertura de los dealers refuerzan el movimiento. Si el precio empuja hacia esa región, la actividad de cobertura puede acelerar el movimiento al alza hacia el área de $80K.
Cabe destacar que alrededor de $1.8 mil millones de este posicionamiento expiran el 27 de marzo, el final de la expiración del Q1, lo que significa que el panorama gamma podría cambiar significativamente una vez que estas opciones caduquen.
Conclusión
Bitcoin sigue bajo presión, pero varias señales sugieren que el mercado podría estar entrando en una fase más estabilizada. La oferta ilíquida continúa expandiéndose, apuntando a una convicción continua entre los tenedores a largo plazo incluso cuando el precio cotiza por debajo de los niveles clave de coste base on-chain.
En los mercados off-chain, las condiciones están comenzando a mejorar. Los flujos de los ETF de Bitcoin al contado en EE.UU. se han vuelto positivos después de un régimen prolongado de salidas, y el CVD spot está comenzando a recuperarse, lo que indica que los compradores están comenzando a re-engancharse. Al mismo tiempo, el funding perpetuo se ha movido a negativo, reflejando un posicionamiento corto cada vez más concurrido que podría amplificar el alza si la demanda continúa fortaleciéndose.
Los mercados de opciones añaden a esta imagen, con la volatilidad implícita a corto plazo comprimiéndose a medida que los traders reducen la demanda de cobertura a corto plazo. El sesgo delta permanece relativamente equilibrado, mientras que el posicionamiento gamma de los dealers parece ampliamente neutral, lo que sugiere que los mercados de opciones ya no están fuertemente sesgados hacia la protección inmediata a la baja.
En conjunto, el mercado parece estar cambiando de una desapalancamiento forzado hacia una estabilización temprana, con margen para la recuperación si la demanda spot continúa construyéndose.
Descargo de responsabilidad: Este informe no proporciona ningún consejo de inversión. Todos los datos se proporcionan únicamente con fines informativos y educativos. Ninguna decisión de inversión debe basarse en la información aquí proporcionada, y usted es el único responsable de sus propias decisiones de inversión.
Los saldos de exchange presentados se derivan de la base de datos integral de etiquetas de direcciones de Glassnode, que se acumulan tanto a través de información de exchange publicada oficialmente como de algoritmos de agrupamiento propietarios. Si bien nos esforzamos por garantizar la máxima precisión al representar los saldos de exchange, es importante tener en cuenta que estas cifras podrían no siempre encapsular la totalidad de las reservas de un exchange, particularmente cuando los exchanges se abstienen de divulgar sus direcciones oficiales. Instamos a los usuarios a ejercer precaución y discreción al utilizar estas métricas. Glassnode no se hace responsable de ninguna discrepancia o posible inexactitud.


