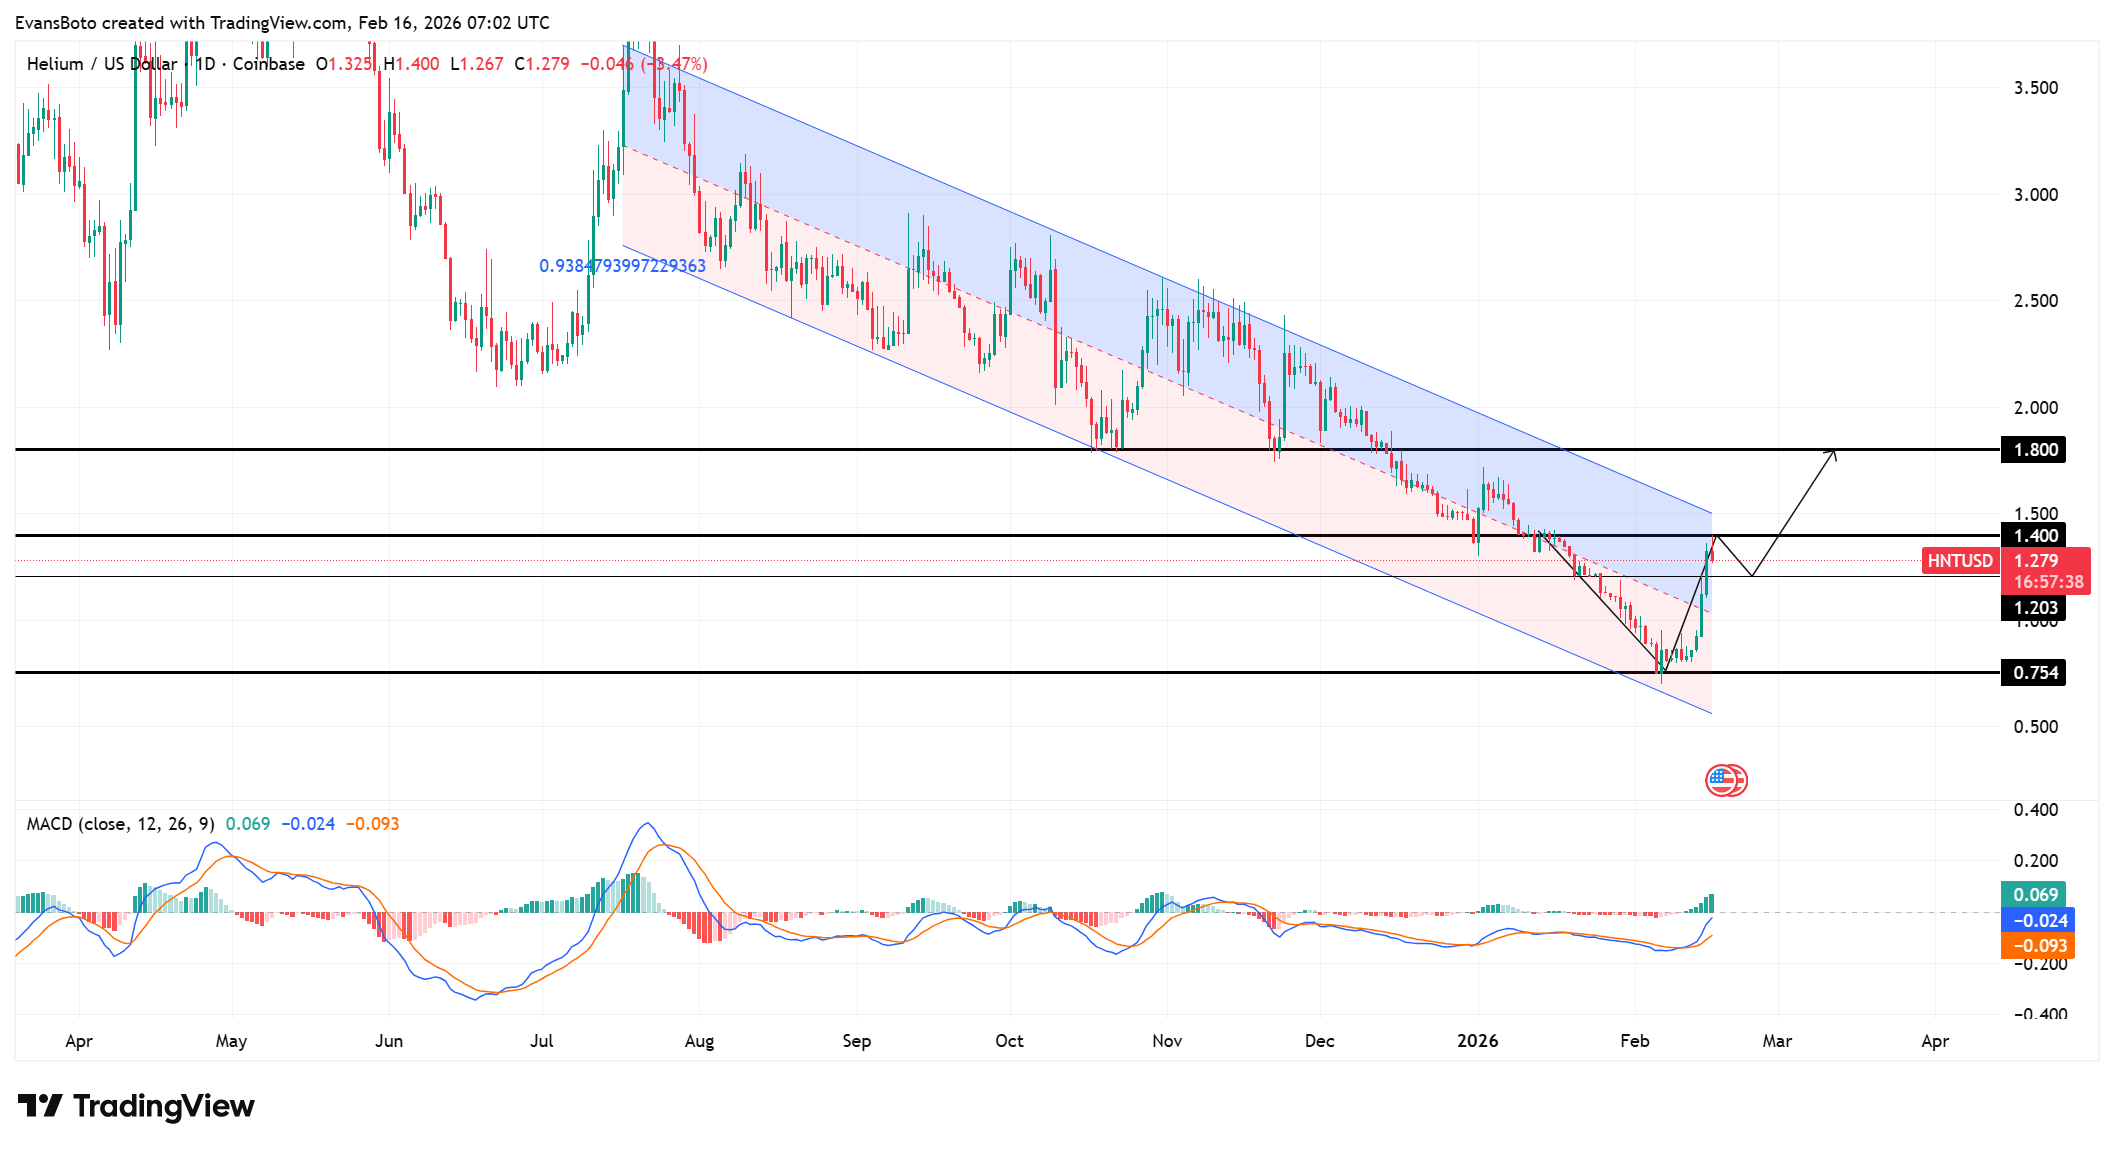
Helium [HNT] ha experimentado una subida de más del 20% hasta los 1,36 dólares, recuperándose con fuerza desde los mínimos del canal de regresión cercanos a 0,75 dólares a medida que los compradores regresan de forma agresiva.
El precio cotiza ahora en torno a 1,27 dólares después de alcanzar 1,40 dólares intradía, marcando su reacción alcista más fuerte en meses.
Esta recuperación surgió precisamente desde el límite inferior de un canal de tendencia de regresión descendente que ha guiado la caída general desde mediados de 2025.
Sin embargo, HNT se acerca ahora al límite superior del canal, donde los rallies anteriores se estancaron.
Al mismo tiempo, la presión estructural de venta aún persiste bajo la superficie, creando tensión entre la recuperación del precio y el flujo subyacente.
Helium prueba el canal de regresión superior
HNT ha recuperado el nivel de 1,20 dólares y se ha adentrado en la zona de oferta de 1,40 dólares, marcando un cambio estructural decisivo a corto plazo.
El precio se sitúa ahora cerca del límite superior de un canal de tendencia de regresión descendente que ha guiado la caída general durante meses.
Este límite se alinea estrechamente con la región de 1,50 dólares, mientras que una resistencia horizontal más fuerte se encuentra en 1,80 dólares. Por lo tanto, el precio se enfrenta a una presión superpuesta en una zona técnicamente sensible.
Una mantención sostenida por encima de 1,40 dólares podría abrir camino hacia 1,80 dólares. Sin embargo, un rechazo cerca del techo del canal reforzaría la tendencia bajista predominante.
Al mismo tiempo, el MACD marca 0,069, con la línea de señal en -0,024 y el histograma volviéndose positivo. Las barras verdes ahora se expanden después de una compresión prolongada, mostrando un fortalecimiento de la energía alcista.
Sin embargo, el indicador aún ronda territorio neutral. Los compradores deben mantener el seguimiento para validar este intento de ruptura.

La presión de venta persiste bajo el rally
A pesar de la fuerte recuperación desde 0,75 dólares, el Spot Taker CVD de 90 días aún refleja el dominio de los vendedores (taker sell).
Esta lectura muestra que las ventas agresivas del mercado continúan superando a las compras en base acumulativa. Esto crea una divergencia entre el precio en alza y el flujo persistente del lado de la venta.
En otras palabras, el precio sube incluso mientras la agresión spot más amplia favorece a los vendedores. Tal divergencia puede debilitar los rallies si la demanda no logra absorber completamente la oferta.
Sin embargo, las recuperaciones técnicas rápidas a veces se desarrollan en condiciones similares cuando los compradores a corto plazo abruman la liquidez temporalmente.
Si los compradores spot aumentan su convicción, la tendencia del CVD podría estabilizarse y cambiar gradualmente. Hasta que ese cambio aparezca claramente, el rally sigue siendo técnicamente impresionante pero estructuralmente frágil.
La expansión del Interés Abierto refleja nuevas posiciones
El Interés Abierto ha aumentado un 22,83% hasta 4,40 millones de dólares durante esta subida. Esa expansión señala que los traders están abriendo posiciones nuevas en lugar de merely cerrar cortos.
Si el cierre de cortos (short covering) impulsara solo este rally, el Interés Abierto probablemente disminuiría. En cambio, los traders de derivados ahora se posicionan agresivamente en los niveles actuales.
Un Interés Abierto en aumento junto con un precio en avance puede apoyar la continuación si los compradores mantienen el control.
Sin embargo, el apalancamiento también aumenta el riesgo a la baja cerca de las zonas de resistencia. Si el precio es rechazado cerca de 1,50 dólares o 1,80 dólares, la presión de liquidación podría amplificar la volatilidad rápidamente.
Por lo tanto, el posicionamiento se ha vuelto sensible al comportamiento del precio en el techo del canal de regresión, donde el apalancamiento podría either alimentar la extensión o acelerar la reversión.
Aumento de la participación, confirmado
El Mapa de Burbujas de Volumen Spot ahora muestra clusters que se calientan, reflejando una expansión de la participación spot.
Burbujas más grandes corresponden con una mayor actividad comercial durante esta fase de recuperación. El mayor compromiso apoya el movimiento desde 0,75 dólares hacia la región de 1,40 dólares.
Una participación en aumento a menudo fortalece los intentos de ruptura porque refleja una rotación de liquidez genuina.
Sin embargo, la continuación requiere una actividad sostenida por encima de la resistencia reclaimada. Si el volumen se contrae bruscamente cerca del límite de 1,50 dólares, el entusiasmo comprador podría desvanecerse rápidamente.
Por otro lado, una expansión persistente de burbujas más allá del techo de regresión validaría una reparación estructural de manera más convincente.
Por lo tanto, el flujo de liquidez ahora juega un papel decisivo para determinar si Helium se basa en esta subida o se estanca bajo la oferta superior.
¿Rebote de alivio o cambio estructural?
Helium ha entregado una poderosa recuperación desde los mínimos del canal y ahora desafía el límite superior de su estructura de tendencia de regresión.
Los indicadores técnicos muestran una fuerza que se reconstruye, y la participación se ha expandido. Sin embargo, la presión estructural de venta y la resistencia superior aún dominan el panorama general.
Si el precio mantiene la fuerza por encima de 1,40 dólares y avanza hacia 1,80 dólares con una participación en expansión, la recuperación podría ganar tracción.
Sin embargo, un rechazo en el techo del canal reafirmaría la tendencia bajista predominante. Helium se encuentra ahora en un punto de decisión estructural claro.
Resumen Final
- Helium se recuperó más de un 20% desde los mínimos del canal en 0,75 dólares para probar la zona de resistencia de 1,40–1,50 dólares, señalando una fuerte recuperación estructural a corto plazo.
- Sin embargo, el flujo persistente del lado de la venta, el Interés Abierto en aumento y la resistencia superior del canal sugieren que el rally sigue siendo frágil.


