Bitcoin's Short-Term Bear-to-Bull Shift: Will History Repeat Itself? | Invited Analysis

marsbitPublished on 2026-01-19Last updated on 2026-01-19

Abstract

Bitcoin Short-Term Bear-to-Bull Transition: Will History Repeat Itself? Analyst Conaldo reviews Bitcoin's performance from January 12–18, noting a brief bearish signal that resulted in a -1.07% loss on a short trade. Despite this, Bitcoin broke through the key resistance level of $94,500–$95,000, reaching nearly $98,000, confirming a critical technical breakout. Key technical models (Momentum Quantification, Sentiment Quantification, and Price Divergence) indicate mixed signals: weekly charts remain in a downtrend, while daily charts show a rebound with weakening bullish momentum. The 21-week moving average is identified as a crucial level for determining mid-term trend reversal. This week’s outlook focuses on whether Bitcoin can hold above $94.5K. Two short-term strategies are proposed: go long if support holds with a 1.5% stop-loss, or short if it breaks down, targeting $86.5K. A historical comparison with the 2021–2022 cycle suggests that a sustained break above the 21-week MA and a MACD reversal are essential for confirming a true bull trend. Otherwise, a drop below $80,000 remains possible. Risk management is emphasized: set stop-losses immediately, trail profits, and protect capital. All views are based on technical analysis—not financial advice. DYOR.

Odaily invited market analyst Conaldo, a Master of Financial Statistics from Columbia University in the United States, who focused on quantitative trading in US stocks during university and gradually expanded into digital assets such as Bitcoin. He has built a systematic quantitative trading model and risk control system through practical experience; possesses keen data insight into market fluctuations, and is committed to continuous深耕 in the professional trading field, pursuing steady returns; will delve into BTC technical, macro, and capital changes weekly, review and display practical strategies, and preview noteworthy events for reference.

Core Summary of Trading Weekly Report:

• Strategy Execution (Short-term): Last week's trading strictly followed the established strategy, completing one short-term operation (1x leverage), achieving a return of -1.07%. (See Figure 1)

• Core View (Short-term) Validation: The core view proposed last week has been precisely validated by the market. Over the past week, the coin price broke through the important resistance range of $94,500~$95,000 and is currently confirming its validity. The coin price touched $97,963, differing by less than 0.5% from the given lower bound of the resistance zone at $97,500, once again confirming our ability to judge key points.

• Market Outlook for the Coming Weeks: Is Bitcoin about to transition from a bear market to a bull market? Is the current market a rebound or a reversal? The 21-week moving average may become the market's bull-bear dividing line in the future. (Detailed explanation in Figure 4)

The following will review market predictions, strategy execution, and specific trading processes in detail.

I. Bitcoin Market Review Last Week: (01.12~01.18)

1、Last Week's Short-term Operation Review: As shown in (Figure 1)

We strictly followed the trading signals from our self-built spread trading model and momentum quantitative model, combined with predictions of market trends, and completed one short-term operation. This trade resulted in a loss of 1.07%.

Specific trade details and review are as follows:

Bitcoin 30-minute K-line chart: (Momentum Quantitative model + Spread Trading model)
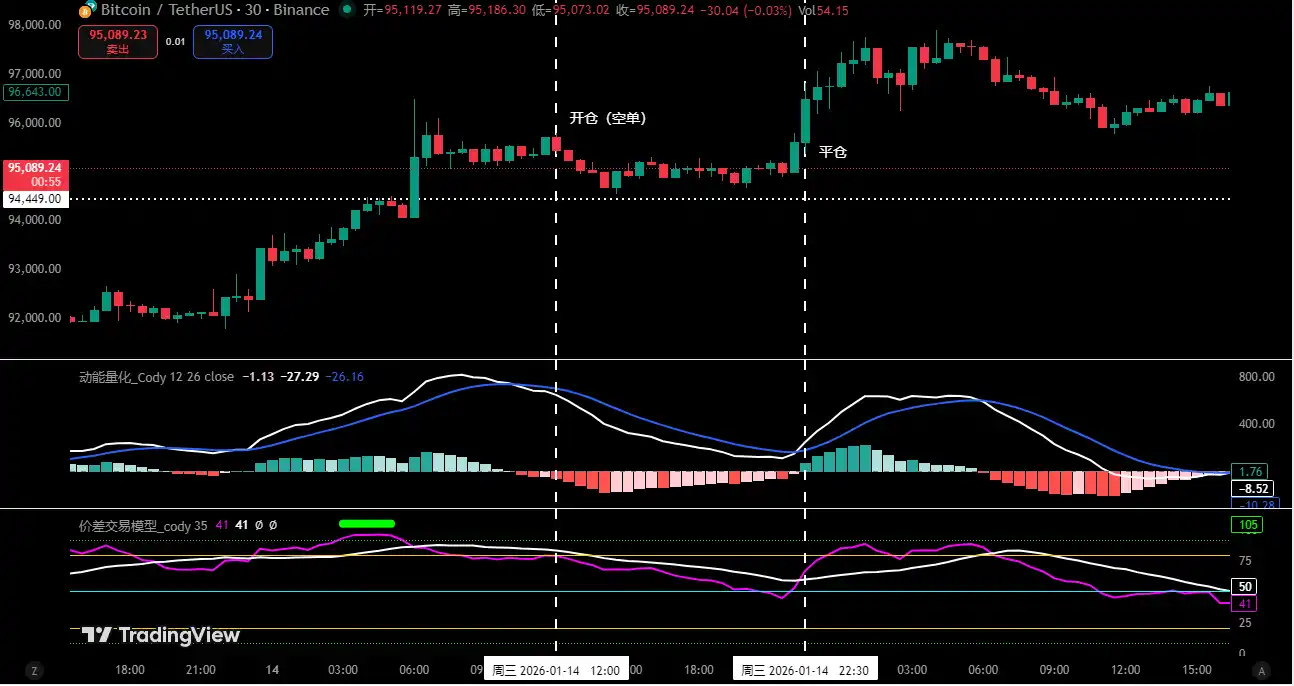
Figure 1

1、Trade Details Summary: (No leverage)

2、Short-term Trade Review:

• First Trade (Loss 1.07%): This operation executed Plan A (Selling Short at Resistance) strategy: When the coin price rose to the key resistance area of $94,500~$95,000 and showed signs of resistance, the spread trading model simultaneously triggered a top signal (green dot), forming a double confirmation. Accordingly, we established a 30% short position at $95,460 as planned; however, the market trend deviated from expectations, finding support near $94,500 and turning upward. When the momentum quantitative model and the spread trading model triggered a bottom signal again, we immediately stopped loss and exited at $96,493. Although this trade resulted in a loss, we strictly adhered to the operational discipline of "trading upon signal trigger, risk control first", achieving unity of knowledge and action.

2、Last Week's Trend Prediction and Operation Strategy Review:

1、Last week clearly stated: Maintain oscillation within the $84,000~$94,500 range, focusing on directional choices and effectiveness at both ends of the range.

2、Key point review: Resistance at $94,500~$95,000 area, important resistance at $97,500~$99,500附近; support at $89,500~$91,000 area.

2、Operation Strategy Review:

• Midline Strategy: If the coin price successfully breaks through and stabilizes above $94,500, close all midline positions (short positions) and hold coins观望.

• Short-term Strategy: If maintaining oscillation in the $84,000~$94,500 range, execute operations according to Plan A:

• Open Position: When rebounding to the $94,500~$95,000 area combined with model top signals, a 30% short position can be established.

• Risk Control: Initial stop loss for short positions set about 1.5% above the cost price (i.e., 1.015*cost price).

• Close Position: When falling near core support levels combined with model signals, gradually close positions to take profits.

II. Analyzing Bitcoin's Trend Structure from a Technical Perspective: Comprehensive Judgment Based on Multiple Models and Dimensions

Combining market movements, the author conducts an in-depth analysis of Bitcoin's trend structure from multiple models and dimensions based on a self-built trading system.

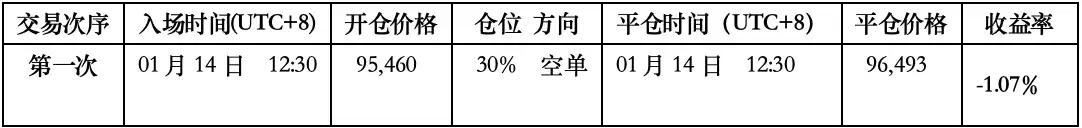
Bitcoin Weekly K-line chart: (Momentum Quantitative Model+Sentiment Quantitative Model)
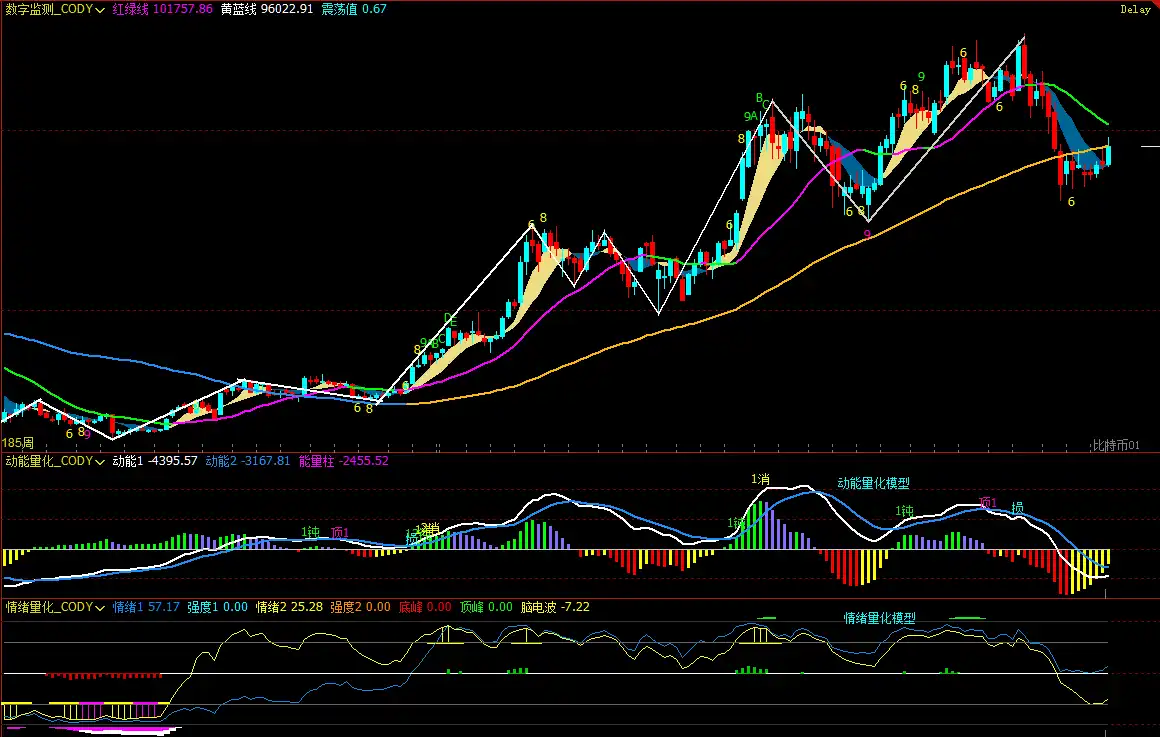
Figure 2

1、As shown in (Figure 2), analysis from the weekly chart:

Momentum Quantitative Model: Technical indicators show, continuing the pattern of previous weeks, the momentum lines are gradually converging, while the negative energy column continues to shrink. However, the current signals do not confirm a reversal of the bearish trend.

Momentum Quantitative Model indicates: Coin price decline index: High

Sentiment Quantitative Model: Blue sentiment line value 57.17, strength zero; yellow sentiment line value 25.28, strength zero, peak value is 0.

Sentiment Quantitative Model indicates: Coin price pressure and support index: Neutral

Digital Monitoring Model: The coin price has been below the bull-bear (yellow-blue line) dividing line for 9 weeks. Last week, the bulls once again冲击 this line, closing near below it.

Digital Monitoring Model indicates: Monitoring (top/bottom) digital signals have not appeared; weekly K-line closed with a medium阳线, gain about 2.92%.

The above data预示: Bitcoin weekly chart bearish trend, be wary of oscillation adjustment risks.

Bitcoin Daily K-line chart: (Momentum Quantitative Model+Sentiment Quantitative Model)
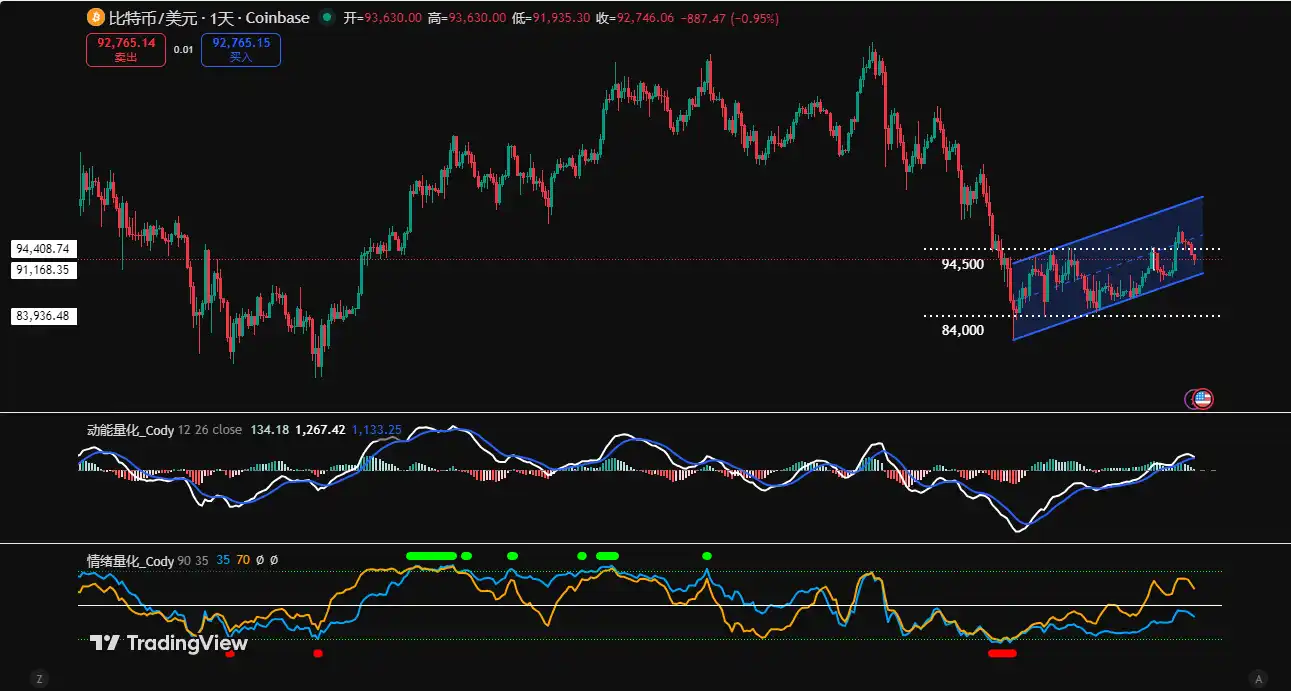
Figure 3

2、As shown in (Figure 3), analysis from the daily chart:

Momentum Quantitative Model: Last week overall showed a "first rise then fall" trend. In the first half of the week, the coin price accelerated its rebound, the momentum line stood above the zero axis, and the positive energy column rapidly expanded; but in the latter half, the energy column明显萎缩, the momentum lines趋于粘合, beginning to slowly approach the zero axis.

Momentum Quantitative Model indicates: Daily chart bullish momentum shows exhaustion, focus on the gain/loss of the zero axis.

Sentiment Quantitative Model: After last week's daily close, blue sentiment line value 38, strength zero; yellow sentiment line value 76, strength zero.

Sentiment Quantitative Model indicates: Pressure and support index: Neutral

The above data提示: Daily level rebound continues, the market initially shows a bullish pattern, but validity needs confirmation. Next, focus on the battle between bulls and bears over the zero axis.

III. This Week's Market Prediction: (01.19~01.25)

1、This Week's Core View: Focus on the gain/loss of the $94,500~$95,000 area.

Resistance Effective: If the coin price rebounds to this area and confirms resistance, it is expected to maintain oscillation within the $84,000~$94,500 range, with the subsequent first test target at the $89,500~$91,000 area.

Effectively Stabilized: If it can strongly stabilize above this area, the coin price is expected to oscillate and rebound, but the height is limited.

2、Core Resistance Levels:

• First Resistance Area: $94,500~$95,000 area (previous box top edge)

• Second Resistance Area: $97,500~$99,500 area (previous oscillation center)

• Important Resistance Level: $10,200附近 (near the 21-week moving average)

3、Core Support Levels:

• First Support Level: $89,500~$91,000 area (previous筹码密集成交区)

• Second Support Level: $86,000~$86,500 area (previous important support level)

• Important Support Level: $84,000附近(previous box bottom edge)

IV. This Week's Operation Strategy (Excluding Sudden News Impact): (01.19~01.25)

1、 Midline Strategy: No position, market trends may oscillate and反复,暂时持币观望.

2、 Short-term Strategy: Use 30% of position, set stop loss points, based on support and resistance levels, look for "spread" opportunities. (Using 30 minutes as the operation cycle).

3、 In operation, focus on the gain/loss of the $94,500~$95,000 area. To dynamically respond to market changes and combine real-time model signals, we have formulated two short-term operation plans A/B:

Plan A: If the coin price stabilizes above the $94,500~$95,000 area:

• Open Position: After the coin price breaks through the $94,500~$95,000 area and shows stabilization signals, combined with model bottom signals, a 30% long position can be established.

• Risk Control: Initial stop loss for long positions set about 1.5% below the cost price (i.e., 0.985*cost price).

• Close Position: When rebounding near core resistance levels combined with model signals, gradually close positions to take profits.

Plan B: If the coin price effectively falls below the $94,500~$95,000 area:

• Open Position: If the rebound confirms an effective break below this area, a 30% short position can be established.

• Risk Control: Initial stop loss for short positions set about 1.5% above the cost price (i.e., 1.015*cost price).

• Close Position: When falling near $86,500 combined with model signals, gradually close positions to take profits.

Bitcoin Weekly K-line Chart: Comparative Analysis of Historical Trend Structures (2021.11 VS 2025.10)
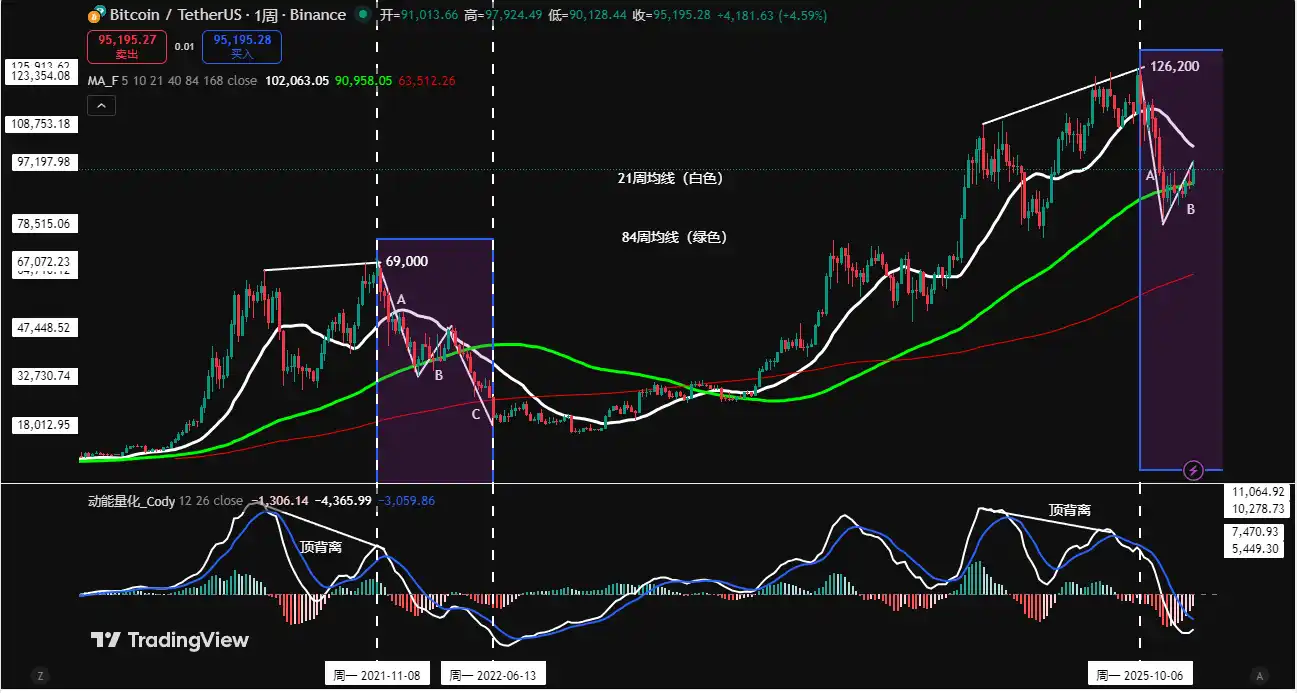
Figure 4

Note: In the above figure, 21-week moving average (white), 84-week moving average (green)

V. How Will History Repeat Itself? Comparing the Similarities and Differences of Two Rounds of Weekly Level Adjustments and Their Implications:

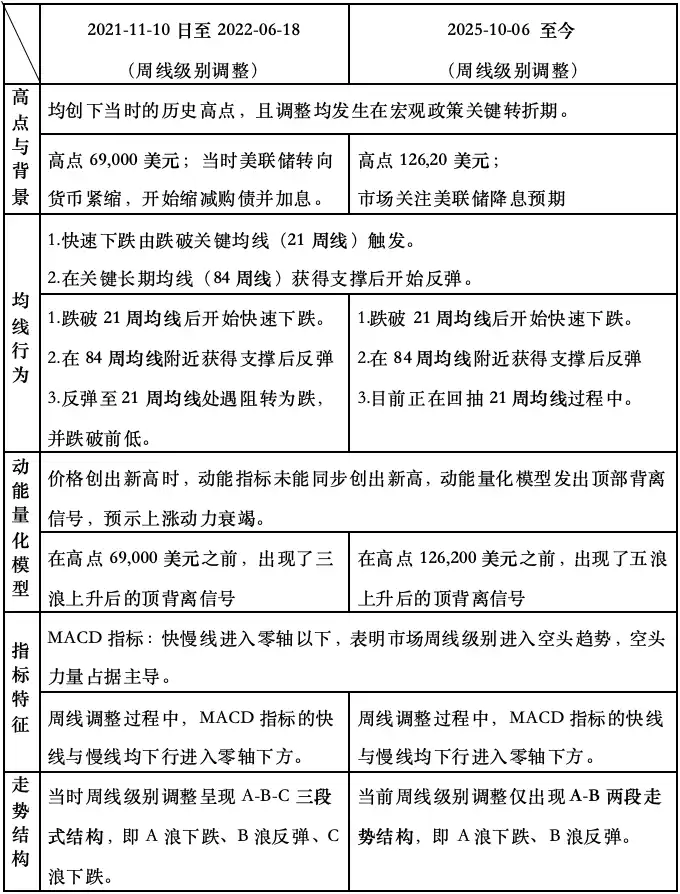
In summary, we can extract the following core insights:

1、The current weekly level is in a bearish trend, which limits the space for daily rebounds.

2、In the coming weeks, whether the coin price can effectively break through and stabilize above the 21-week moving average will become the focus of market attention. If the coin price fails to form an effective breakthrough when rebounding to this moving average, the market may重现 the pattern of historical adjustments, even falling below the $80,000 mark.

3、Whether the weekly level MACD indicator can show signs of stopping下跌 and stabilizing, and the momentum line effectively crosses above the zero axis, becomes a key basis for judging whether the market trend has reversed.

VI. Special Tips:​​

1. When opening a position: Immediately set the initial stop loss level.

2. When profit reaches 1%: Move the stop loss to the opening cost price (breakeven point) to ensure capital safety.

3. When profit reaches 2%​​: Move the stop loss to the position of 1% profit.

4. Continuous tracking: Thereafter, for every additional 1% profit the coin price makes, move the stop loss level同步 by 1%, dynamically protecting and locking in profits.

Financial markets change rapidly, all market analysis and trading strategies need to be adjusted dynamically. All views, analytical models, and operational strategies involved in this article are derived from personal technical analysis, for personal trading log purposes only, and do not constitute any investment advice or operational basis. The market has risks, investment needs to be cautious, DYOR.

Related Questions

QWhat was the outcome of the short-term trading operation executed last week according to the article?

AThe short-term trading operation resulted in a loss of 1.07%.

QWhat is the key price zone that the article identifies as crucial for Bitcoin's price action this week?

AThe key price zone identified is $94,500 to $95,000.

QAccording to the analyst's models, what is the current trend on the weekly chart for Bitcoin?

AThe weekly chart is in a bearish trend, indicating a high probability of a price decline.

QWhat historical indicator does the article suggest is a critical level to watch for a potential bear-to-bull market transition?

AThe 21-week moving average is suggested as a critical level to watch for a potential trend reversal from bear to bull.

QWhat are the two trading scenarios (Plan A and Plan B) proposed for short-term operations in the coming week?

APlan A: Open a 30% long position if the price stabilizes above the $94,500-$95,000 zone. Plan B: Open a 30% short position if the price effectively breaks below the $94,500-$95,000 zone.

Related Reads

TechFlow Intelligence Agency: Anthropic Calls for Global Pause in AI Development While Preparing for Trillion-Dollar IPO; SpaceX IPO Roadshow Heats Up, But S&P 500 Rejects Fast-Track Inclusion

In today's TechFlow Intelligence Briefing, several major tech stories highlight a growing theme of trust and credibility gaps across AI, crypto, and finance. AI company Anthropic has publicly called for a global pause in AI development, citing risks from Claude's "recursive self-improvement." Ironically, this coincides with reports the company is preparing for a massive IPO targeting a near $1 trillion valuation. This perceived hypocrisy, coupled with widespread user complaints about Claude's declining performance, is sparking debate over whether the safety warning is genuine or a competitive tactic. Meanwhile, in a substantive security move, Anthropic open-sourced a framework for AI-powered vulnerability discovery. In the crypto market, Bitcoin's price drop below $61,000 triggered over $1.16 billion in liquidations, flipping the market into a state where more BTC is held at a loss than at a profit, a historical bearish signal. On the corporate front, SpaceX's highly anticipated IPO is generating immense Wall Street excitement, with Goldman Sachs projecting 100x revenue growth by 2030. However, the S&P 500 has refused to fast-track the company's inclusion post-IPO, potentially limiting immediate institutional demand. Separately, ByteDance's AI app Doubao lost over 6 million monthly active users after introducing a subscription model, highlighting the challenges of AI monetization. Other notable developments include Nvidia certifying HBM4 memory from Samsung, SK Hynix, and Micron; Cloudflare's acquisition of front-end tooling company VoidZero; and its CEO warning that bot traffic now exceeds human traffic online. The underlying narrative connects these events: a trust crisis. From AI firms' contradictory actions and crypto volatility to the clash between SpaceX's hyped narrative and institutional rules, a pattern is emerging where stated intentions and actual practices are increasingly misaligned.

marsbit13m ago

TechFlow Intelligence Agency: Anthropic Calls for Global Pause in AI Development While Preparing for Trillion-Dollar IPO; SpaceX IPO Roadshow Heats Up, But S&P 500 Rejects Fast-Track Inclusion

marsbit13m ago

Dalio Warns: AI Boom Shows Signs of a Bubble, Day of Reckoning Will Be the Time of Burst

Ray Dalio, founder of Bridgewater Associates, warns that the current artificial intelligence investment boom shows classic signs of a bubble, which he expects will eventually burst. In a Bloomberg Television interview, he noted that great technological revolutions often lead to capital inflows that create bubbles, making it difficult for investors and companies to calibrate their spending accurately—either overspending to capture market share or underspending and losing their competitive position. This caution comes amid significant rallies in AI-related assets, particularly chipmakers, driven by soaring demand for data centers and high-bandwidth chips, raising debates about overheating valuations. In contrast, Nvidia CEO Jensen Huang recently asserted that investors embracing the AI wave would see "crazy" returns and dismissed concerns over return on investment for data center spending as outdated. Dalio, however, focuses on the risks in the profit realization phase. He argues that bubbles tend to show signs of破裂 when markets transition from investment to the need for tangible returns, describing the burst as a process of converting paper wealth into cash. While acknowledging AI's intrinsic value, he expressed concern over the future profitability of some AI companies, suggesting the market is repeating a familiar pattern. The 76-year-old billionaire, who fully exited Bridgewater in 2025, has a net worth estimated at $21.5 billion according to the Bloomberg Billionaires Index.

marsbit47m ago

Dalio Warns: AI Boom Shows Signs of a Bubble, Day of Reckoning Will Be the Time of Burst

marsbit47m ago

Privacy Coin Crisis of Confidence! ZEC Plunges Over 56% in a Single Day

Zcash (ZEC), a leading privacy-focused cryptocurrency, experienced a severe crash on June 5th, plummeting over 56% in a single day and erasing nearly two months of gains. The flash crash was triggered by the disclosure of a critical zero-knowledge proof vulnerability within Zcash's Orchard privacy pool, which had existed since the pool's launch in May 2022. The flaw theoretically allowed an attacker to forge unlimited ZEC undetectably due to the pool's privacy features. The vulnerability was discovered on May 29th by independent security researcher Taylor Hornby during a proactive audit commissioned by Shielded Labs, utilizing AI-assisted analysis. The Zcash development team responded swiftly, implementing an emergency soft fork to disable Orchard transactions on June 2nd and executing a permanent hard fork fix (NU6.2) on June 3rd. Despite the technical fix, a major crisis of confidence emerged. The core issue is that Orchard's privacy design makes it cryptographically impossible to prove whether the vulnerability was exploited over the past four years, casting permanent doubt on the historical supply integrity of ZEC. While Shielded Labs argues exploitation was unlikely, the inability to provide definitive proof has severely damaged market trust. This sentiment was exacerbated when BitMEX co-founder Arthur Hayes, a prominent ZEC supporter, announced he was selling his entire position. He stated that privacy assets require "perfect security" rather than "probable safety." The combined effect of the disclosure and Hayes's exit ignited widespread panic selling, leading to massive liquidations and significant price decline. Analysts note the event highlights a fundamental tension within privacy coins: the conflict between verifiable supply and cryptographic privacy.

链捕手49m ago

Privacy Coin Crisis of Confidence! ZEC Plunges Over 56% in a Single Day

链捕手49m ago

Trading

Spot
Futures

Hot Articles

What is $BITCOIN

DIGITAL GOLD ($BITCOIN): A Comprehensive Analysis Introduction to DIGITAL GOLD ($BITCOIN) DIGITAL GOLD ($BITCOIN) is a blockchain-based project operating on the Solana network, which aims to combine the characteristics of traditional precious metals with the innovation of decentralized technologies. While it shares a name with Bitcoin, often referred to as “digital gold” due to its perception as a store of value, DIGITAL GOLD is a separate token designed to create a unique ecosystem within the Web3 landscape. Its goal is to position itself as a viable alternative digital asset, although specifics regarding its applications and functionalities are still developing. What is DIGITAL GOLD ($BITCOIN)? DIGITAL GOLD ($BITCOIN) is a cryptocurrency token explicitly designed for use on the Solana blockchain. In contrast to Bitcoin, which provides a widely recognized value storage role, this token appears to focus on broader applications and characteristics. Notable aspects include: Blockchain Infrastructure: The token is built on the Solana blockchain, known for its capacity to handle high-speed and low-cost transactions. Supply Dynamics: DIGITAL GOLD has a maximum supply capped at 100 quadrillion tokens (100P $BITCOIN), although details regarding its circulating supply are currently undisclosed. Utility: While precise functionalities are not explicitly outlined, there are indications that the token could be utilized for various applications, potentially involving decentralized applications (dApps) or asset tokenization strategies. Who is the Creator of DIGITAL GOLD ($BITCOIN)? At present, the identity of the creators and development team behind DIGITAL GOLD ($BITCOIN) remains unknown. This situation is typical among many innovative projects within the blockchain space, particularly those aligning with decentralized finance and meme coin phenomena. While such anonymity may foster a community-driven culture, it intensifies concerns about governance and accountability. Who are the Investors of DIGITAL GOLD ($BITCOIN)? The available information indicates that DIGITAL GOLD ($BITCOIN) does not have any known institutional backers or prominent venture capital investments. The project seems to operate on a peer-to-peer model focused on community support and adoption rather than traditional funding routes. Its activity and liquidity are primarily situated on decentralized exchanges (DEXs), such as PumpSwap, rather than established centralized trading platforms, further highlighting its grassroots approach. How DIGITAL GOLD ($BITCOIN) Works The operational mechanics of DIGITAL GOLD ($BITCOIN) can be elaborated on based on its blockchain design and network attributes: Consensus Mechanism: By leveraging Solana’s unique proof-of-history (PoH) combined with a proof-of-stake (PoS) model, the project ensures efficient transaction validation contributing to the network's high performance. Tokenomics: While specific deflationary mechanisms have not been extensively detailed, the vast maximum token supply implies that it may cater to microtransactions or niche use cases that are still to be defined. Interoperability: There exists the potential for integration with Solana’s broader ecosystem, including various decentralized finance (DeFi) platforms. However, the details regarding specific integrations remain unspecified. Timeline of Key Events Here is a timeline that highlights significant milestones concerning DIGITAL GOLD ($BITCOIN): 2023: The initial deployment of the token occurs on the Solana blockchain, marked by its contract address. 2024: DIGITAL GOLD gains visibility as it becomes available for trading on decentralized exchanges like PumpSwap, allowing users to trade it against SOL. 2025: The project witnesses sporadic trading activity and potential interest in community-led engagements, although no noteworthy partnerships or technical advancements have been documented as of yet. Critical Analysis Strengths Scalability: The underlying Solana infrastructure supports high transaction volumes, which could enhance the utility of $BITCOIN in various transaction scenarios. Accessibility: The potential low trading price per token could attract retail investors, facilitating wider participation due to fractional ownership opportunities. Risks Lack of Transparency: The absence of publicly known backers, developers, or an audit process may yield skepticism regarding the project's sustainability and trustworthiness. Market Volatility: The trading activity is heavily reliant on speculative behavior, which can result in significant price volatility and uncertainty for investors. Conclusion DIGITAL GOLD ($BITCOIN) emerges as an intriguing yet ambiguous project within the rapidly evolving Solana ecosystem. While it attempts to leverage the “digital gold” narrative, its departure from Bitcoin's established role as a store of value underscores the need for a clearer differentiation of its intended utility and governance structure. Future acceptance and adoption will likely depend on addressing the current opacity and defining its operational and economic strategies more explicitly. Note: This report encompasses synthesised information available as of October 2023, and developments may have transpired beyond the research period.

363 Total ViewsPublished 2025.05.13Updated 2025.05.13

What is $BITCOIN

Discussions

Welcome to the HTX Community. Here, you can stay informed about the latest platform developments and gain access to professional market insights. Users' opinions on the price of BTC (BTC) are presented below.

活动图片