This week, BTC is currently in the final stage of a five-wave adjustment structure. The formation position of "Endpoint 44" will determine the short-term direction—if above 58,110, the probability of a rebound is high; if below and without bullish divergence, be alert to further breakdown. We have preset three operational plans (A/B/C). Medium-term short positions are maintained at 20%, while short-term positions reserve 30% for price difference opportunities.
Meanwhile, HYPE has initiated a five-wave adjustment from its high of 76.94 and is currently operating in the 55-56 segment. If "Endpoint 56" is higher than the previous low, forming a double bottom, the probability of a rebound is significant; after stabilizing in the support zone, light long positions can be tested, with positions strictly controlled below 30%.
For the complete structural analysis, interpretation of quantitative model signals, and specific operational plans, please refer to the full text of this week's market review.
Summary of This Week's Core Trading Views
- BTC Hourly Trend Structure Analysis (Detailed in Part 1)
- BTC Market Forecast and Mid/Short-term Trading Strategies for This Week (Detailed in Part 2)
- HYPE Hourly Trend Structure Analysis (Detailed in Part 3)
- HYPE Market Forecast and Short-term Trading Strategies for This Week (Detailed in Part 4)
Market Verification of Last Week's Trading Strategies and Core Views
- BTC Short-term Trading Performance: Bitcoin completed two short-term short trades last week (1x leverage), successfully achieving a profit of approximately 6.21%. (Detailed in Part 5)
- BTC Market Trend Forecast Verification: In the previous weekly review, we forecasted (as shown in Figure 1) that if "Endpoint 41" could not hold above the lower channel line, the probability of the market retesting the previous low support at 59,100 USD was high. Currently, the overall market movement validates this view.
1. In-depth Analysis of Bitcoin's Hourly Trend Structure
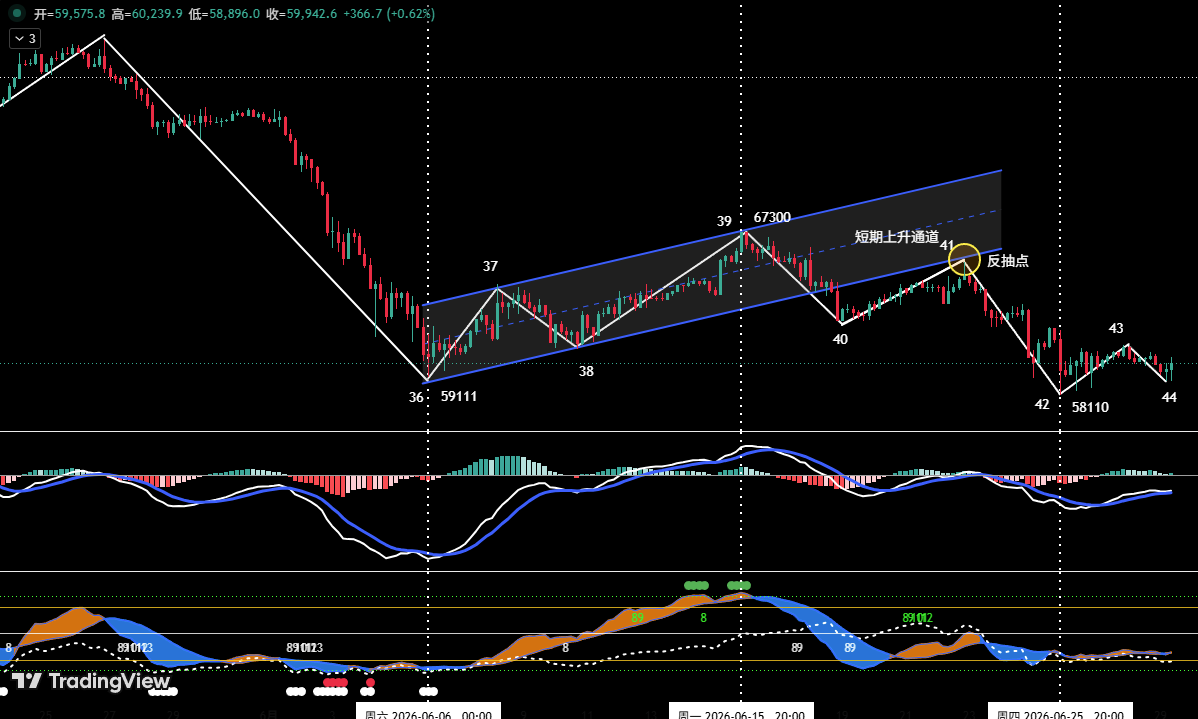
1 As shown in (Figure 1): The previous weekly review clearly pointed out that segment (40-41) was a pullback confirmation after breaking below the lower line of the short-term rising channel (blue channel). If "Endpoint 41" could not regain and stabilize above the lower channel line, the trend would weaken, increasing the probability of a retest of the previous low support at 59,100 USD. The chart shows that last week's adjustment touched a low of 58,110 USD before finding short-term support.
2 From the 4-hour cycle analysis, the oversold rebound that started from the low of 59,100 USD on June 6th was confirmed to have ended at "Endpoint 39" (67,300 USD).
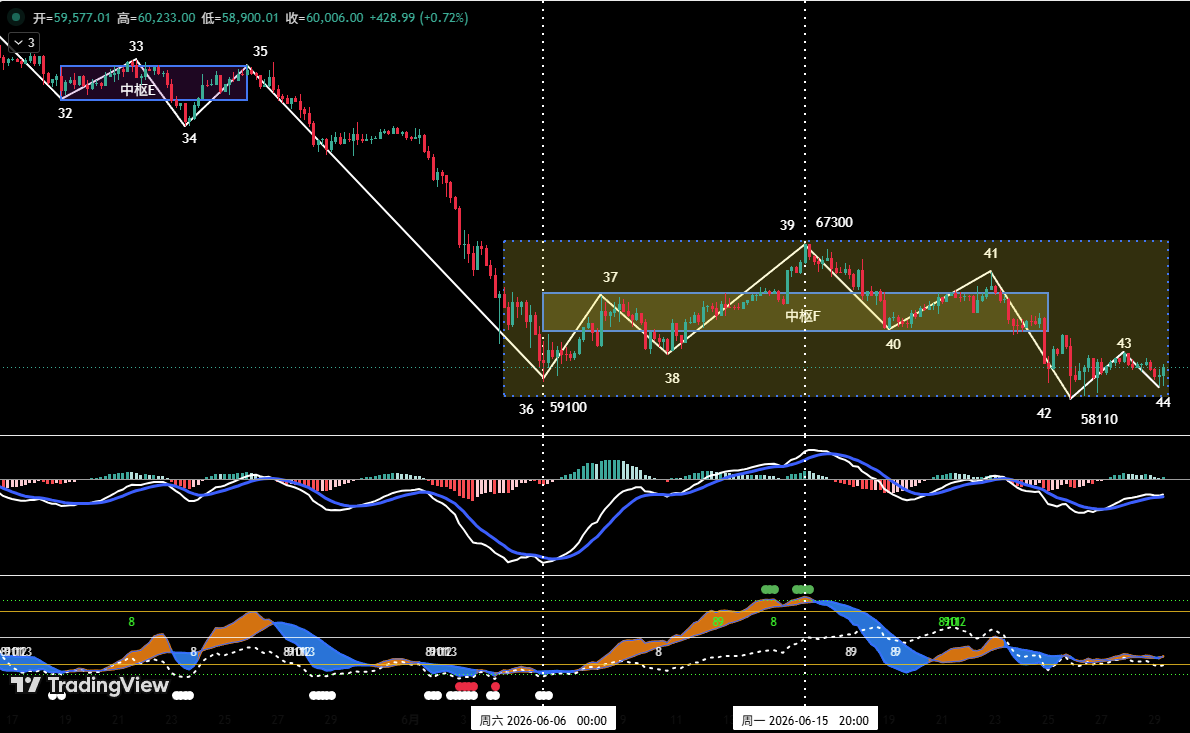
3 As shown in (Figure 2): Starting from "Endpoint 39", the market entered a clear 5-wave adjustment structure (i.e., from Endpoint 39 to Endpoint 44), and is currently operating in the (43-44) adjustment segment.
The final position of "Endpoint 44" will be key for the short-term direction:
- If "Endpoint 44" is above 58,110 USD: A relatively strong technical rebound is expected, likely followed by wide-range box consolidation.
- If "Endpoint 44" is below 58,110 USD and a bullish momentum divergence occurs: There is also a rebound opportunity, but its strength needs observation.
- If "Endpoint 44" is below 58,110 USD and no bullish momentum divergence occurs: After a short-term adjustment, the price may break down further.
4 Summary: Analysis from our self-built quantitative model suggests a higher probability for the first two scenarios.
2. Bitcoin Market Forecast and Trading Strategies for This Week
1. BTC Market Trend Forecast This Week
Core view this week: Focus on the formation of "Endpoint 44". If the first scenario mentioned above occurs, consider light long positions for the short term.
2. Core Resistance Levels
- First Resistance Zone: 60,900~62,300 USD area (previous important high/low points)
- Second Resistance Zone: Around 65,500 USD (previous significant resistance area)
- Third Resistance Zone: 67,300~69,500 USD area (previous important resistance area)
3. Core Support Levels
- First Support Level: Around 58,100 USD (previous important support level)
- Second Support Level: Around 55,000 USD (previous important support level)
4. Trading Strategies This Week (excluding sudden news impact)
1 Medium-term Strategy
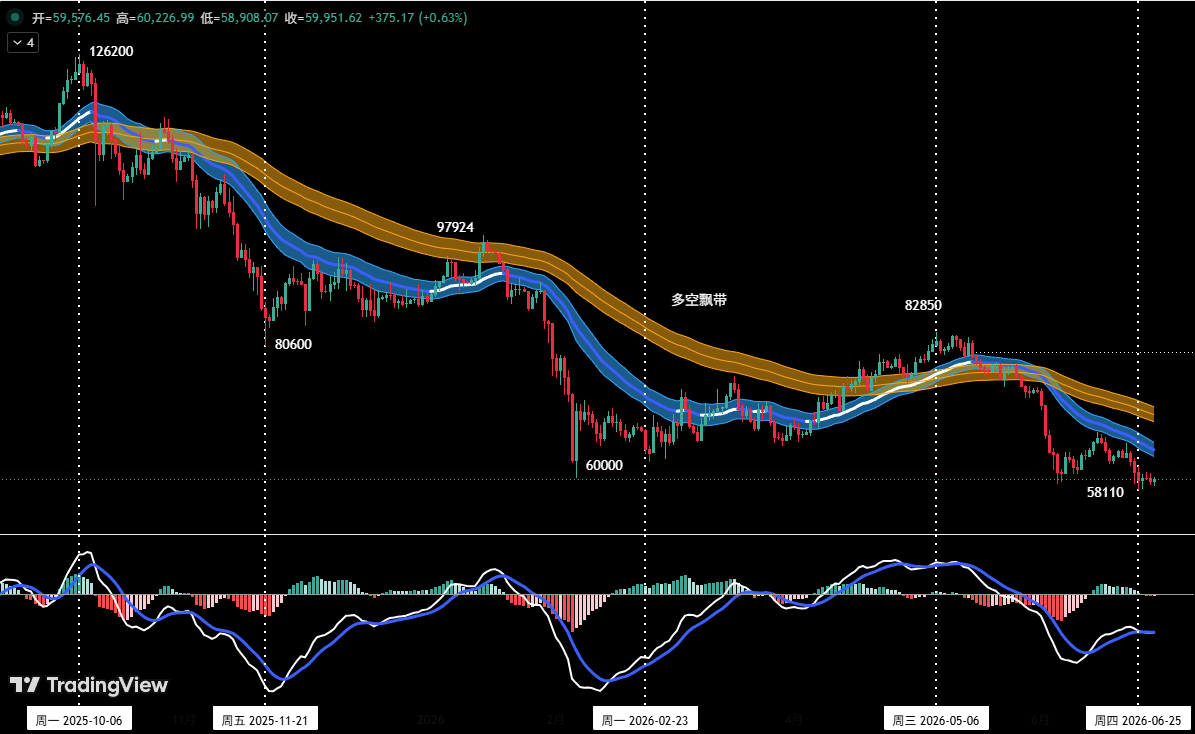
Position Monitoring Model: As shown in (Figure 3), the current price has effectively broken below the "Bull-Bear Channel", confirming a shift to a bear-dominated market structure. Medium-term short positions are temporarily maintained at around 20%.
2 Short-term Strategy
Utilize 30% of the position, set stop-loss points, and look for "price difference" opportunities based on support and resistance levels (using 30-minute/60-minute cycles for operations).
3 Three Operational Plans (A/B/C)
For short-term operations, to dynamically respond to complex market evolutions, we have prepared three specific operational plans in advance.
Plan A: Tentative Long Position in Strong Support Zone (Endpoint 44 above 58,110 USD)
- Entry: If the price scenario occurs as described above and aligns with quantitative model signals, consider establishing a long position of about 15%.
- Risk Control: Set initial stop-loss level.
- Exit: When rebounding near important resistance levels and combined with quantitative model signals, gradually close positions to take profits.
Plan B: Light Short Position in Resistance Zone
- Entry: If the price rebounds to the 60,900~62,300 USD area and shows signs of resistance, combined with quantitative model topping signals, establish an initial short position of about 15%.
- Risk Control: Set initial stop-loss level.
- Exit: When adjusting to important support levels and combined with model signals, gradually close positions to take profits.
Plan C: Add Short Position in Strong Resistance Zone
- Addition: If the price continues to rebound to near the 65,000 USD or even 67,300 USD resistance levels and shows signs of stagnation, combined with quantitative model topping signals, consider adding short positions up to within 30%.
- Risk Control: Set initial stop-loss level.
- Exit: When falling to important support levels and combined with model signals, gradually close positions to take profits.
3. HYPE Hourly Trend Structure Analysis
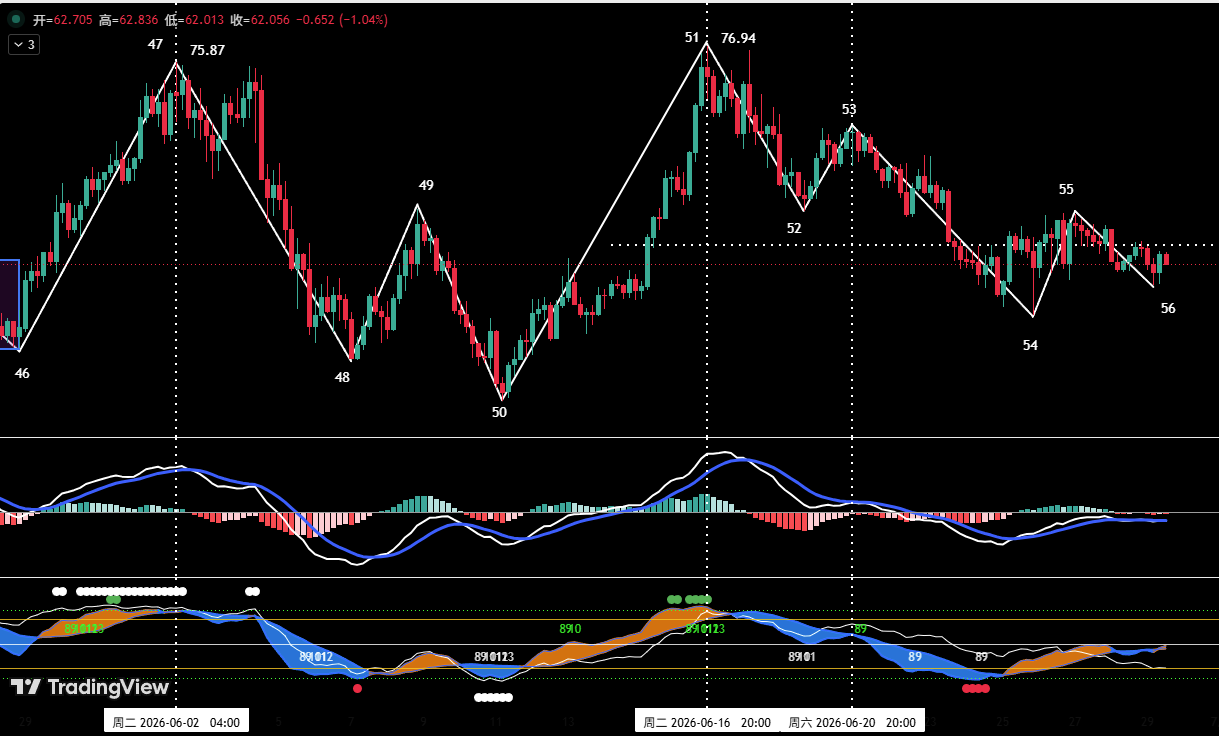
1 As shown in (Figure 4), HYPE began adjusting from its high of 76.94 USD on June 16th (Endpoint 51). In the 4-hour cycle, it can be subdivided into a five-wave adjustment structure: segments 51-52, 52-53, 53-54, 54-55, and 55-56. The price is currently operating in the 55-56 adjustment segment. The position status of "Endpoint 56" is key to the recent price trend.
2 Scenarios for the End of Short-term Adjustment:
- If "Endpoint 56" is higher than "Endpoint 54", forming a "double bottom" pattern, this round of adjustment may end, and a rebound starting from "Endpoint 56" is highly probable.
- If "Endpoint 56" is lower than "Endpoint 54" but forms a bullish momentum divergence, the probability of this round of adjustment ending is also high, with a potential rebound.
3 Scenarios for Continuation of Short-term Adjustment:
- If "Endpoint 56" is lower than "Endpoint 54" and there is no bullish momentum divergence, this round of adjustment may extend into a seven-wave adjustment structure.
4 Analysis from our self-built quantitative model suggests a significant probability of the first scenario.
4. HYPE Market Forecast and Short-term Trading Strategies for This Week
1. HYPE Market Trend Forecast This Week
Core Resistance Levels:
- First Resistance Level: Around 65.5 USD
- Second Resistance Level: Around 71.5 USD
Core Support Levels:
- First Support Level: Around 58.5 USD
- Second Support Level: 52~54 USD area
Core HYPE View This Week: Observe the position and technical pattern when "Endpoint 56" finally forms.
2. HYPE Short-term Trading Strategies This Week (Long on Support)
This week's HYPE short-term trading should follow the strategy of "buying on dips, avoiding chasing rallies".
Short-term Strategy: Test long on support zone stabilization. When the HYPE price adjusts to above 58.8 USD or the deeper 52~54 USD support area, showing signs of stabilization and halting declines, and simultaneously combined with bottom signals triggered by two models, consider light long positions. Positions must be controlled below 30% and strict stop-loss discipline must be maintained.
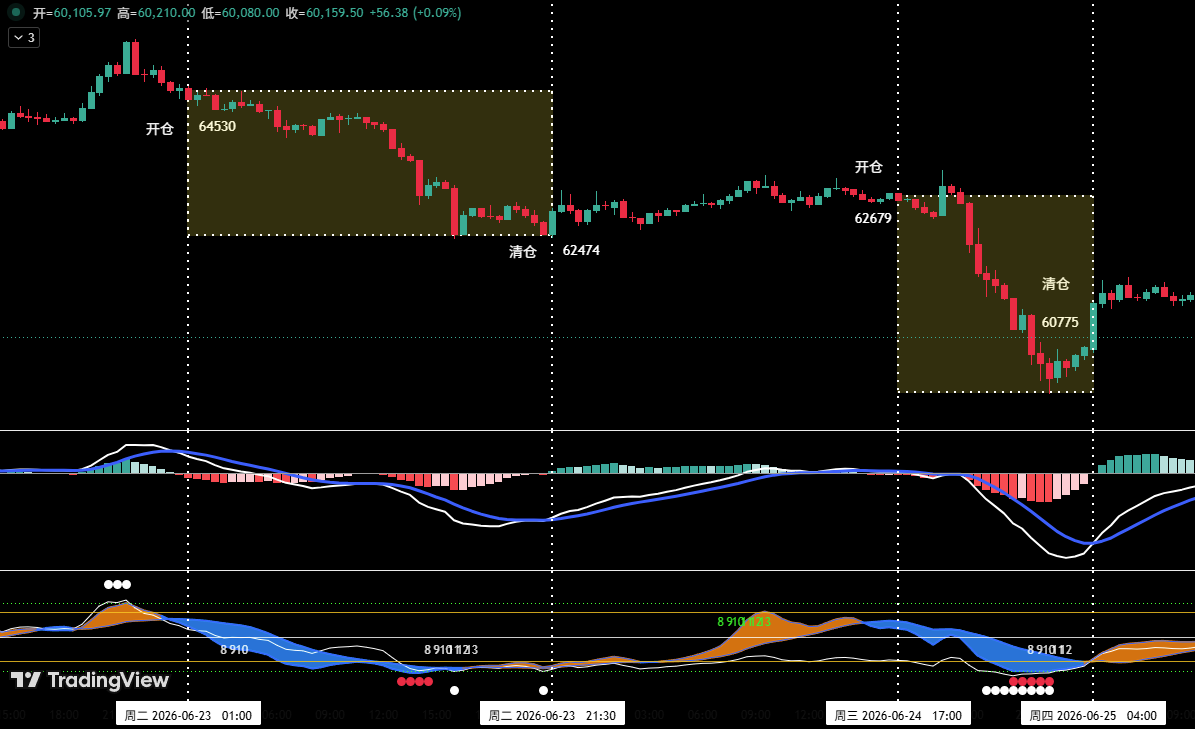
5. Bitcoin Short-term Operation Review
We strictly followed the operational plans and executed two short-term short trades last week based on trading signals issued by our self-built "Price Difference Trading Model" and "Momentum Quantitative Model", achieving a total trading profit of approximately 6.21%.
1. Short-term Trade One
Bitcoin Short-term Trade Details (Leverage ×1):
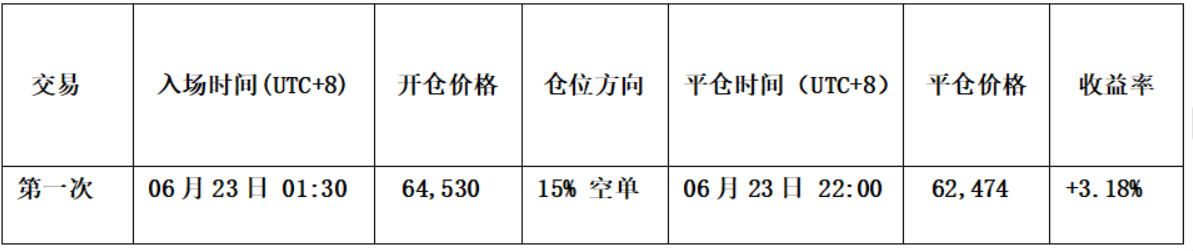
- When the price rebounded to around 65,500 USD, met resistance and showed signs of pressure, with the K-line forming a "top reversal" bearish signal;
- The "Price Difference Trading Model" triggered a top warning signal (white dot), and the "Momentum Quantitative Model" formed a bearish momentum divergence signal.
Therefore, we established a 15% short position at 64,530 USD.
Exit Strategy:
- When the price fell to around 62,000 USD and halted its decline, with the K-line forming a "bottom reversal" signal;
- The "Price Difference Trading Model" triggered a strong bottom warning signal (red dot + white dot), forming a bottom resonance signal with the "Momentum Quantitative Model".
Therefore, we closed all positions around 62,474 USD.
Summary: This trade successfully achieved a profit of approximately 3.18%.
2. Short-term Trade Two
Bitcoin Short-term Trade Details (Leverage ×1):
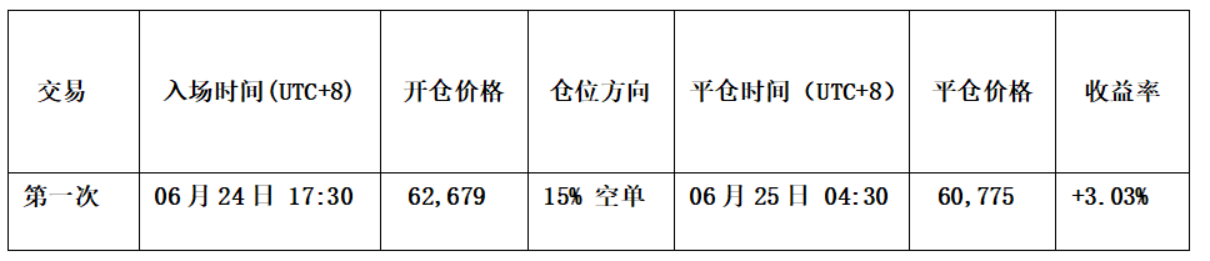
- When the price moved to around 63,000 USD, the two momentum lines in the "Momentum Quantitative Model" moved near the "zero axis" and showed signs of momentum exhaustion, subsequently forming the first "death cross" pattern below the "zero axis";
- Simultaneously, the "Price Difference Trading Model" issued a top warning signal.
Therefore, we established a 15% short position at 62,679 USD.
Exit Strategy:
- When the price fell to around 59,000 USD and halted its decline, with the K-line forming a "bottom reversal" signal;
- The "Price Difference Trading Model" triggered a strong bottom warning signal (red dot + white dot), forming a bottom resonance signal with the "Momentum Quantitative Model".
Therefore, we closed all positions around 60,775 USD.
Summary: This trade successfully achieved a profit of approximately 3.03%.
6. Special Notes
- When opening a position: Immediately set the initial stop-loss level.
- When profit reaches 1%: Move the stop-loss to the entry cost price (break-even point) to ensure principal safety.
- When profit reaches 2%: Move the stop-loss to the 1% profit level.
- Continuous tracking: For every subsequent 1% increase in profit, synchronously move the stop-loss up by 1% to dynamically protect and lock in profits.
Risk Warning:
Financial markets are constantly changing, and all market analysis and trading strategies require dynamic adjustments. All views, analytical models, and operational strategies mentioned in this article are derived from personal technical analysis and are for personal trading log purposes only. They do not constitute any investment advice or operational basis. The market involves risks, and investment requires caution. Please do not make decisions based solely on this content.