L'expert en crypto Adam Livingston a attiré l'attention sur la moyenne mobile sur 4 ans du Bitcoin, qui donne des indications sur le niveau auquel la cryptomonnaie leader est susceptible de toucher le fond dans ce marché baissier. Cela intervient alors que le BTC prolonge son déclin et risque désormais de chuter vers le plus bas de février 2026, à 60 000 dollars.
Un expert pointe la moyenne mobile sur 4 ans du Bitcoin pour un plancher potentiel
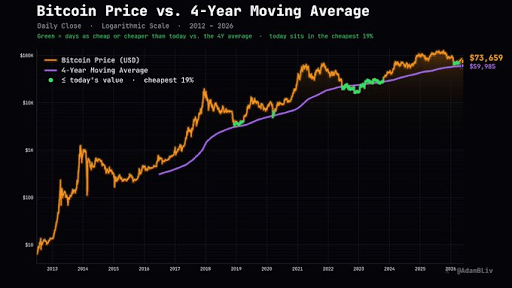
Dans un post sur X, Livingston a noté que la moyenne mobile sur 4 ans du Bitcoin se situe précisément à 60 000 dollars et que le Bitcoin n'est que 22,75 % au-dessus de cette moyenne mobile. Il a en outre remarqué qu'historiquement, seuls environ 18,5 % des jours valides avaient un écart inférieur. Il a ajouté qu'environ 81,5 % des jours étaient plus chers par rapport à la moyenne mobile sur 4 ans.
Fondamentalement, l'expert en crypto a suggéré que cette moyenne mobile sur 4 ans pourrait marquer le creux du Bitcoin dans ce cycle. Livingston a noté qu'acheter du BTC lorsqu'il se trouvait dans la même bande de percentile bon marché par rapport à la MM sur 4 ans aurait transformé chaque tranche de 10 000 dollars déployée en environ 56 600 dollars, contre environ 40 200 dollars avec un DCA quotidien sur la même période. Il a ajouté que le BTC au percentile actuel de la MM sur 4 ans a historiquement été une zone d'accumulation de haute qualité.
À ce titre, Livingston a suggéré qu'il pourrait être judicieux de commencer à accumuler du Bitcoin dans cette fourchette, 60 000 dollars étant susceptibles de servir de plancher. Il est à noter que son commentaire intervient alors que le BTC semble prêt à retomber à 60 000 dollars. La cryptomonnaie leader a connu une vente massive depuis le début de la semaine, chutant depuis un plus haut à 71 000 dollars.
Cependant, l'analyste crypto Bluntz a prédit que le Bitcoin chuterait sous les 60 000 dollars lors de ce déclin. Il a fait allusion à la clôture quotidienne du BTC, indiquant qu'il n'y avait aucun moyen que la cryptomonnaie leader ne balaie pas les 58 000 dollars.
Le BTC dans une position vulnérable
Dans un post sur X, l'analyste crypto Ali Martinez a déclaré que la cassure sous les 72 000 dollars a placé le Bitcoin dans une position vulnérable et que, sur la base des bandes de prix MVRV, la prochaine zone de support majeure se situe entre 54 000 et 50 000 dollars. Ainsi, le BTC risque toujours de chuter jusqu'à 50 000 dollars dans ce cycle de marché.
Dans un autre post sur X, Martinez a souligné comment le Bitcoin fait face à une pression de vente significative avec 54 000 BTC déplacés vers des plateformes d'échange au cours de la semaine dernière. Il a noté que ce pic de l'offre disponible a augmenté la pression de vente à court terme, ce qui a fait chuter le prix vers le bas des 60 000 dollars. Le BTC fait également face à une pression de vente de la part des ETF Bitcoin, qui sont actuellement sur une série de 13 jours de sorties nettes de capitaux.
Au moment de la rédaction, le prix du BTC s'échange autour de 63 600 dollars, en baisse de plus de 5 % au cours des dernières 24 heures, selon les données de CoinMarketCap.