Bitcoin Selloff Drew Spot Volume, But Demand Lacked Follow-Through: Glassnode

bitcoinistPublished on 2026-02-13Last updated on 2026-02-13

Abstract

Bitcoin spot trading volume spiked during the recent selloff that drove the price toward $60,000, but the surge was short-lived, according to on-chain analytics firm Glassnode. The initial increase reflected panic reactions and short-term repositioning rather than sustained buying interest. The lack of follow-through demand suggests shallow absorption relative to selling pressure. Meanwhile, Bitcoin has found support in the $60,000–$72,000 range, a zone where prior buyers appear to be defending their positions. As of the report, BTC's price has declined to around $65,900.

On-chain analytics firm Glassnode has highlighted how the Bitcoin Spot Volume spiked during the price drawdown, but it has since cooled off.

Bitcoin Spot Volume Shot Up During The Selloff

In its latest weekly report, Glassnode has talked about the latest trend in the Bitcoin Spot Volume. This on-chain indicator measures the total amount of BTC becoming involved in trading activity on the various spot exchanges.

When the value of this metric rises, it means more of the cryptocurrency is being involved in spot trading. Such a trend can be a sign that interest in the asset is going up.

On the other hand, the indicator witnessing a decline indicates investor attention may be moving away from the cryptocurrency as less spot trading activity is taking place.

Now, here is the chart shared by Glassnode that shows how the 7-day moving average (MA) value of the Bitcoin Spot Volume has changed over the last few years:
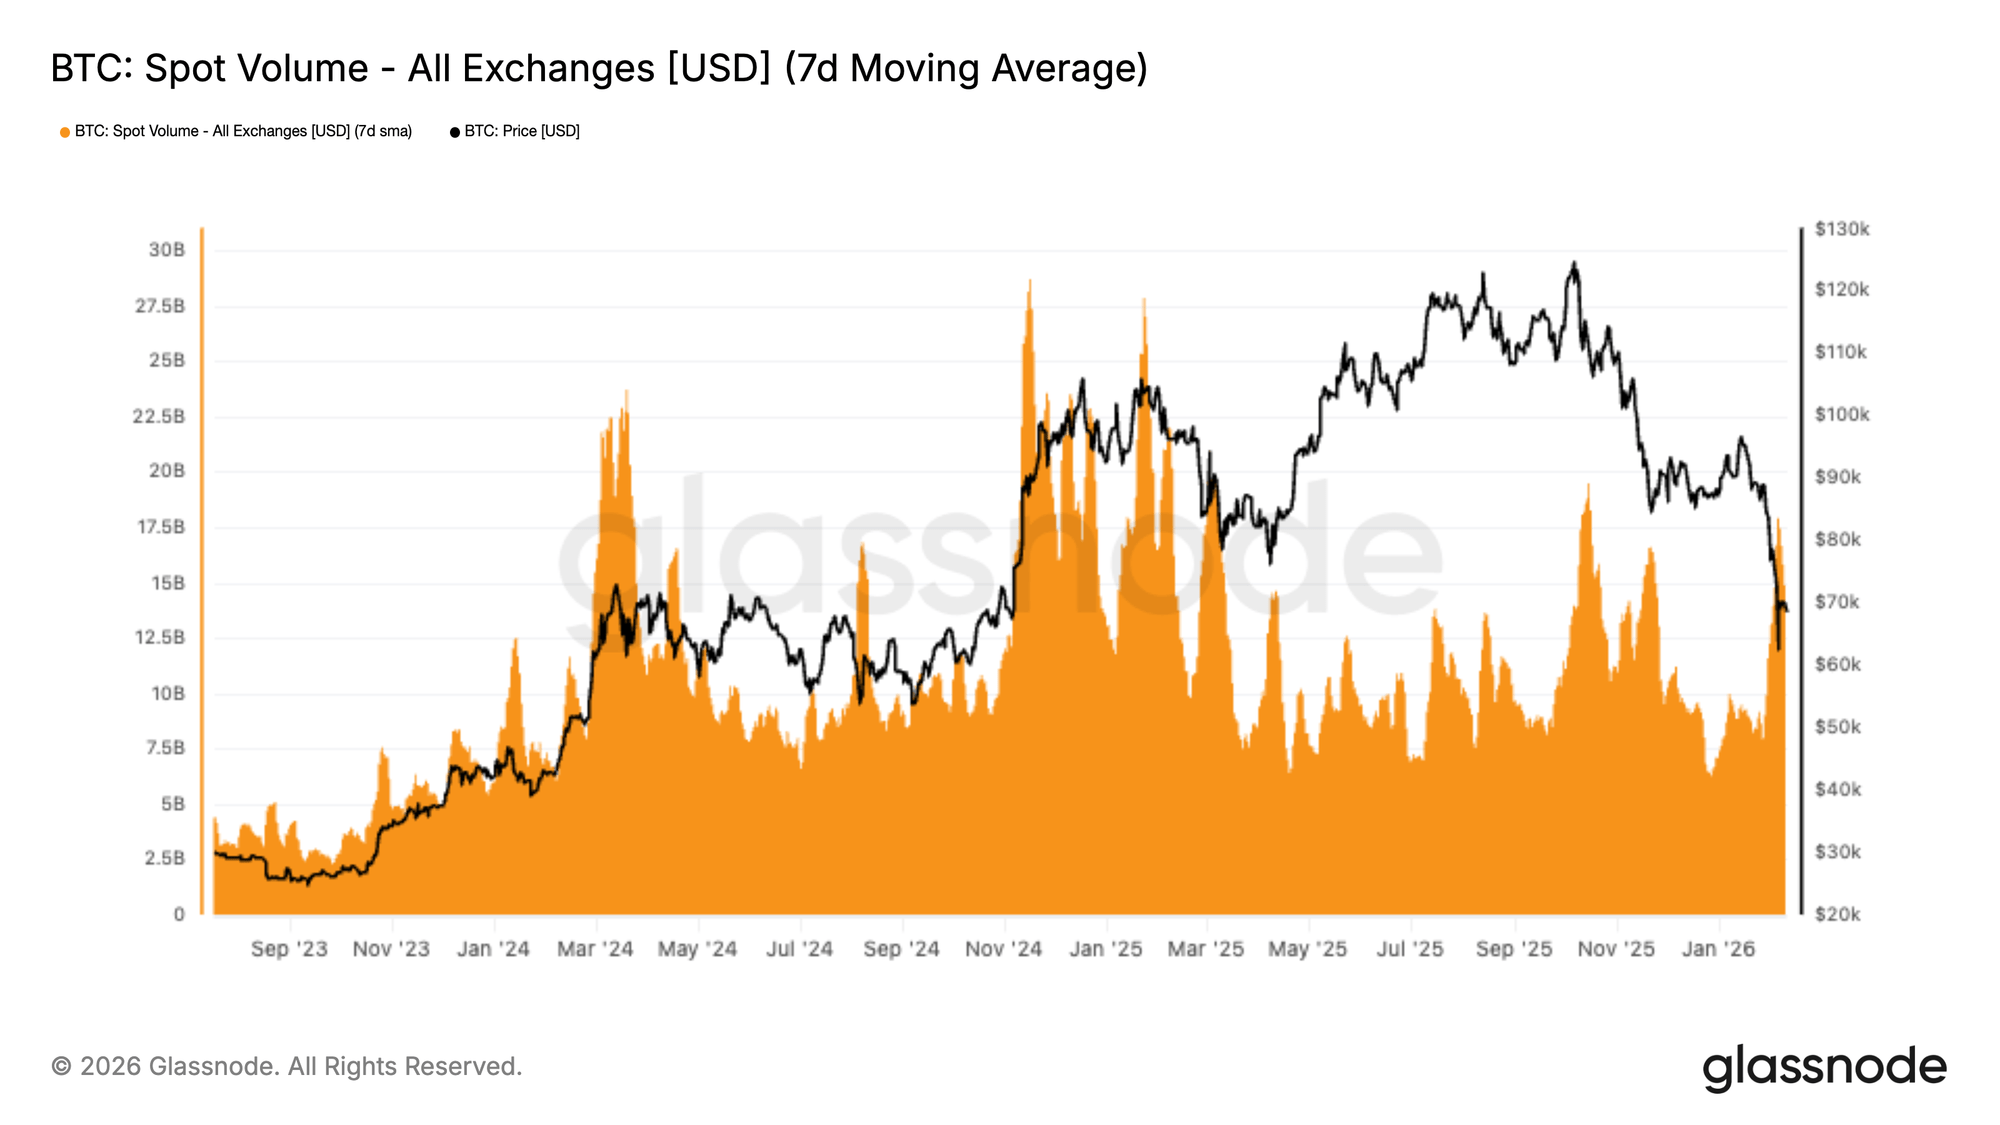
The value of the metric seems to have shot up in recent days | Source: Glassnode's The Week Onchain - Week 6, 2026

As displayed in the above graph, the 7-day MA Bitcoin Spot Volume observed a notable spike alongside the price crash toward the $60,000 level. This would suggest that investors made a large amount of trades during the volatile move.

But what exactly did this activity correspond to? According to the report, it didn’t reflect a broad wave of fresh conviction buying. Instead, the Spot Volume increase was a result of traders panic reacting to the price drawdown.

This is backed by the trajectory followed by the indicator. From the chart, it’s apparent that while the initial Spot Volume increase was sharp, it was quick to cool down. The trend would imply that while the move drew attention from investors, it didn’t translate into sustained demand. “The lack of follow-through indicates that absorption remains shallow relative to the scale of selling pressure,” noted Glassnode.

In the past, price moves have generally only been sustainable for Bitcoin when backed by spot trading activity. With the recent Spot Volume increase likely only a sign of short-term repositioning and liquidation churn, the market is yet to see a wave of persistent volume. “For now, spot flows reflect engagement during stress, not a decisive shift toward constructive demand,” explained the analytics firm.

In the same report, Glassnode has also discussed how Bitcoin is currently looking from the perspective of the UTXO Realized Price Distribution (URPD), an indicator tracking the amount of the cryptocurrency that was last purchased at the various levels visited by it in the past.
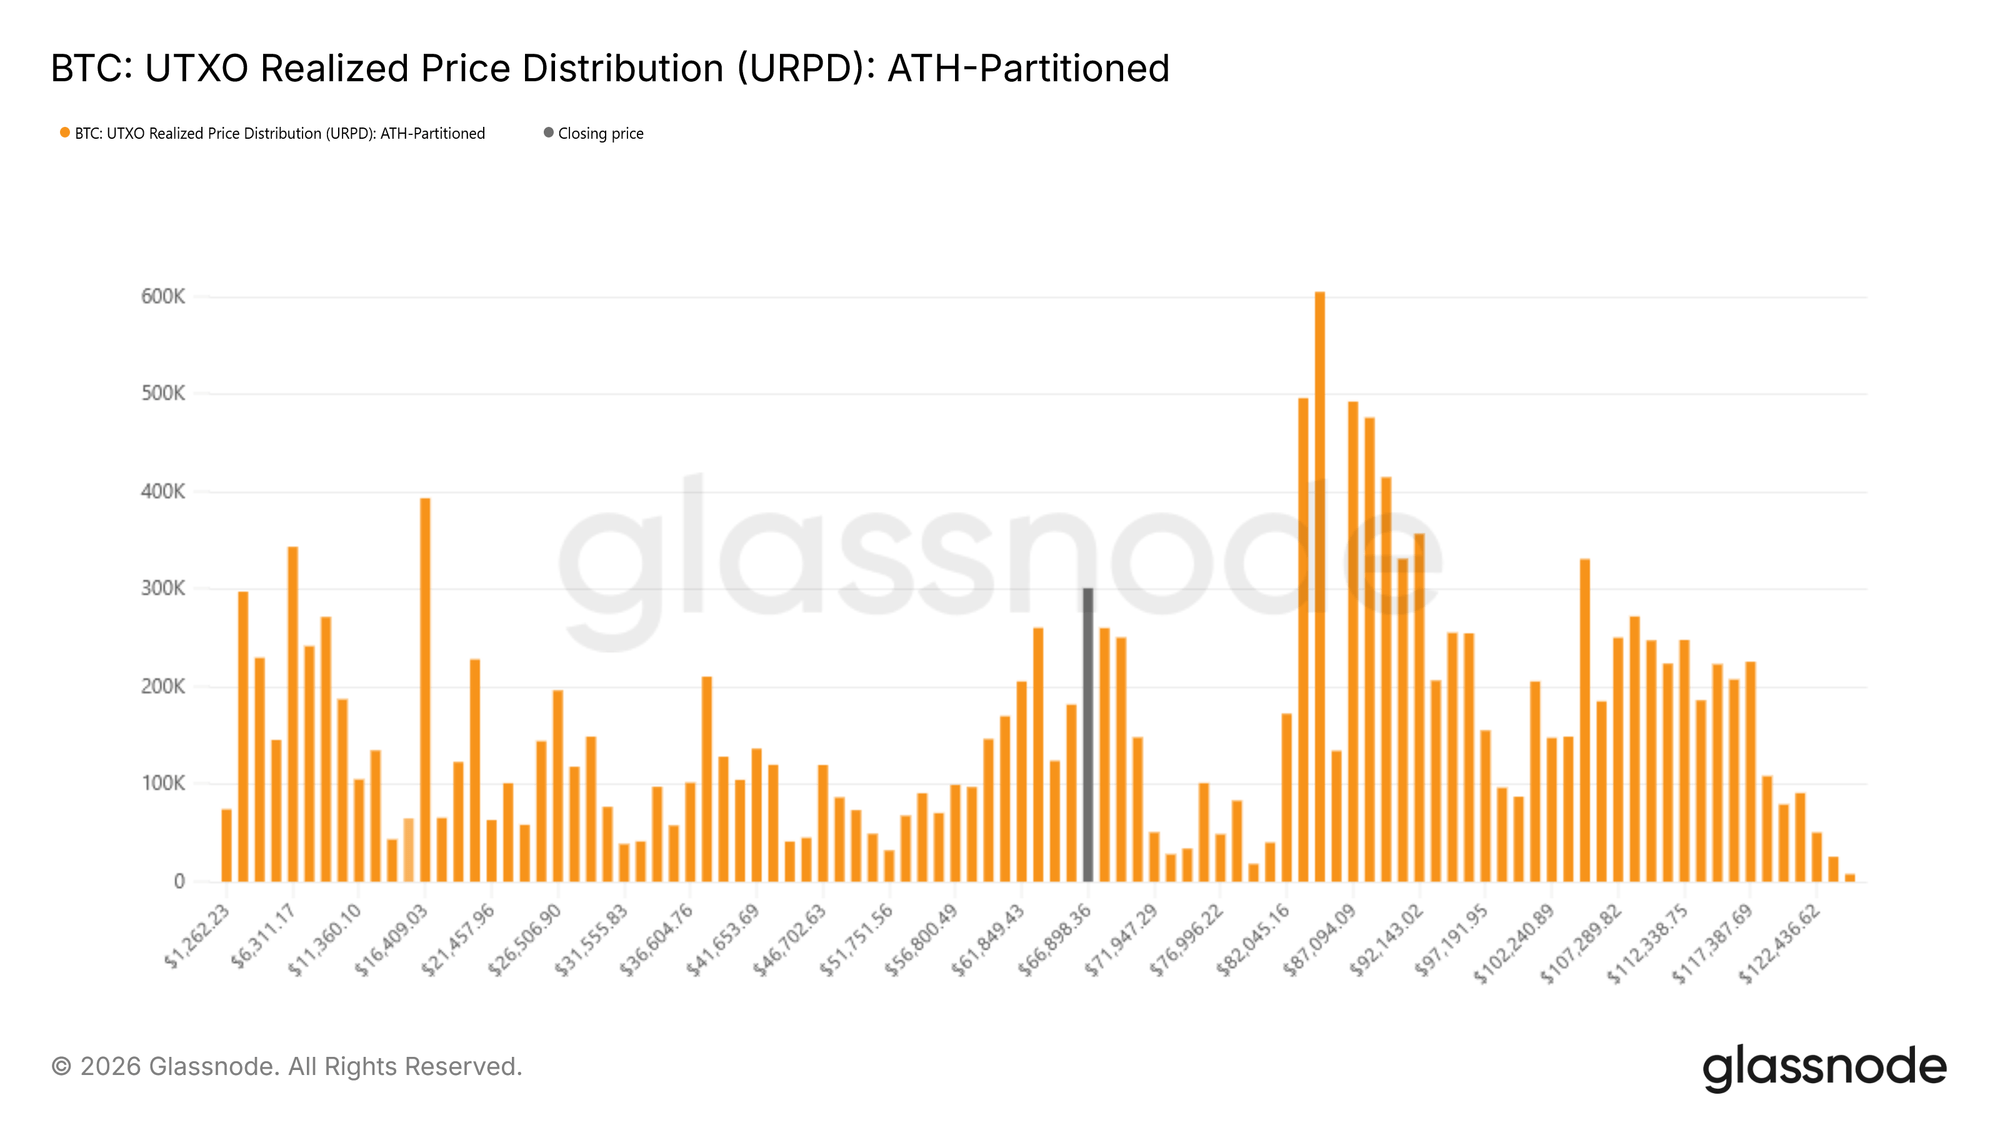
The latest URPD data of BTC | Source: Glassnode's The Week Onchain - Week 6, 2026

As is visible in the chart, Bitcoin has recently found support inside a thick supply zone between $60,000 and $72,000. This band on the URPD formed as a result of investor accumulation in the first half of 2024. According to Glassnode, the fact that the price has stabilized here could suggest that “prior buyers in this range are actively defending their positions.”

BTC Price

Bitcoin has been on the way down again as its price has dropped to the $65,900 mark.

The trend in the price of the coin over the last five days | Source: BTCUSDT on TradingView


Trending Cryptos

Related Questions

QWhat did the spike in Bitcoin Spot Volume during the recent price drawdown indicate, according to Glassnode?

AThe spike in Bitcoin Spot Volume during the price drawdown indicated a large amount of trading activity, but it was primarily a result of traders panic reacting to the price drop rather than a wave of fresh conviction buying.

QWhy did Glassnode conclude that the recent Spot Volume increase did not translate into sustained demand?

AGlassnode concluded this because the initial sharp increase in Spot Volume quickly cooled off, showing a lack of follow-through and indicating that absorption was shallow relative to the scale of selling pressure.

QWhat is the significance of the $60,000 to $72,000 range on the Bitcoin URPD chart mentioned in the report?

AThe $60,000 to $72,000 range is a thick supply zone on the URPD chart that formed from investor accumulation in the first half of 2024. The price stabilizing there suggests that prior buyers in this range are actively defending their positions.

QWhat does the Bitcoin Spot Volume metric measure?

AThe Bitcoin Spot Volume metric measures the total amount of BTC involved in trading activity on various spot exchanges.

QWhat was the price of Bitcoin at the time the article was written?

AAt the time the article was written, the price of Bitcoin had dropped to the $65,900 mark.

Related Reads

STRC Major De-pegging's First Financial Report, How Will Strategy Repair Its Capital Flywheel?

Bitcoin treasury company Strategy released its Q2 2026 earnings report on July 31. Despite a 6.9% year-over-year revenue increase to $122 million, the company recorded a net loss of $8.22 billion, largely due to $8.32 billion in unrealized losses from Bitcoin price fluctuations. As of quarter-end, Strategy holds 843,775 BTC with an average cost of $75,000 per coin, and Bitcoin per share increased. The report highlights a critical shift in Strategy's capital model following the de-pegging of its key financing tool, STRC (Strategic Coin), which fell below its $100 target. Management's top priority is restoring STRC to its target value, aiming for a recovery by September 8. They rule out discounted STRC issuances and plan to maintain its dividend yield at 12%, instead focusing on bolstering its $3.75 billion cash reserve. Strategy has moved from a one-way "buy-and-hold" Bitcoin strategy to active capital management. This new approach, part of its "Digital Credit Capital Framework," involves flexibly managing its balance sheet across four elements: BTC, USD cash, common stock (MSTR), and digital credit securities like STRC. This allows for BTC monetization (having sold $218.4 million in BTC so far), strategic repurchases of discounted securities, and debt optimization, as seen with a $1.5 billion convertible bond buyback. The company's future hinges on two key tests: successfully re-pegging STRC to restore market confidence in its digital credit system, and a long-term recovery in Bitcoin's price to ultimately support its growth thesis.

marsbit4m ago

STRC Major De-pegging's First Financial Report, How Will Strategy Repair Its Capital Flywheel?

marsbit4m ago

STRC's First Financial Report Post-Depegging, How is Strategy Restoring the Capital Flywheel?

On July 31, 2026, Bitcoin treasury company Strategy released its Q2 financial report. Despite a 6.9% year-over-year increase in revenue to $122 million, the company recorded a substantial net loss of $8.22 billion, primarily due to $8.32 billion in unrealized losses from Bitcoin holdings. While Strategy's core Bitcoin strategy remains intact—its holdings grew 11% to 843,775 BTC—the company is undergoing a fundamental shift in its capital model. Following the de-pegging of its key financing tool, the STRCoin (STRC), from its $100 target in May, Strategy has pivoted from a one-directional "raise funds, buy Bitcoin" cycle to a more dynamic, multi-asset capital management approach. A key part of this new framework is the "Monetization Program," through which Strategy has sold approximately $218.4 million worth of BTC to bolster liquidity. The company's top priority is repairing STRC's peg, committing not to issue discounted shares until it returns to its target range. It has initiated a $1 billion buyback program for discounted digital credit securities, having repurchased $28.9 million face value of STRC so far. Management aims to restore the peg around September 8, 2026. Strategy now actively manages a matrix of assets: Bitcoin (for accumulation or strategic sales), USD cash reserves (now at $3.75 billion), common stock (MSTR), and digital credit securities like STRC. This allows for tactical moves like repurchasing discounted debt or equity to capture value. The future success of Strategy's "capital flywheel" hinges on two factors: the short-term ability to successfully re-peg STRC to restore market confidence in its digital credit system, and the long-term price trajectory of Bitcoin, upon which its entire investment thesis ultimately depends.

Odaily星球日报9m ago

STRC's First Financial Report Post-Depegging, How is Strategy Restoring the Capital Flywheel?

Odaily星球日报9m ago

With Two Consecutive Quarters of Losses, Coinbase Must Rely on Paths Beyond Trading

Coinbase posted its second consecutive quarterly net loss of $359 million on $1.22 billion in revenue for Q2, highlighting its vulnerability to crypto market cycles where weaker prices and lower volatility reduce user trading. However, the report also reveals a strategic shift in its business model. Despite a 25% quarter-over-quarter decline in global spot trading volume, Coinbase increased its market share to a company-record 10.3%. This suggests its position as a compliant U.S. on-ramp is strengthening even in a cooler market. A key development is the diversification of revenue streams. Transaction revenue fell to $599 million, nearly equaling subscription and services revenue of $555 million. Stablecoin services, generating $292 million, are becoming a crucial revenue "floor." This income, derived from interest on the $20 billion average USDC balance held on its platform, is less tied to daily trading activity. Furthermore, while spot trading volume dropped significantly, derivatives volume held steady at $1.03 trillion. Coinbase is pushing to integrate spot, stablecoin, and derivatives liquidity to create a more interconnected and sticky ecosystem for users. The GAAP net loss includes non-cash expenses like stock-based compensation and crypto asset valuation changes. Its adjusted EBITDA remained positive at $208 million for the 14th straight quarter, indicating core operations can cover ongoing costs. The company is also reducing expenses to manage the downturn. The central question moving forward is whether Coinbase's growing market share, stablecoin revenues, and expanding product integration can sufficiently offset the inherent cyclicality of its core trading business during future market contractions.

marsbit24m ago

With Two Consecutive Quarters of Losses, Coinbase Must Rely on Paths Beyond Trading

marsbit24m ago

Trading

Spot

Hot Articles

What is $BITCOIN

DIGITAL GOLD ($BITCOIN): A Comprehensive Analysis Introduction to DIGITAL GOLD ($BITCOIN) DIGITAL GOLD ($BITCOIN) is a blockchain-based project operating on the Solana network, which aims to combine the characteristics of traditional precious metals with the innovation of decentralized technologies. While it shares a name with Bitcoin, often referred to as “digital gold” due to its perception as a store of value, DIGITAL GOLD is a separate token designed to create a unique ecosystem within the Web3 landscape. Its goal is to position itself as a viable alternative digital asset, although specifics regarding its applications and functionalities are still developing. What is DIGITAL GOLD ($BITCOIN)? DIGITAL GOLD ($BITCOIN) is a cryptocurrency token explicitly designed for use on the Solana blockchain. In contrast to Bitcoin, which provides a widely recognized value storage role, this token appears to focus on broader applications and characteristics. Notable aspects include: Blockchain Infrastructure: The token is built on the Solana blockchain, known for its capacity to handle high-speed and low-cost transactions. Supply Dynamics: DIGITAL GOLD has a maximum supply capped at 100 quadrillion tokens (100P $BITCOIN), although details regarding its circulating supply are currently undisclosed. Utility: While precise functionalities are not explicitly outlined, there are indications that the token could be utilized for various applications, potentially involving decentralized applications (dApps) or asset tokenization strategies. Who is the Creator of DIGITAL GOLD ($BITCOIN)? At present, the identity of the creators and development team behind DIGITAL GOLD ($BITCOIN) remains unknown. This situation is typical among many innovative projects within the blockchain space, particularly those aligning with decentralized finance and meme coin phenomena. While such anonymity may foster a community-driven culture, it intensifies concerns about governance and accountability. Who are the Investors of DIGITAL GOLD ($BITCOIN)? The available information indicates that DIGITAL GOLD ($BITCOIN) does not have any known institutional backers or prominent venture capital investments. The project seems to operate on a peer-to-peer model focused on community support and adoption rather than traditional funding routes. Its activity and liquidity are primarily situated on decentralized exchanges (DEXs), such as PumpSwap, rather than established centralized trading platforms, further highlighting its grassroots approach. How DIGITAL GOLD ($BITCOIN) Works The operational mechanics of DIGITAL GOLD ($BITCOIN) can be elaborated on based on its blockchain design and network attributes: Consensus Mechanism: By leveraging Solana’s unique proof-of-history (PoH) combined with a proof-of-stake (PoS) model, the project ensures efficient transaction validation contributing to the network's high performance. Tokenomics: While specific deflationary mechanisms have not been extensively detailed, the vast maximum token supply implies that it may cater to microtransactions or niche use cases that are still to be defined. Interoperability: There exists the potential for integration with Solana’s broader ecosystem, including various decentralized finance (DeFi) platforms. However, the details regarding specific integrations remain unspecified. Timeline of Key Events Here is a timeline that highlights significant milestones concerning DIGITAL GOLD ($BITCOIN): 2023: The initial deployment of the token occurs on the Solana blockchain, marked by its contract address. 2024: DIGITAL GOLD gains visibility as it becomes available for trading on decentralized exchanges like PumpSwap, allowing users to trade it against SOL. 2025: The project witnesses sporadic trading activity and potential interest in community-led engagements, although no noteworthy partnerships or technical advancements have been documented as of yet. Critical Analysis Strengths Scalability: The underlying Solana infrastructure supports high transaction volumes, which could enhance the utility of $BITCOIN in various transaction scenarios. Accessibility: The potential low trading price per token could attract retail investors, facilitating wider participation due to fractional ownership opportunities. Risks Lack of Transparency: The absence of publicly known backers, developers, or an audit process may yield skepticism regarding the project's sustainability and trustworthiness. Market Volatility: The trading activity is heavily reliant on speculative behavior, which can result in significant price volatility and uncertainty for investors. Conclusion DIGITAL GOLD ($BITCOIN) emerges as an intriguing yet ambiguous project within the rapidly evolving Solana ecosystem. While it attempts to leverage the “digital gold” narrative, its departure from Bitcoin's established role as a store of value underscores the need for a clearer differentiation of its intended utility and governance structure. Future acceptance and adoption will likely depend on addressing the current opacity and defining its operational and economic strategies more explicitly. Note: This report encompasses synthesised information available as of October 2023, and developments may have transpired beyond the research period.

1.1k Total ViewsPublished 2025.05.13Updated 2025.05.13

What is $BITCOIN

Discussions

Welcome to the HTX Community. Here, you can stay informed about the latest platform developments and gain access to professional market insights. Users' opinions on the price of BTC (BTC) are presented below.

活动图片