With Two Consecutive Quarters of Losses, Coinbase Must Rely on Paths Beyond Trading

marsbitPublished on 2026-07-31Last updated on 2026-07-31

Abstract

Coinbase posted its second consecutive quarterly net loss of $359 million on $1.22 billion in revenue for Q2, highlighting its vulnerability to crypto market cycles where weaker prices and lower volatility reduce user trading. However, the report also reveals a strategic shift in its business model. Despite a 25% quarter-over-quarter decline in global spot trading volume, Coinbase increased its market share to a company-record 10.3%. This suggests its position as a compliant U.S. on-ramp is strengthening even in a cooler market. A key development is the diversification of revenue streams. Transaction revenue fell to $599 million, nearly equaling subscription and services revenue of $555 million. Stablecoin services, generating $292 million, are becoming a crucial revenue "floor." This income, derived from interest on the $20 billion average USDC balance held on its platform, is less tied to daily trading activity. Furthermore, while spot trading volume dropped significantly, derivatives volume held steady at $1.03 trillion. Coinbase is pushing to integrate spot, stablecoin, and derivatives liquidity to create a more interconnected and sticky ecosystem for users. The GAAP net loss includes non-cash expenses like stock-based compensation and crypto asset valuation changes. Its adjusted EBITDA remained positive at $208 million for the 14th straight quarter, indicating core operations can cover ongoing costs. The company is also reducing expenses to manage the downturn. The ...

U.S. crypto trading platform Coinbase delivered an earnings report that's easy to misinterpret. In the second quarter, total revenue fell to $1.22 billion, with a GAAP net loss of $359 million. According to the earnings report supplement Coinbase filed with the U.S. Securities and Exchange Commission on July 30th, this marks the company's second consecutive quarter of net losses.

Looking solely at the income statement, the story seems familiar—the crypto cycle. Weak coin prices, declining volatility, reduced user trading, and consequently shrinking exchange revenue. But there's another narrative in this report. According to Coinbase's disclosure, its share of the crypto trading volume market rose to 10.3%, setting a new company-record high. In a receding quarter, it captured more traffic.

Coinbase's cyclicality hasn't disappeared; it's just that it no longer completely mirrors the cyclicality of spot trading. Market share, stablecoins, and derivatives are now splitting the company's revenue and liquidity sources into several distinct streams.

Why Does the Platform Grow Stronger as the Market Cools Down?
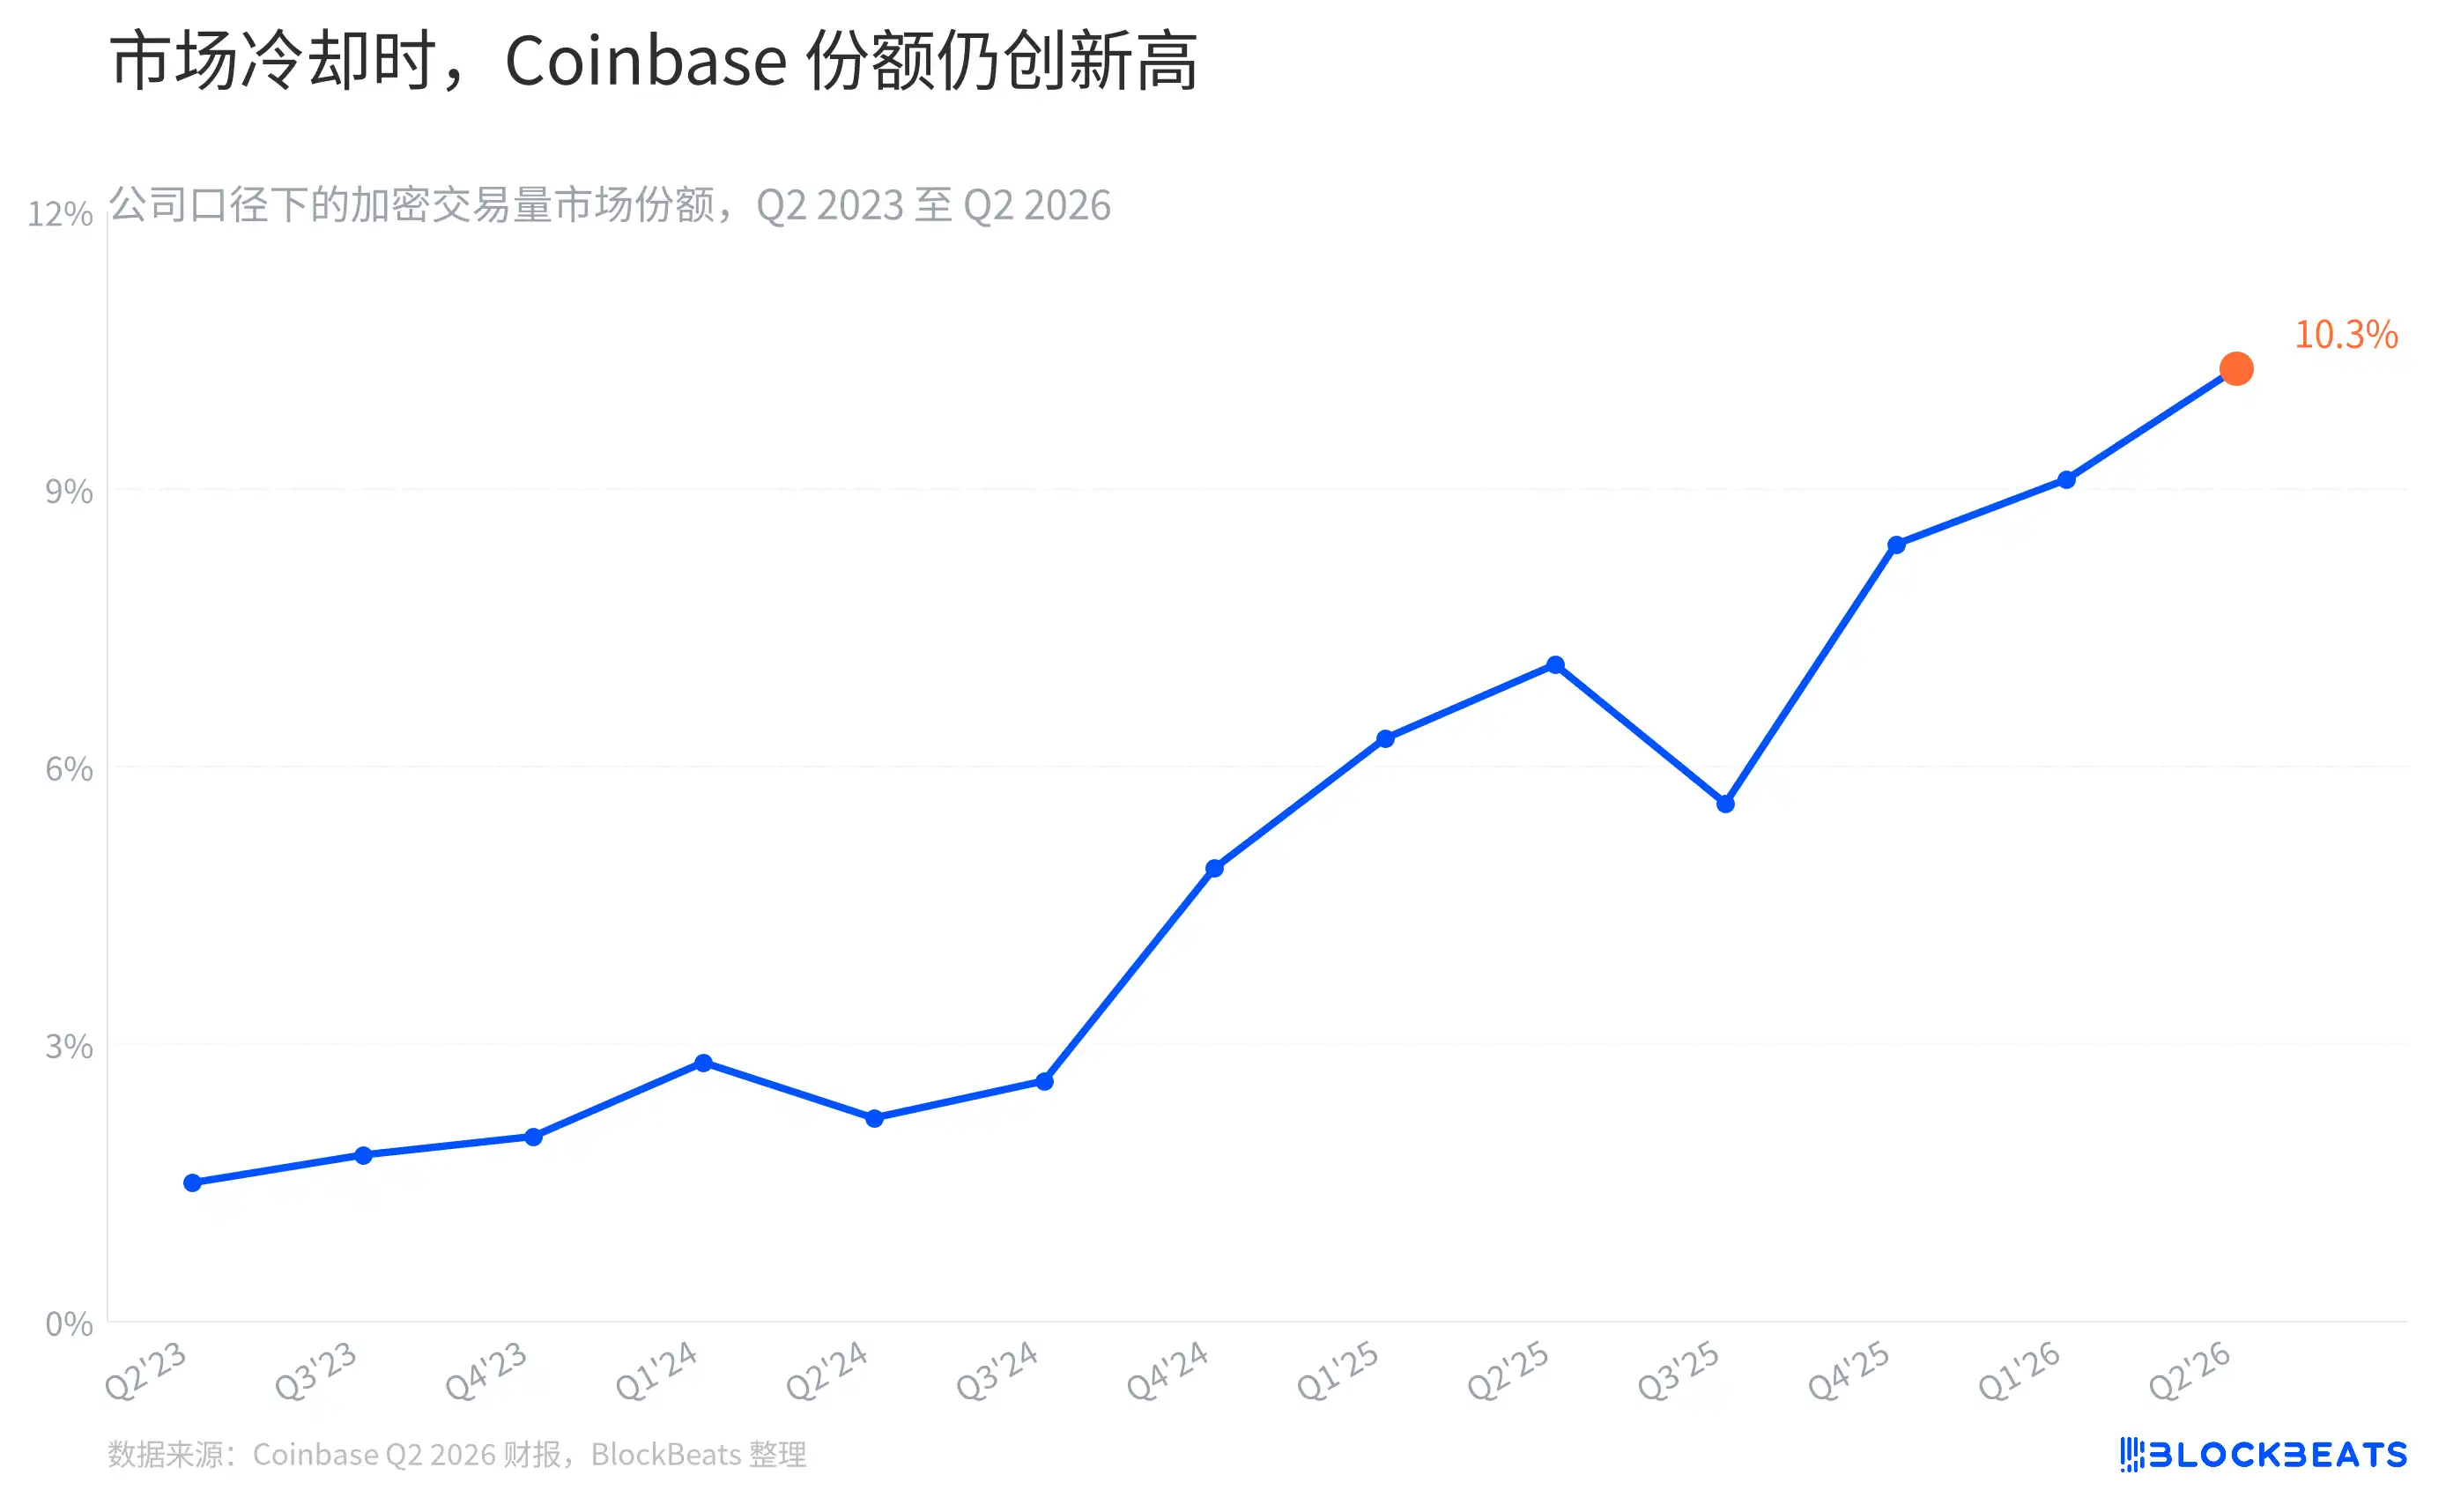
In the second quarter, the global crypto spot trading volume metric used by Coinbase fell 25% quarter-over-quarter. Yet, according to the company's earnings report, Coinbase's market share during the same period climbed from 9.1% in Q1 to 10.3%. Less revenue doesn't mean the platform's relative position has worsened.

Exchanges aren't fighting over a static pie. When the market is hot, retail investors flood in, and liquidity naturally thickens. When the market is dull, the users who remain test the platform's depth, product offerings, and compliant access channels. Coinbase's strongest tag has been its status as the compliant U.S. on-ramp. The current market share curve indicates this on-ramp is attracting a larger portion of trading activity.

However, this curve has its limits. Market share is Coinbase's internal calculation based on data from sources like CoinDesk Data, CoinMetrics, Dune, and Tardis, and includes stablecoin conversion activities. It's suitable for observing changes in its own competitiveness but should not be taken as the sole industry-wide market share standard.

What's Supporting Trading Revenue?
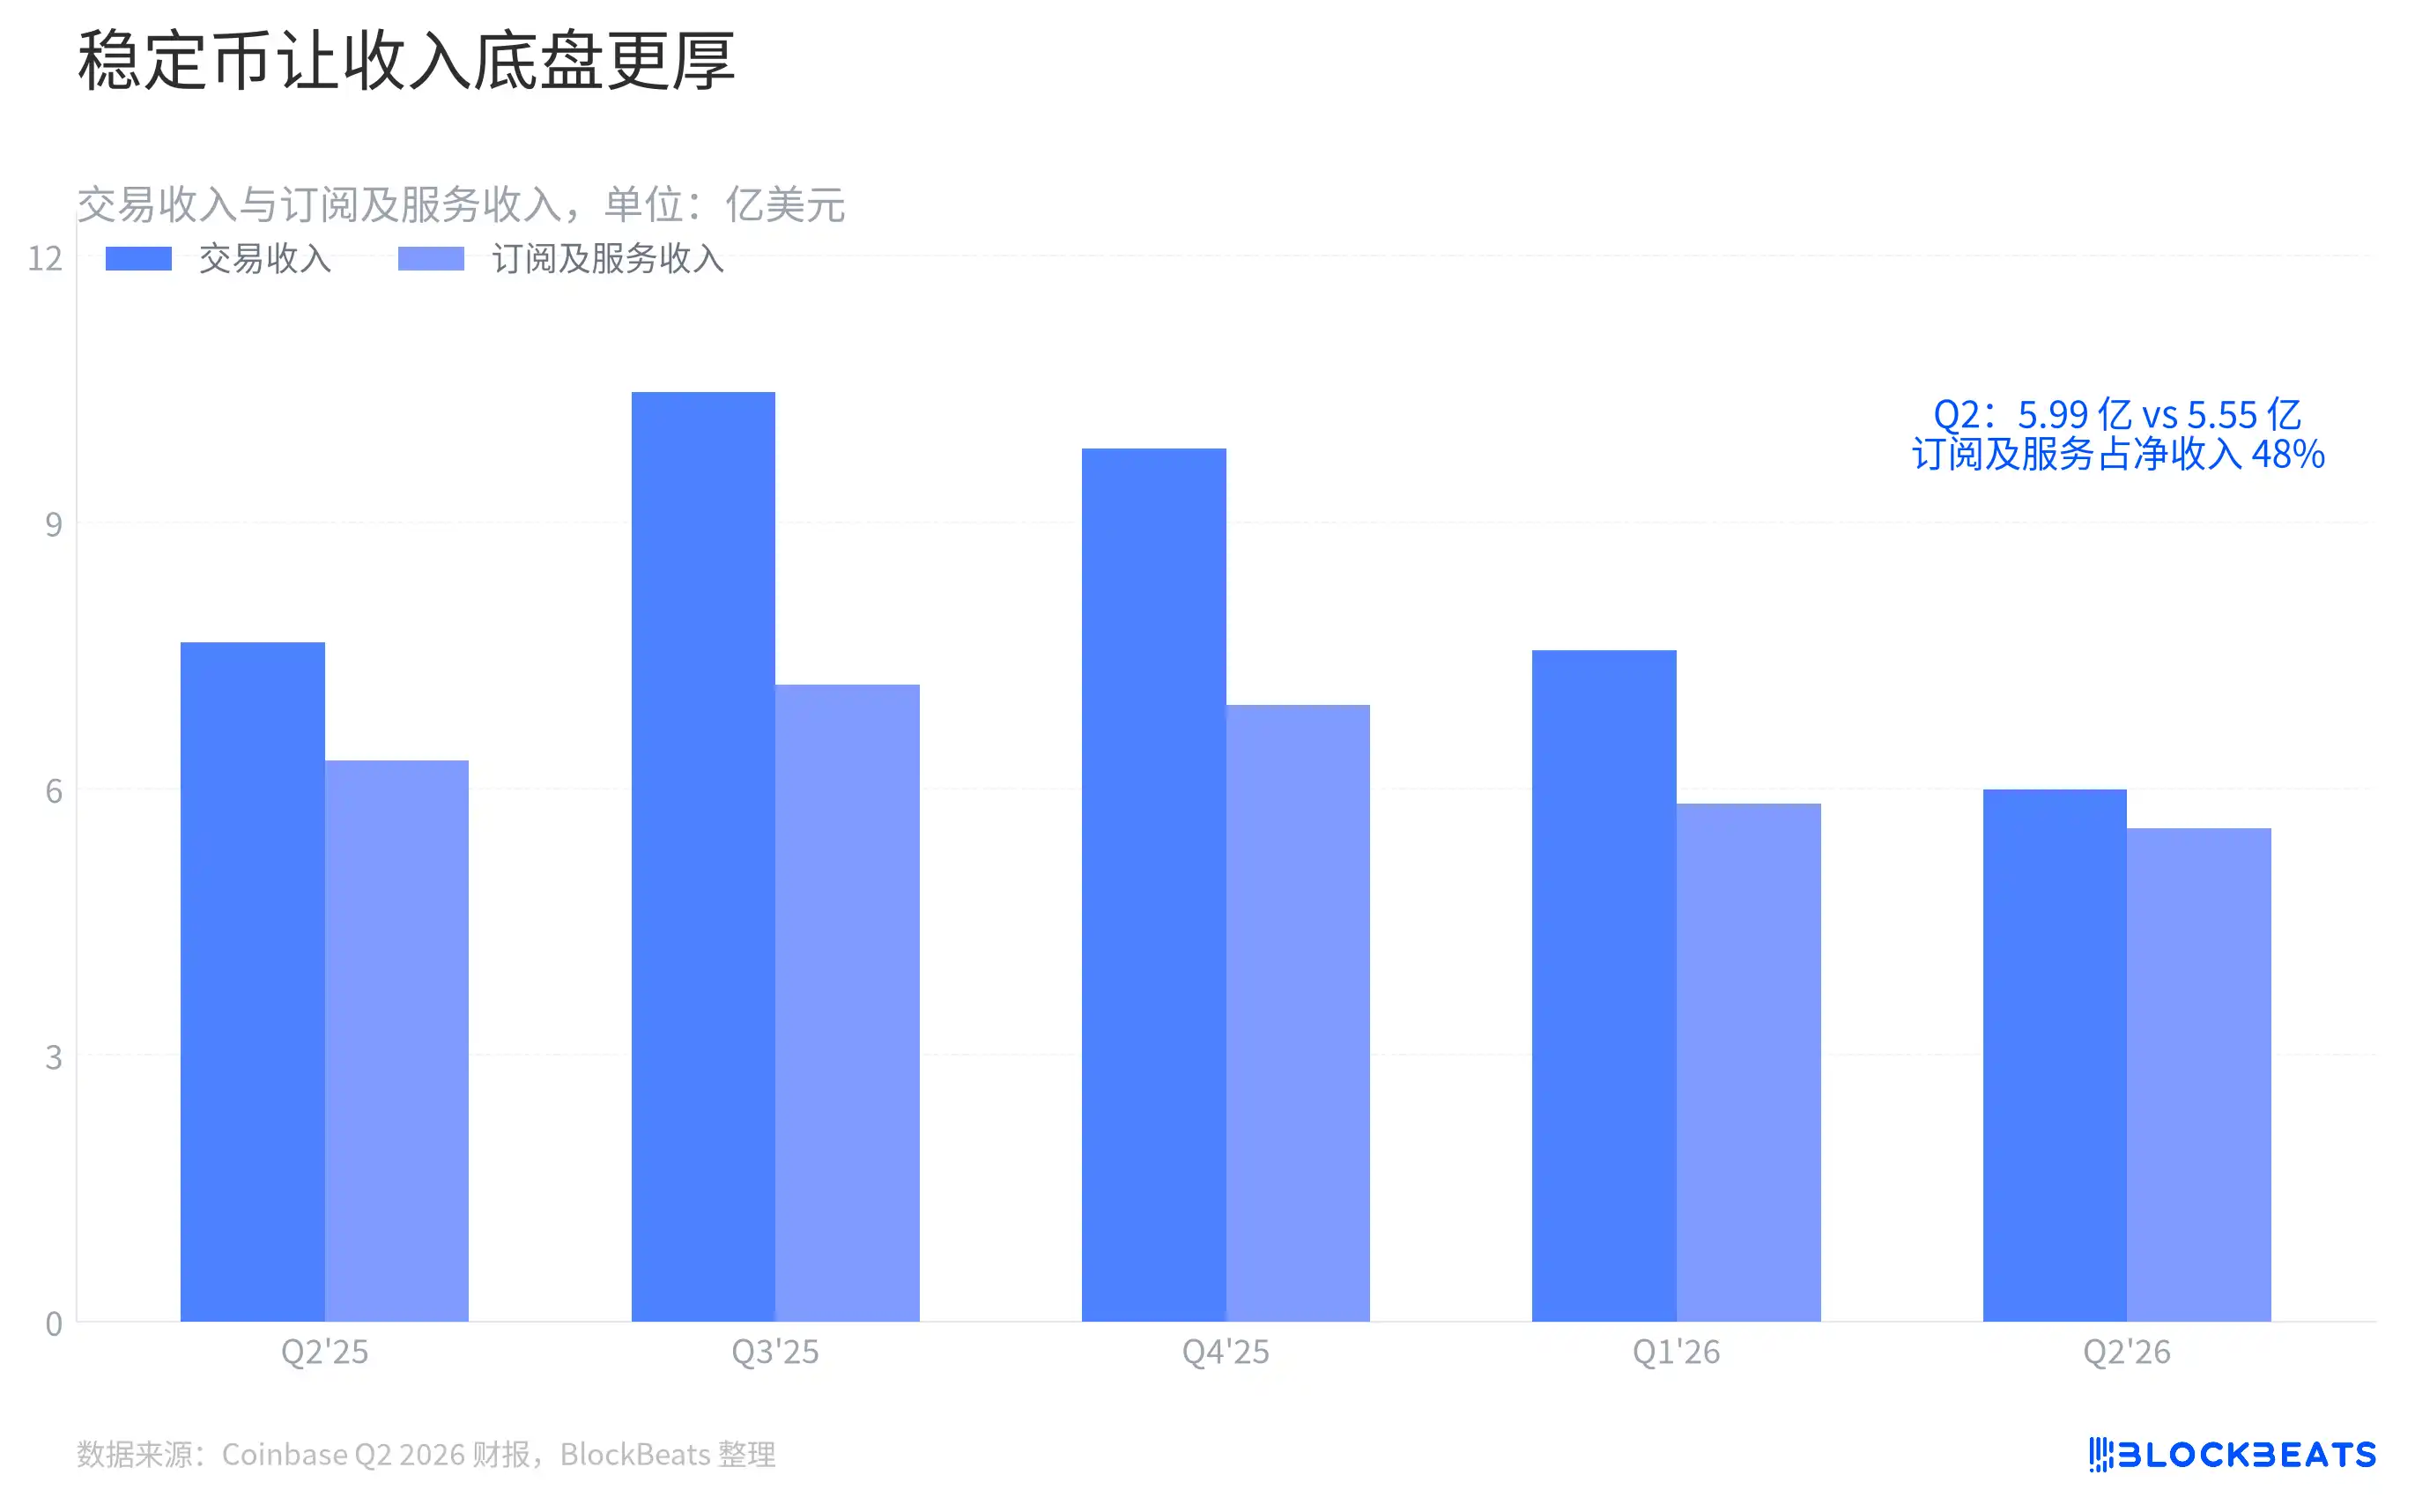
According to Coinbase's earnings report, second-quarter transaction revenue was $599 million, while subscription and services revenue was $555 million. The gap between them is now just a narrow sliver. In the past, transaction revenue was the primary beam that rose swiftly during bull markets. Now, subscription, custody, staking, interest, and stablecoin businesses are forming another layer of foundational income.

The largest portion comes from stablecoins. The company disclosed that stablecoin revenue this quarter was $292 million. Its logic differs from spot commission fees. When users hold USDC within Coinbase's products, the platform can share in the interest from reserve assets and partnership proceeds. A transaction commission is one-time. Stablecoin balances remain, generating returns on a daily basis.

This change is not abstract. The average USDC balance within Coinbase's products has risen to $20 billion. According to the company, over 30% of USDC's circulating supply was within its products at quarter-end. For the exchange, this is akin to turning wallets that were only opened during market rallies into accounts where funds can be parked.

This also explains why subscription and services revenue accounted for 48% of net revenue this quarter. This isn't to say Coinbase has become immune to coin price influences. Interest rate changes, fluctuations in USDC market cap, and user willingness to hold stablecoins will still impact this revenue line. However, its rhythm no longer needs to sync perfectly with spot trading volume.

After Spot Volume Shrinks, Where Does Liquidity Go?
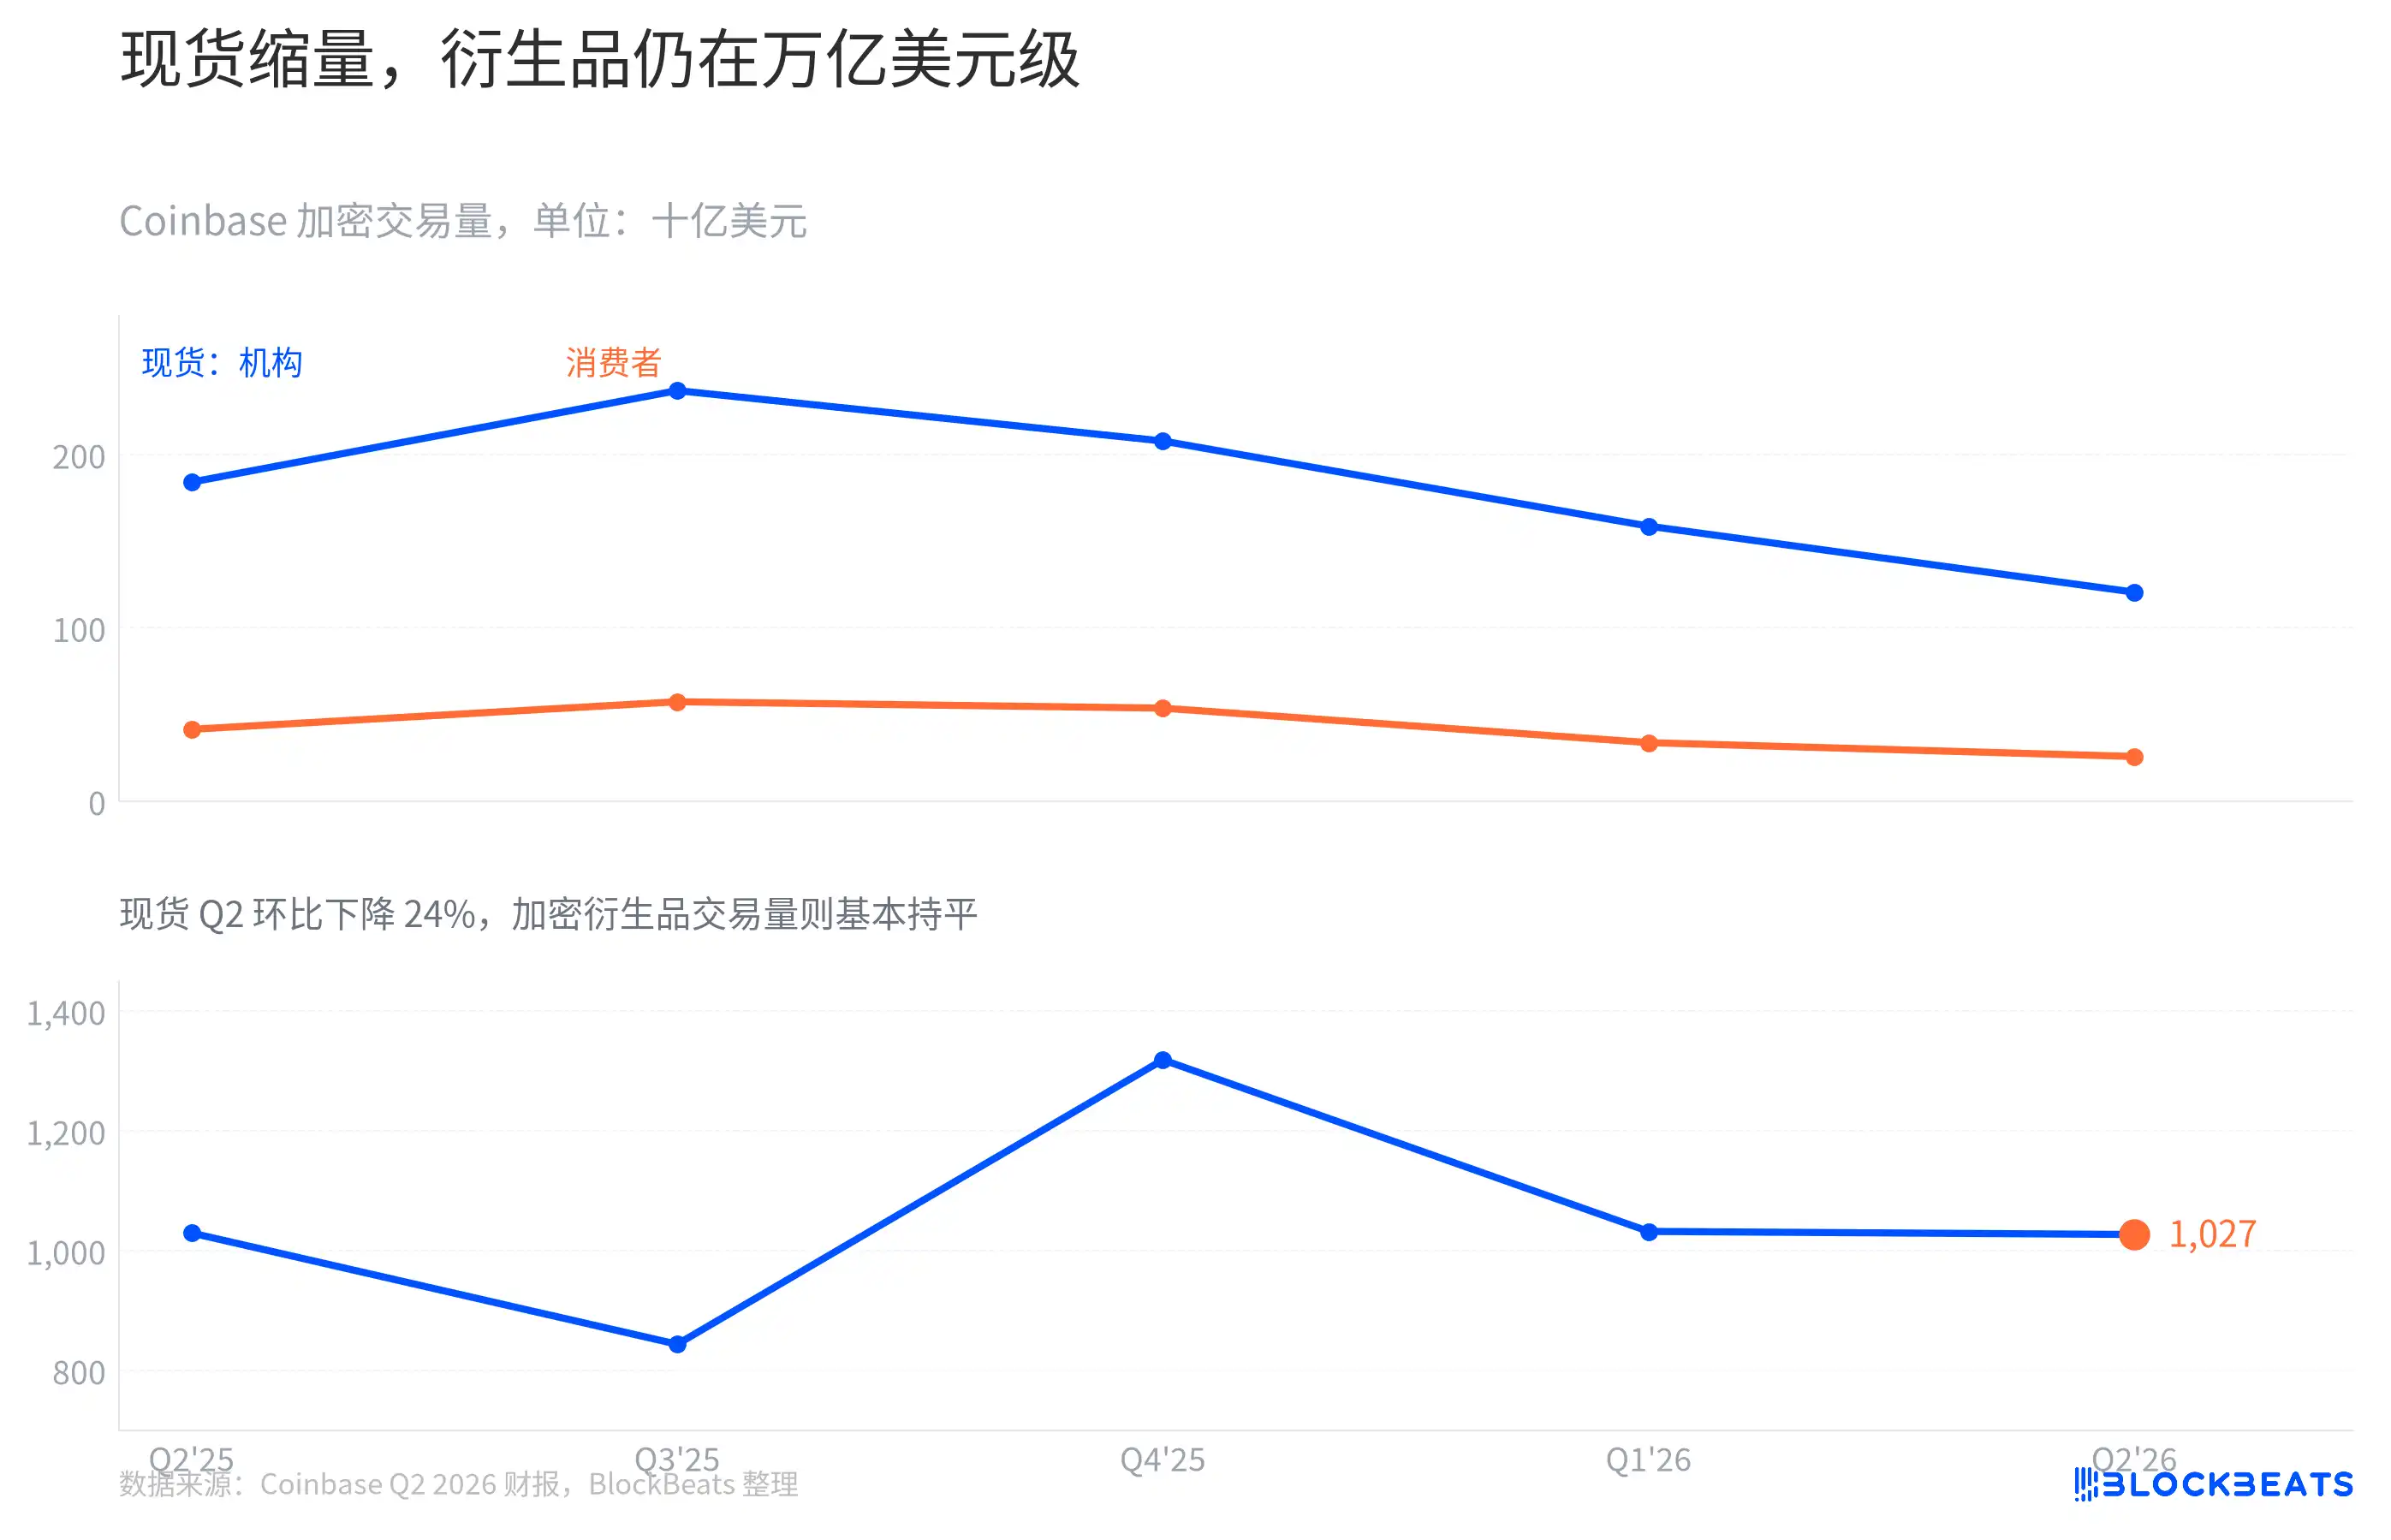
In the second quarter, Coinbase's crypto spot trading volume fell to $146.4 billion. Crypto derivatives trading volume remained at $1.03 trillion. According to the company's report, spot volume declined 24% quarter-over-quarter, while derivatives volume was largely flat.

This isn't a simple case of product substitution. Spot buying and selling are more akin to taking a directional bet on price, most likely to be postponed during low volatility. Derivatives serve purposes like leverage, hedging, and cross-market position adjustments; professional traders don't exit completely just because the market is quiet. Their trading volumes also can't be used directly to extrapolate revenue; derivatives are reported as notional amounts, and their fee structures and revenue recognition logic differ from spot.

Coinbase repeatedly emphasized global perpetual contracts, U.S. compliant access, and Deribit integration in its report. Its goal isn't just to add a derivatives tab next to the spot page; it's to enable one piece of collateral to support more trading needs. Once a platform can connect spot, stablecoins, and derivatives to the same pool of liquidity, the cost for users to leave is no longer just downloading another app.

Net Loss—Where Exactly Is the Loss?
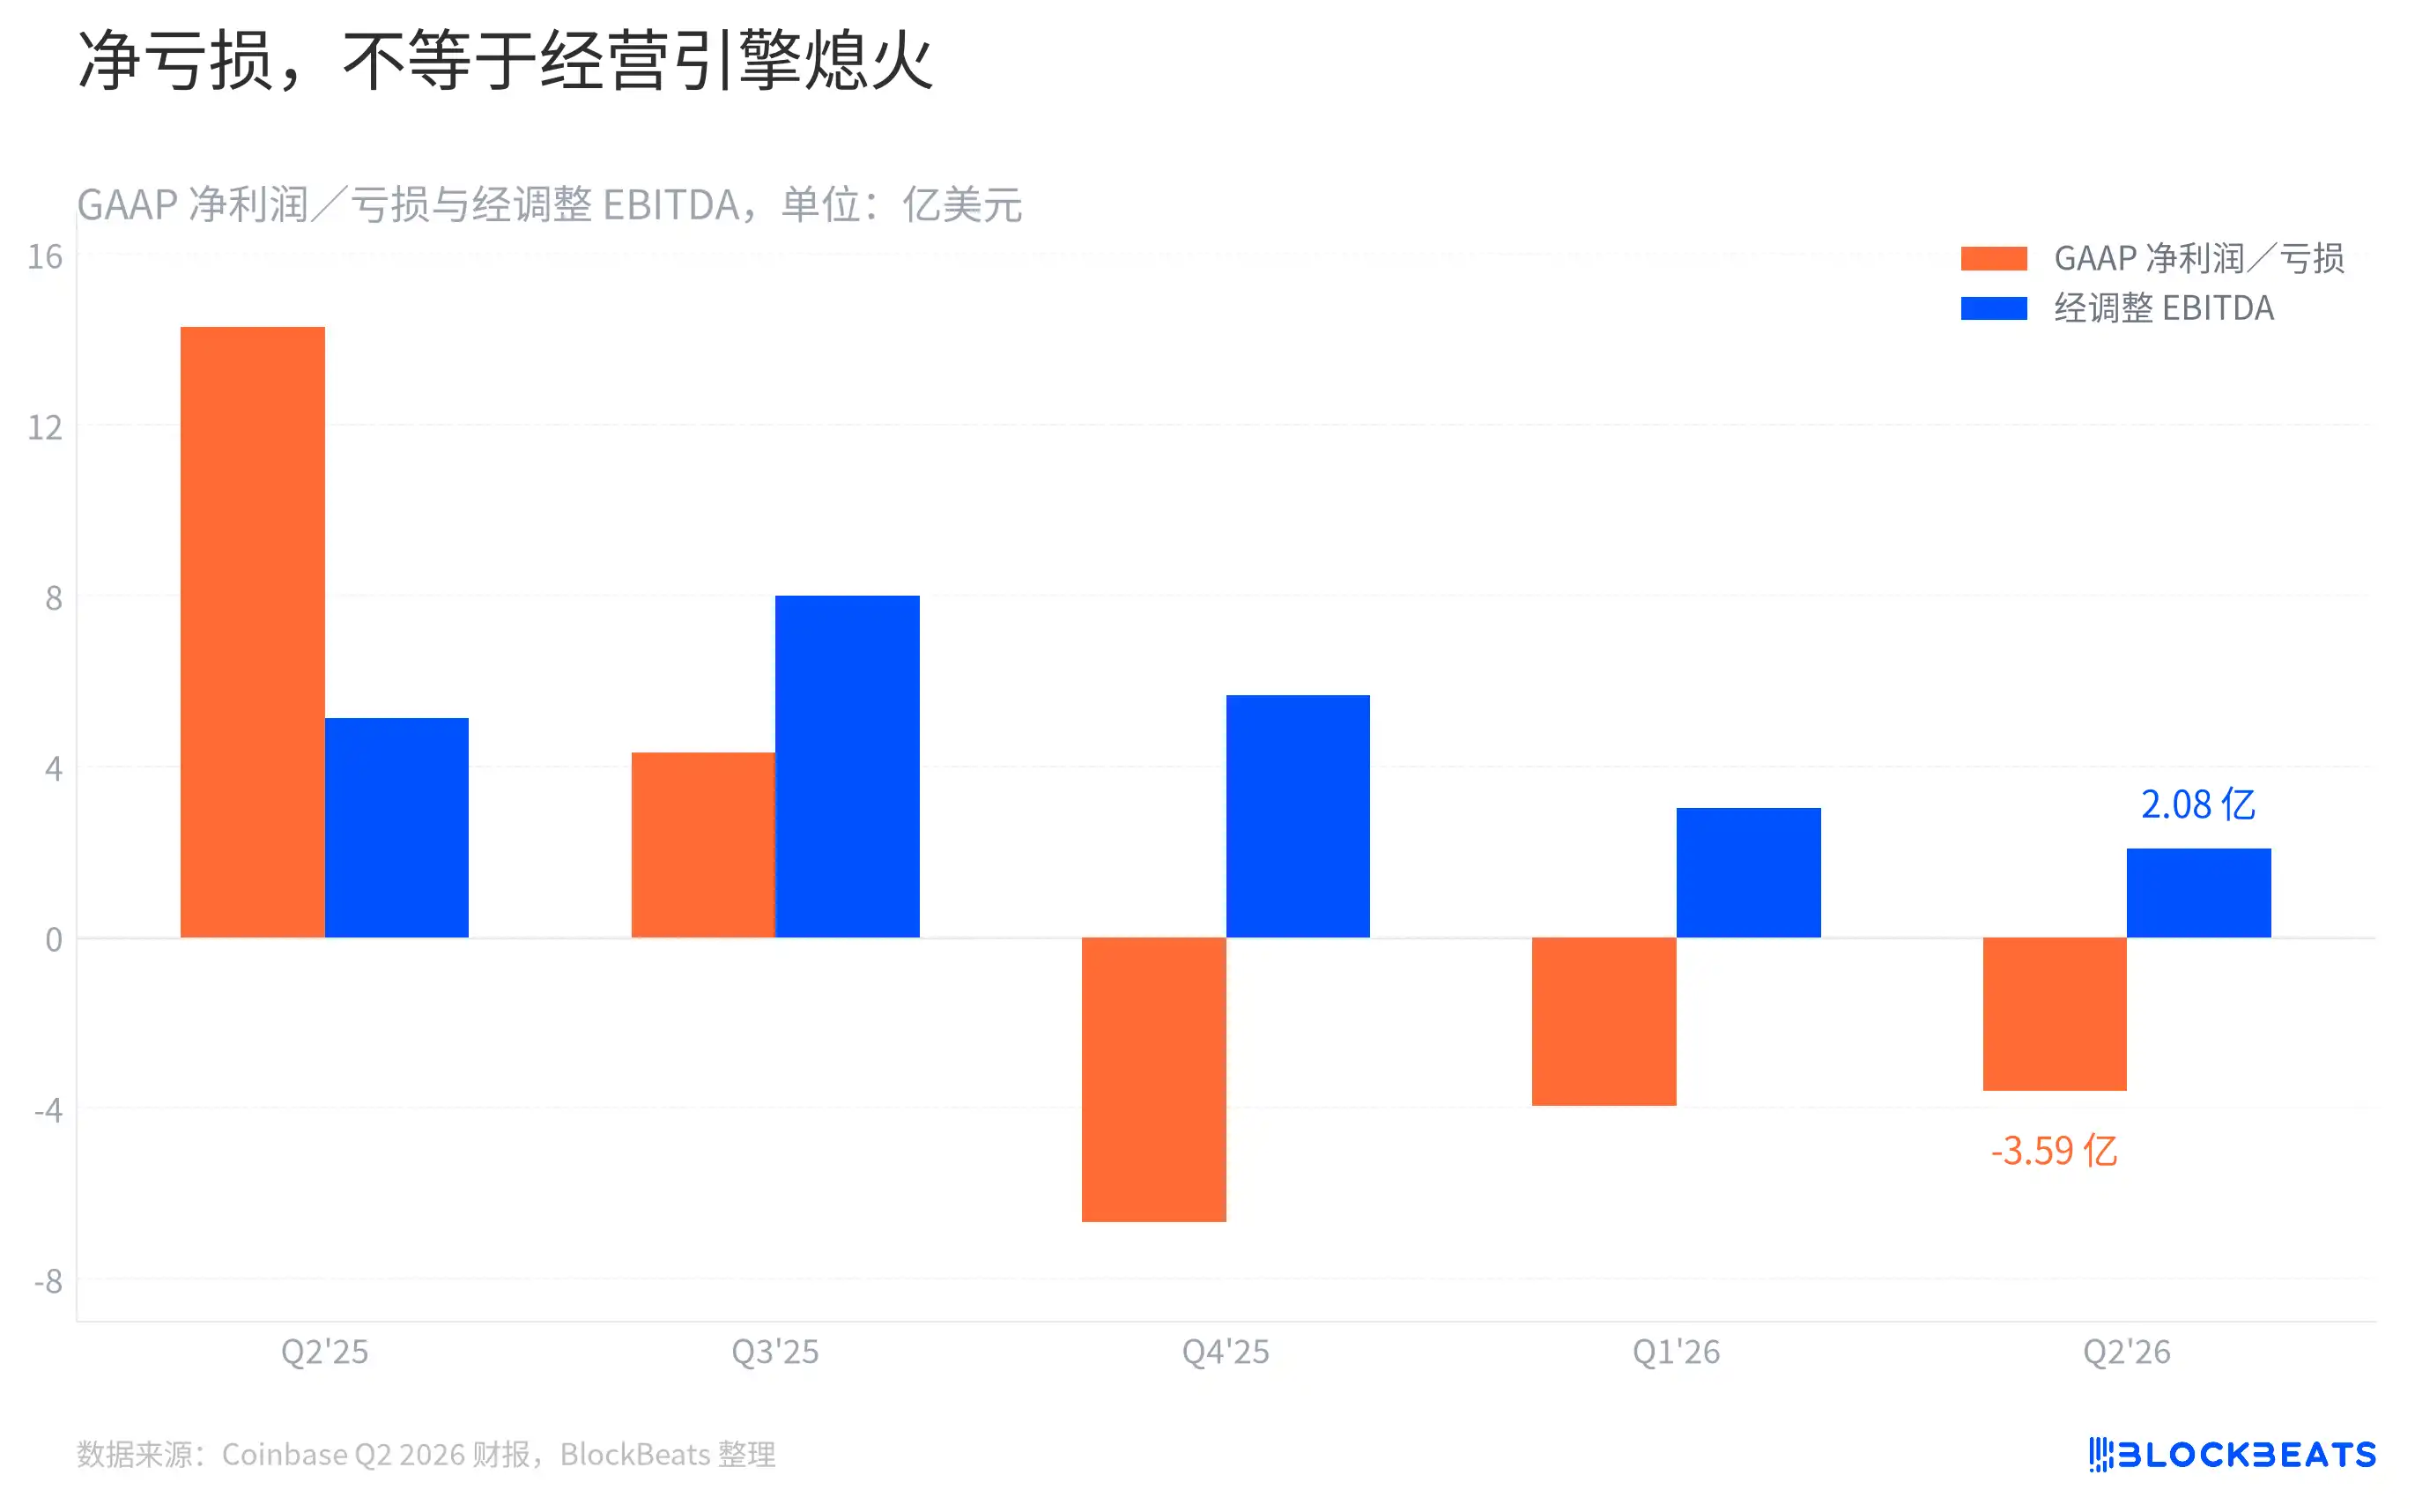
The GAAP net loss of $359 million this quarter is of course a real result. However, according to Coinbase's report, adjusted EBITDA for the same period remained positive at $208 million and has been positive for 14 consecutive quarters. The gap between these two bars is precisely what's most easily overlooked when reading the earnings report.

The GAAP income statement includes fair value changes of crypto asset investments, investment gains/losses, restructuring charges, and stock-based compensation in the current period's results. Adjusted EBITDA removes several of these items. It's a more direct gauge of whether operational activities can cover day-to-day costs in the period, but it's not an alternative scorecard to replace net profit.

According to the company's disclosure, the operating loss this quarter was $113 million, indicating that the decline in transaction revenue is still weighing on the profit side. Adjusted expenses decreased 9% quarter-over-quarter, and the full-year guidance for adjusted expenses was narrowed to $4.20 billion - $4.45 billion. Controlling expenses can reduce bleeding during low-volatility periods, but it cannot replace the validation of new revenue streams.

This is the real question left by Coinbase's earnings report. It has already proven it can gain market share even as the market cools and has stablecoins and derivatives keeping the platform afloat. The next time market trading volume declines, readers should watch not just how much revenue falls, but whether these new streams can continue channeling water into the same account.


Trending Cryptos

Related Questions

QAccording to the article, what were the main financial results for Coinbase in Q2?

AIn Q2, Coinbase reported total revenue falling to $1.22 billion and a GAAP net loss of $359 million, marking its second consecutive quarter of net loss.

QDespite a market downturn, what key competitive metric improved for Coinbase according to its internal calculations?

ACoinbase's share of global crypto spot trading volume (as calculated by the company) rose to 10.3% in Q2, a new record high under its methodology.

QWhat is the primary revenue driver for Coinbase's 'Subscriptions and services' income, specifically from stablecoins?

AThe primary driver is USDC. Coinbase earns interest and partnership revenue by holding USDC reserves for users. This income stream is based on the average balance held ($20 billion in Q2), not on transaction commissions.

QHow did trading activity in spot markets versus derivatives markets differ for Coinbase in Q2, and what does the article suggest is the reason?

ASpot trading volume fell 24% to $146.4 billion, while derivatives volume remained roughly flat at $1.03 trillion. The article suggests derivatives are less sensitive to low volatility as they serve needs like hedging and leverage for professional traders who remain active even in quiet markets.

QWhat is the key difference between Coinbase's GAAP net loss and its Adjusted EBITDA for Q2, and what does this indicate about its core operations?

AThe GAAP net loss of $359 million includes items like investment gains/losses and stock-based compensation. Adjusted EBITDA, which was positive at $208 million, excludes these to show that its core business operations were still generating cash to cover ongoing costs for the 14th consecutive quarter.

Related Reads

Global Market Share Survey: Japanese Firms Lead in Semiconductor Materials

Global Market Share Survey: Japanese Firms Lead in Semiconductor Materials According to the 2025 "Major Goods and Services Market Share Survey" by Nikkei, Japanese companies maintain strong positions in semiconductor-related materials. In silicon wafers, Shin-Etsu Chemical ranks first with a 26.3% share, followed by SUMCO at 17.8%. Together, they hold 44.1% of the market, widening their lead over competitors from Taiwan, Germany, and South Korea. In photoresists, Tokyo Ohka Kogyo, JSR, and Shin-Etsu Chemical occupy the top three spots, with a combined share of 60.5%. Despite their strength in materials, Japanese firms have a weaker presence in core semiconductor segments like DRAM and NAND flash memory, where South Korean and U.S. companies dominate. For instance, SK Hynix and Samsung lead in DRAM, while China’s CXMT doubled its share to 6% in 2025. The semiconductor market is projected to grow rapidly, with WSTS forecasting a 90% increase to $1.5112 trillion by 2026. Major players like Samsung, SK Hynix, and Micron are making massive investments to expand capacity. To maintain their edge in materials, Japanese companies must similarly commit to large-scale, risk-taking investments. In contrast, Japan’s automotive sector shows stagnation. Toyota remains the global leader but with only a slight share increase to 12.3%, while Japanese brands are absent from the top five in the EV market. In shipbuilding, Imabari Shipbuilding rose to third place globally with a 7.2% share, benefiting from large container ship deliveries. However, Chinese and South Korean firms dominate the sector, holding the top two positions. Japan aims to revitalize its shipbuilding industry through government and corporate efforts, targeting a near doubling of output by 2035. Addressing labor shortages and adopting advanced technologies like physical AI will be critical for competitiveness.

marsbit10m ago

Global Market Share Survey: Japanese Firms Lead in Semiconductor Materials

marsbit10m ago

STRC Major De-pegging's First Financial Report, How Will Strategy Repair Its Capital Flywheel?

Bitcoin treasury company Strategy released its Q2 2026 earnings report on July 31. Despite a 6.9% year-over-year revenue increase to $122 million, the company recorded a net loss of $8.22 billion, largely due to $8.32 billion in unrealized losses from Bitcoin price fluctuations. As of quarter-end, Strategy holds 843,775 BTC with an average cost of $75,000 per coin, and Bitcoin per share increased. The report highlights a critical shift in Strategy's capital model following the de-pegging of its key financing tool, STRC (Strategic Coin), which fell below its $100 target. Management's top priority is restoring STRC to its target value, aiming for a recovery by September 8. They rule out discounted STRC issuances and plan to maintain its dividend yield at 12%, instead focusing on bolstering its $3.75 billion cash reserve. Strategy has moved from a one-way "buy-and-hold" Bitcoin strategy to active capital management. This new approach, part of its "Digital Credit Capital Framework," involves flexibly managing its balance sheet across four elements: BTC, USD cash, common stock (MSTR), and digital credit securities like STRC. This allows for BTC monetization (having sold $218.4 million in BTC so far), strategic repurchases of discounted securities, and debt optimization, as seen with a $1.5 billion convertible bond buyback. The company's future hinges on two key tests: successfully re-pegging STRC to restore market confidence in its digital credit system, and a long-term recovery in Bitcoin's price to ultimately support its growth thesis.

marsbit54m ago

STRC Major De-pegging's First Financial Report, How Will Strategy Repair Its Capital Flywheel?

marsbit54m ago

STRC's First Financial Report Post-Depegging, How is Strategy Restoring the Capital Flywheel?

On July 31, 2026, Bitcoin treasury company Strategy released its Q2 financial report. Despite a 6.9% year-over-year increase in revenue to $122 million, the company recorded a substantial net loss of $8.22 billion, primarily due to $8.32 billion in unrealized losses from Bitcoin holdings. While Strategy's core Bitcoin strategy remains intact—its holdings grew 11% to 843,775 BTC—the company is undergoing a fundamental shift in its capital model. Following the de-pegging of its key financing tool, the STRCoin (STRC), from its $100 target in May, Strategy has pivoted from a one-directional "raise funds, buy Bitcoin" cycle to a more dynamic, multi-asset capital management approach. A key part of this new framework is the "Monetization Program," through which Strategy has sold approximately $218.4 million worth of BTC to bolster liquidity. The company's top priority is repairing STRC's peg, committing not to issue discounted shares until it returns to its target range. It has initiated a $1 billion buyback program for discounted digital credit securities, having repurchased $28.9 million face value of STRC so far. Management aims to restore the peg around September 8, 2026. Strategy now actively manages a matrix of assets: Bitcoin (for accumulation or strategic sales), USD cash reserves (now at $3.75 billion), common stock (MSTR), and digital credit securities like STRC. This allows for tactical moves like repurchasing discounted debt or equity to capture value. The future success of Strategy's "capital flywheel" hinges on two factors: the short-term ability to successfully re-peg STRC to restore market confidence in its digital credit system, and the long-term price trajectory of Bitcoin, upon which its entire investment thesis ultimately depends.

Odaily星球日报59m ago

STRC's First Financial Report Post-Depegging, How is Strategy Restoring the Capital Flywheel?

Odaily星球日报59m ago

Trading

Spot

Hot Articles

How to Buy T

Welcome to HTX.com! We've made purchasing Threshold Network Token (T) simple and convenient. Follow our step-by-step guide to embark on your crypto journey.Step 1: Create Your HTX AccountUse your email or phone number to sign up for a free account on HTX. Experience a hassle-free registration journey and unlock all features.Get My AccountStep 2: Go to Buy Crypto and Choose Your Payment MethodCredit/Debit Card: Use your Visa or Mastercard to buy Threshold Network Token (T) instantly.Balance: Use funds from your HTX account balance to trade seamlessly.Third Parties: We've added popular payment methods such as Google Pay and Apple Pay to enhance convenience.P2P: Trade directly with other users on HTX.Over-the-Counter (OTC): We offer tailor-made services and competitive exchange rates for traders.Step 3: Store Your Threshold Network Token (T)After purchasing your Threshold Network Token (T), store it in your HTX account. Alternatively, you can send it elsewhere via blockchain transfer or use it to trade other cryptocurrencies.Step 4: Trade Threshold Network Token (T)Easily trade Threshold Network Token (T) on HTX's spot market. Simply access your account, select your trading pair, execute your trades, and monitor in real-time. We offer a user-friendly experience for both beginners and seasoned traders.

12.6k Total ViewsPublished 2024.03.29Updated 2026.06.02

How to Buy T

Discussions

Welcome to the HTX Community. Here, you can stay informed about the latest platform developments and gain access to professional market insights. Users' opinions on the price of T (T) are presented below.

活动图片