Bitcoin: Retail FOMO is back – Here’s why that’s bad news for BTC

ambcryptoPublished on 2026-03-20Last updated on 2026-03-20

Abstract

Bitcoin faces renewed retail FOMO around the $70k resistance level, which may signal bearish pressure rather than bullish momentum. Recent data shows over $130 million in hourly inflows to Binance, indicating speculative trading. Coupled with increasing short positions and a declining CVD (indicating weak spot demand), this suggests traders are chasing fear and taking profits rather than genuine accumulation. Although stablecoin market caps have rebounded, providing liquidity, the lack of strong follow-through makes a breakout above $75k unlikely. Retail behavior currently represents a key vulnerability for BTC.

Whenever the market hits resistance, people naturally start watching for FOMO.

Presently, Bitcoin [BTC] is hovering around $70k, having dropped about 3.5% over the past week. That’s a classic sign of weak follow-through, leaving the market split between those looking to “buy the dip” and those holding onto recent gains.

AMBCrypto recently highlighted that 48k BTC moved out of STHs, showing many traders were quick to take profits rather than chase FOMO. Moreover, a recent CryptoQuant report offered a deeper look into retail behavior, showing patterns of inflows that often line up with market turning points.
Source: CryptoQuant

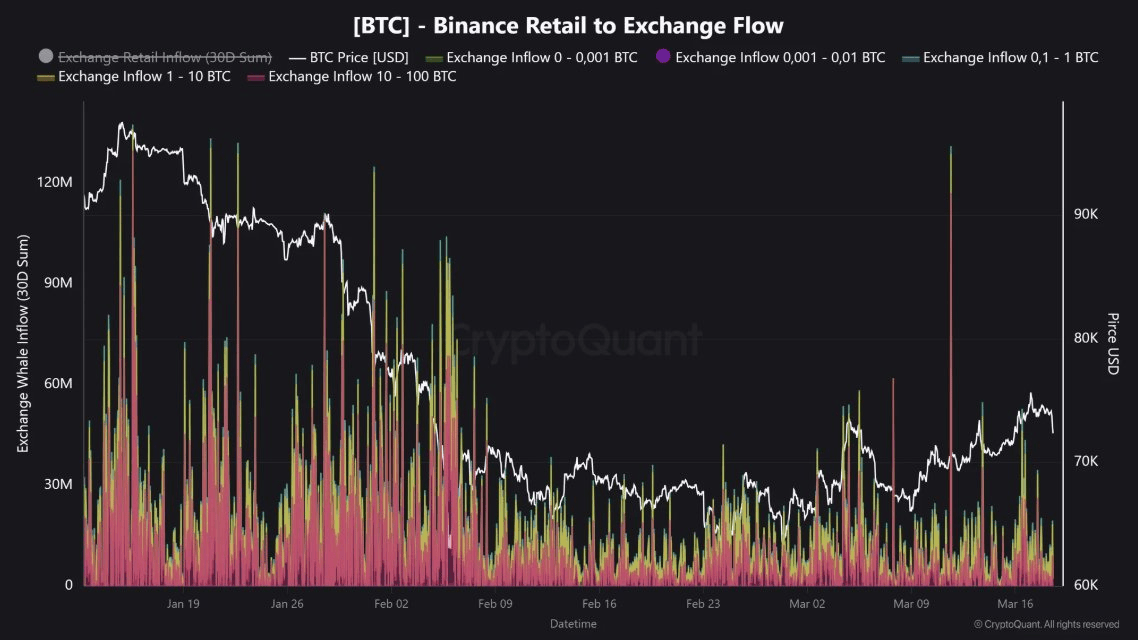
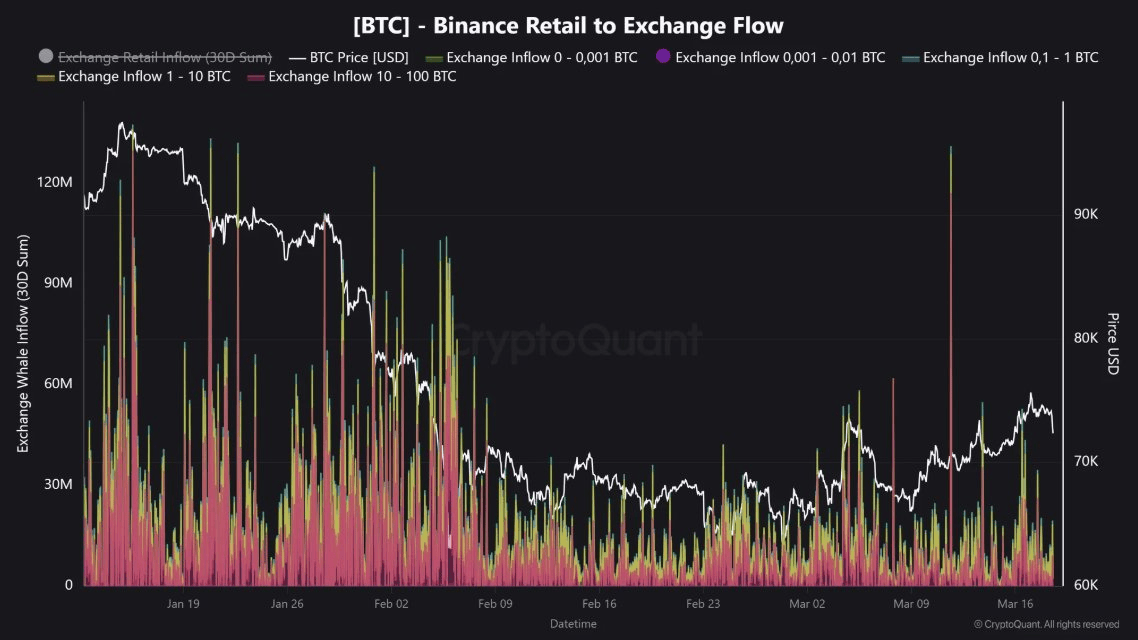
Looking at the chart above, Binance is seeing some serious retail activity. On the 11th of March, a massive $131.8 million flowed into the exchange in just one hour. However, that momentum didn’t stop there: About $55 million came in on the 13th of March, followed by another $50 million three days later.

From a technical standpoint, spikes like this usually mean retail traders are moving funds onto the exchange to trade, whether chasing momentum, taking profits, or setting up short-term positions.

According to AMBCrypto, these inflows act as a key signal for spotting FOMO, especially around Bitcoin’s $70k level.

Notably, when layered with other indicators, they provide a clearer view of where the market is headed.

Retail frenzy raises questions about Bitcoin’s breakout

The recent retail moves into Binance aren’t happening in isolation.

Take the $50 million inflow on the 16th of March. Technically, it lined up with Bitcoin hitting resistance at $75k, kicking off three days of declines, triggering long-liquidation sweeps, and pushing BTC down to $70k. Now, it looks like “speculative FOMO” is creeping back in.
Source: CryptoQuant

CoinGlass data shows fresh shorts piling up, while a falling CVD points to weak Spot demand. In other words, bears are leaning into the downside, and the surge in retail inflows suggests traders are chasing momentum, taking positions even as the market signals caution.

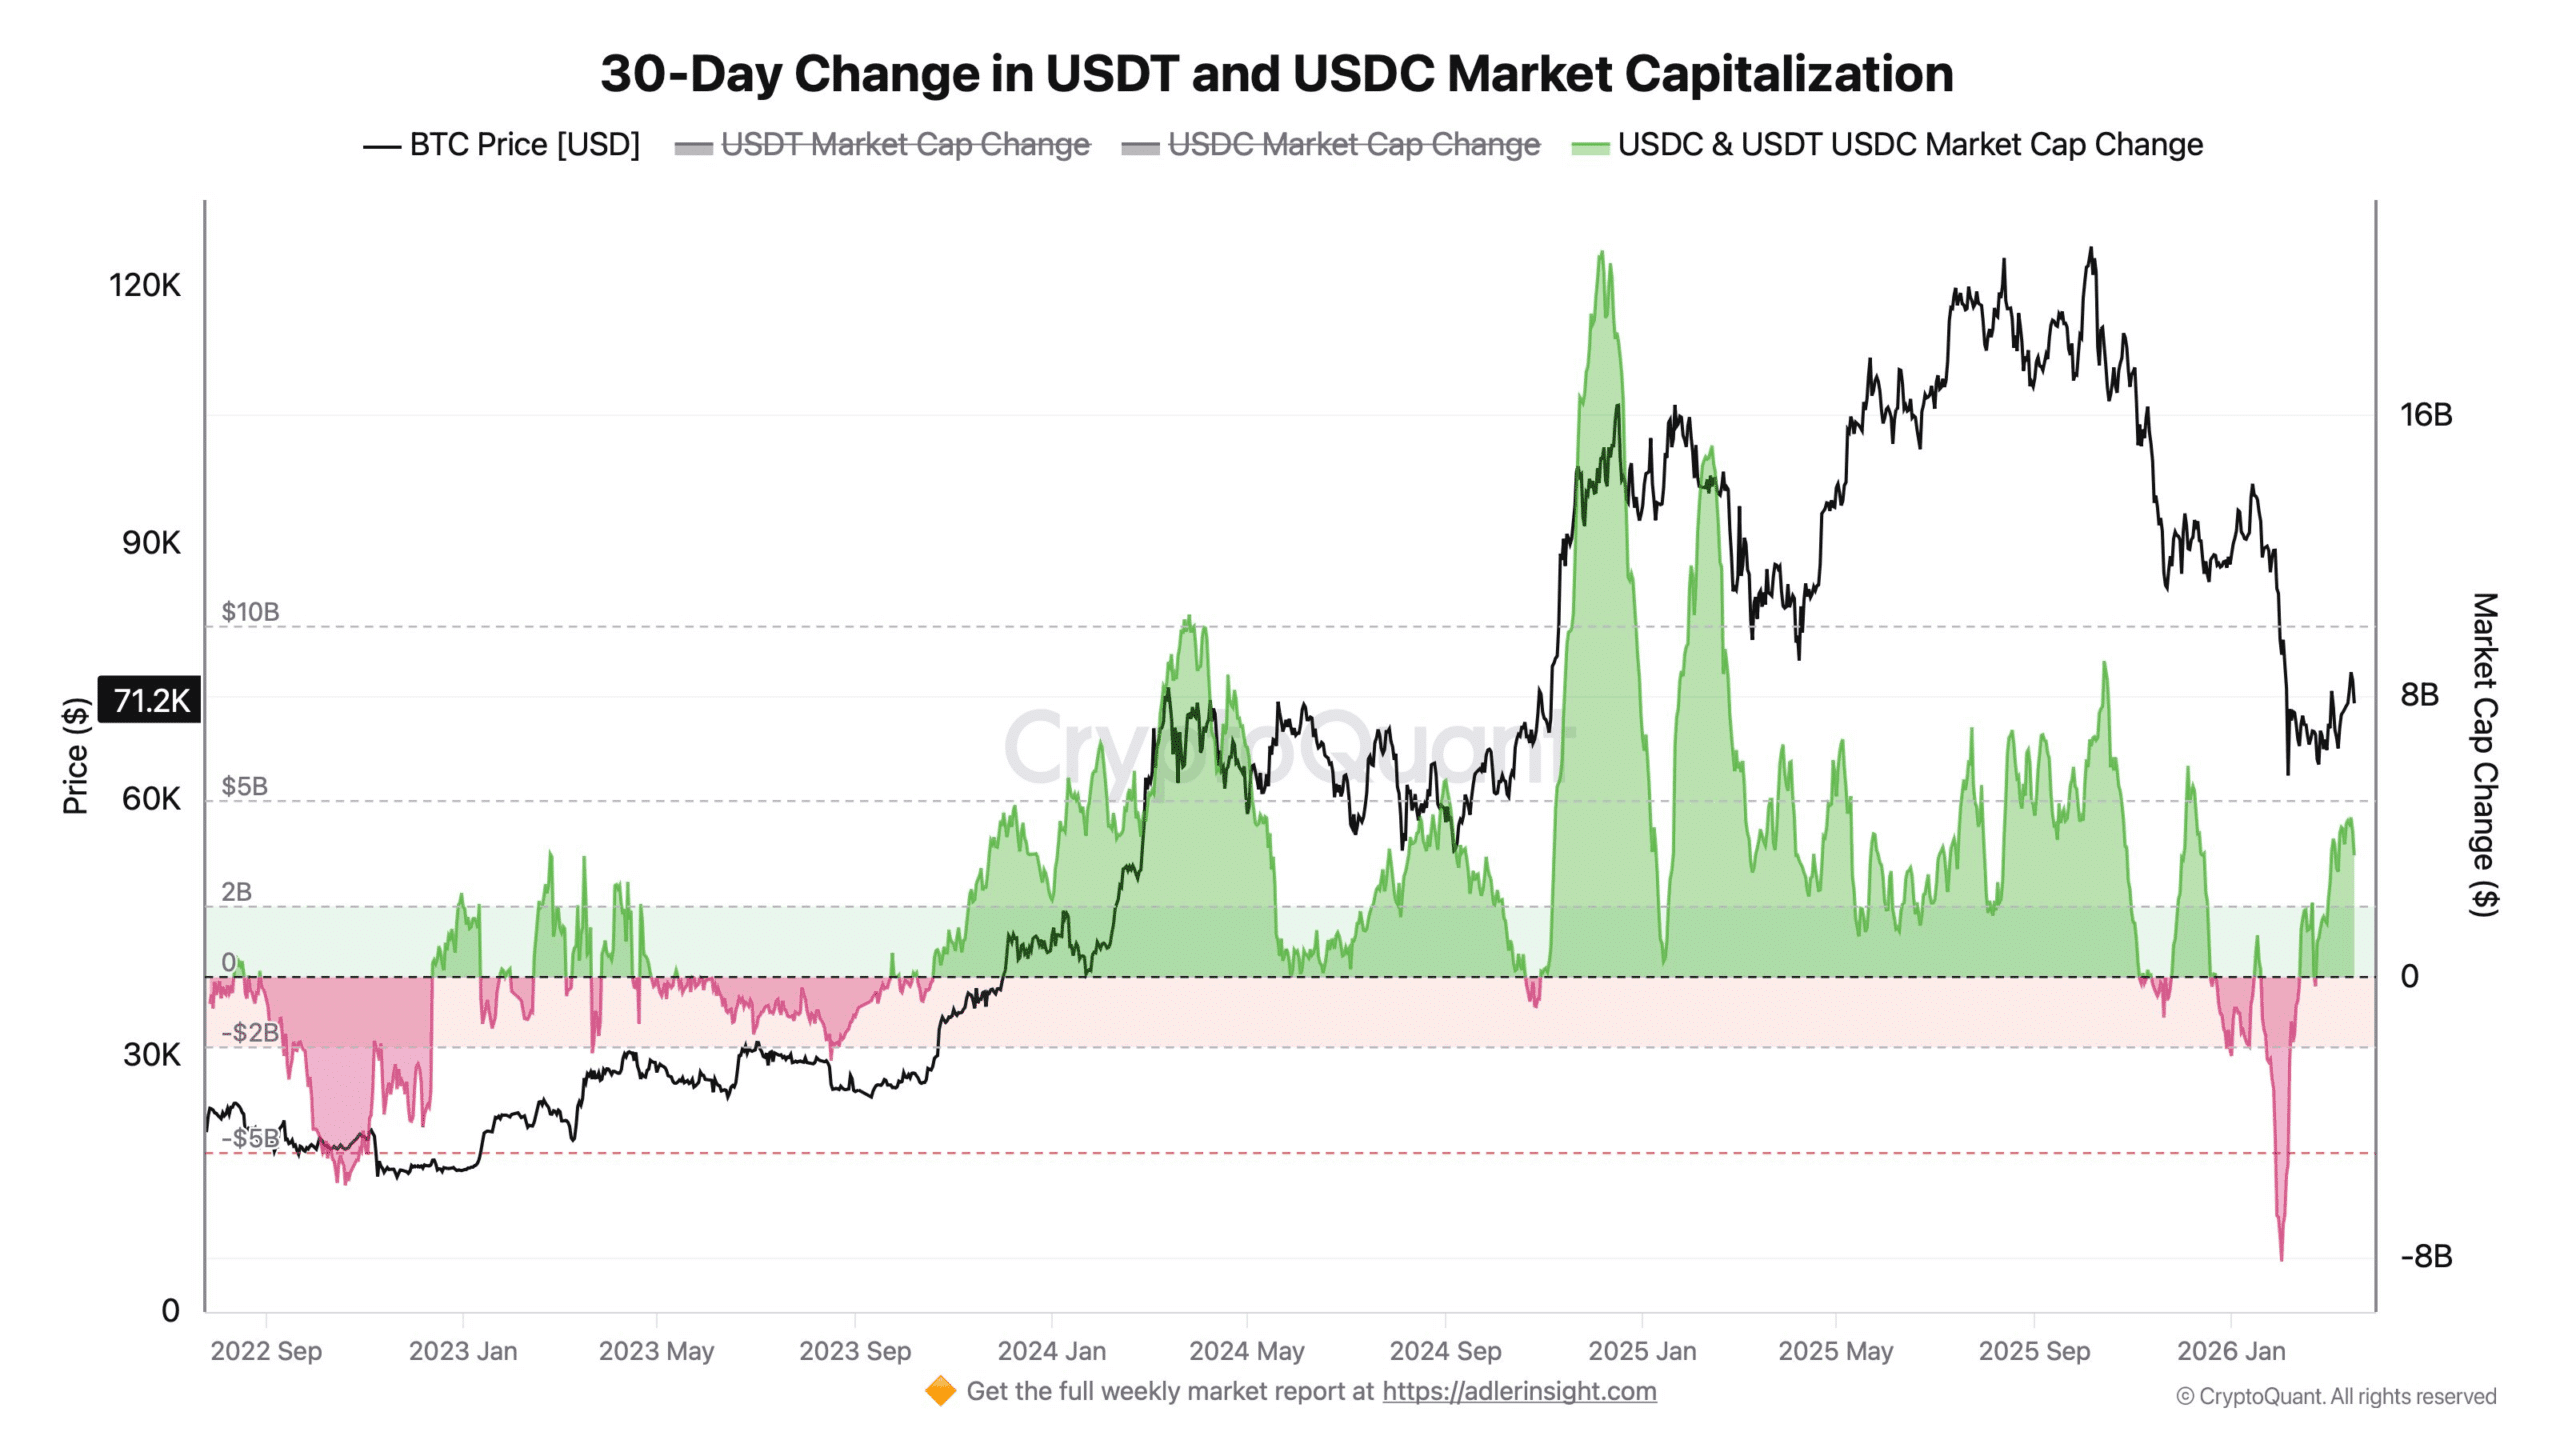
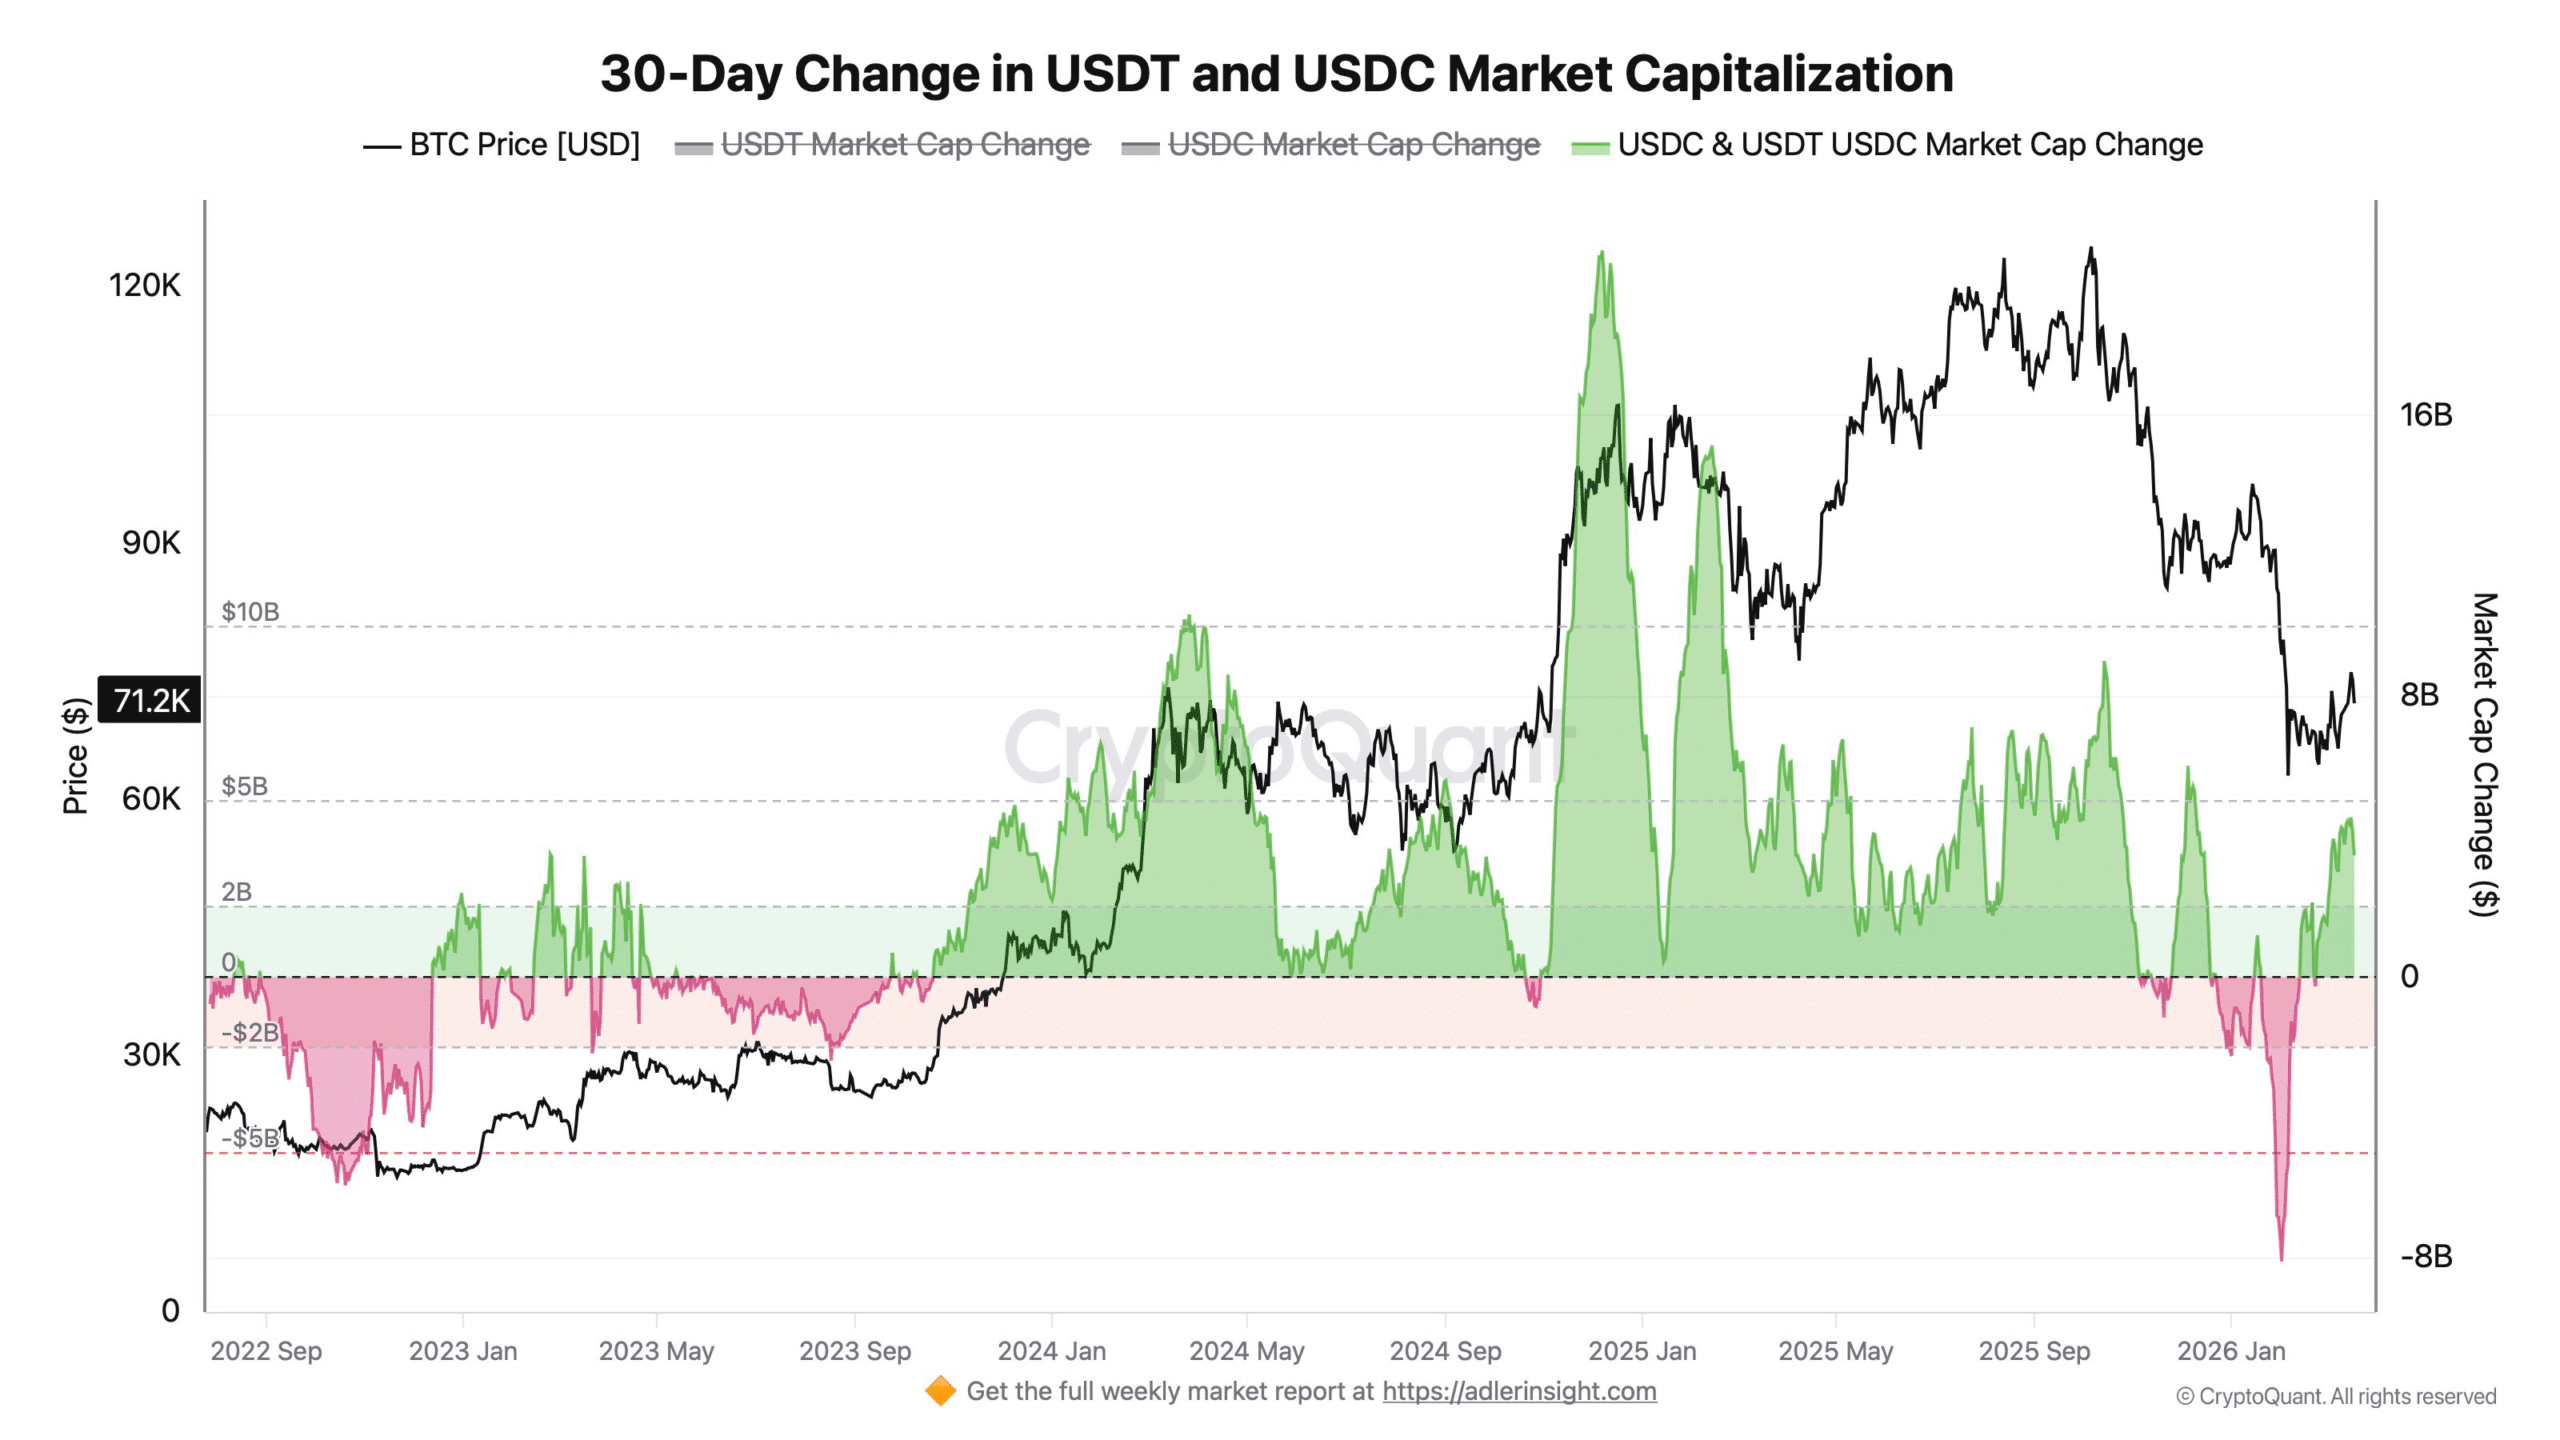
Adding to the mix, the USDT and USDC market caps just reversed from -$8.1 billion to +$4.5 billion, indicating that liquidity returned to the broader market. Normally, that would be a bullish signal, as more liquidity around Bitcoin’s $70k level usually means FOMO is creeping back in.

However, when you layer in rising retail inflows and growing short positions, that liquidity starts to feel more like speculative betting than genuine “dip-buying” pressure. In other words, retail traders are chasing FUD, betting on the downside, and taking profits near the top.

If this trend continues, Bitcoin’s push past $75k will need stronger follow-through, which the falling CVD suggests isn’t happening. As a result, with FUD outweighing FOMO around resistance, a breakdown looks more likely, making retail flows Bitcoin’s biggest “weak spot” right now.


Final Summary

  • Surging retail inflows, rising shorts, and a falling CVD suggest traders are chasing FUD rather than genuine “dip-buying,” creating a key weak spot for Bitcoin.
  • Meanwhile, stablecoin caps have rebounded, but without strong follow-through, BTC’s breakout past $75k remains under bearish control.


Trending Cryptos

Related Questions

QWhat is the main concern raised in the article regarding retail FOMO and Bitcoin's price?

AThe article argues that the return of retail FOMO, characterized by speculative inflows and short positions, is bad news for Bitcoin as it suggests traders are chasing momentum and betting on the downside rather than genuine long-term buying, making a price breakdown more likely.

QWhat data from CryptoQuant was used to identify heightened retail activity on Binance?

ACryptoQuant data showed a massive inflow of $131.8 million into Binance in one hour on March 11th, followed by $55 million on March 13th and another $50 million on March 16th, indicating serious retail trading activity.

QAccording to the article, what does a falling CVD (Cumulative Volume Delta) indicate for the market?

AA falling CVD points to weak spot market demand, suggesting a lack of strong buying pressure and follow-through, which is a bearish signal for Bitcoin's price.

QHow did the change in stablecoin market caps (USDT and USDC) factor into the analysis?

AThe combined USDT and USDC market caps reversed from -$8.1 billion to +$4.5 billion, indicating that liquidity returned to the market. However, the article suggests this liquidity is being used for speculative betting rather than genuine 'dip-buying'.

QWhat key event on March 16th was linked to the $50 million inflow into Binance?

AThe $50 million inflow on March 16th coincided with Bitcoin hitting resistance at $75k, which kicked off three days of price declines and triggered long-liquidation sweeps, pushing the price down to $70k.

Related Reads

Stocks Fell Even More Violently Than Crypto, Where Did the Money Go?

From June to late July 2026, global stock markets, particularly technology and semiconductor stocks, experienced severe declines, with South Korea's KOSPI index facing historic circuit breakers and shedding 40% from its June peak. Key catalysts included SK Hynix's earnings miss despite record profits and competitive pressures from China's CXMT IPO. A global forced deleveraging event unfolded, devastating highly leveraged instruments like the 2x leveraged SK Hynix ETF, which lost over 80% of its value. Surprisingly, Bitcoin showed relative stability during this period, rising roughly 15% from its July low. The article clarifies this wasn't due to an inflow of equity flight capital but because Bitcoin had already undergone a significant correction in May and June, with U.S. spot Bitcoin ETFs seeing record outflows. True safe-haven flows went to gold, severing Bitcoin's short-term "digital gold" narrative. The sell-off is characterized not as an AI story collapse but a liquidity-driven清算 of crowded leveraged positions, potentially halfway through according to some analysts. For substantial capital to return to Bitcoin, the article cites necessary conditions: eased global liquidity pressure, a soft-landing Fed rate cut, and regulatory clarity from the stalled U.S. CLARITY Act. The conclusion is that Bitcoin is not a current safe haven but a pre-cleared asset. Its decoupling from tech stocks highlights its potential future role as a non-correlated asset for institutional portfolios, positioning it favorably for when global capital reallocates post-crisis.

marsbit1h ago

Stocks Fell Even More Violently Than Crypto, Where Did the Money Go?

marsbit1h ago

"The Final Phase Before the New Cycle". What Will Happen to Bitcoin in August

"Bitcoin Faces Crucial Test in August: Experts Predict Consolidation or Further Decline" The price of Bitcoin (BTC) is expected to remain under pressure in August, with experts anticipating either consolidation within a narrow range or a potential drop below $60,000. Despite a double-digit recovery from its July low near $58,000, BTC ended the month trading around $63,500, still roughly 50% below its October 2025 peak of $126,200. Analysts cite several headwinds: a challenging macroeconomic environment with high US interest rates and persistent inflation, which makes fixed-income assets more attractive than speculative ones like crypto. Furthermore, competition for capital is intense, with many investors favoring AI-related stocks. This is reflected in significant outflows from US spot Bitcoin ETFs, with a record $4.5 billion leaving in June and a net outflow of $5.4 billion for the first half of the year. Historically, August is a weak month for crypto, with a median return of -7.49% from 2013 to 2025. Experts also note regulatory uncertainty in the US, particularly the stalled CLARITY Act, as a dampening factor. Despite the bearish near-term outlook, several experts view the current phase as the "last phase before a new Bitcoin cycle" begins, potentially in Q4 2024. This makes it a favorable time for accumulating Bitcoin for the long term. Key price levels to watch are support at $60,000-$61,000, with a break below $58,000 potentially leading to $53,000-$55,000. A move above $67,000 could target $70,000-$75,000, though this is considered a lower probability scenario.

cryptonews.ru1h ago

"The Final Phase Before the New Cycle". What Will Happen to Bitcoin in August

cryptonews.ru1h ago

Trading

Spot

Hot Articles

Discussions

Welcome to the HTX Community. Here, you can stay informed about the latest platform developments and gain access to professional market insights. Users' opinions on the price of S (S) are presented below.

活动图片