Bitcoin Price Forecast: BTC Aims for $70K Target as Weekly ETF Inflows Surpass $626M

cryptonews.ruPublished on 2026-08-06Last updated on 2026-08-06

Abstract

Bitcoin Price Forecast: BTC Targets $70K as Weekly ETF Inflows Surpass $626M Bitcoin is breaking out of a classic "cup and handle" pattern, trading around $64,742 on August 6th. This technical breakout is supported by the daily RSI moving above 50, indicating a shift in momentum towards buyers. Key resistance levels are the 100-day EMA at $66,988 and the 200-day EMA at $72,494, with crucial support at the $62,000 handle level. Fundamentally, spot Bitcoin ETFs have recorded net inflows of $626 million in the first three sessions of the week, already making it the best week since early May. A single day on August 5th saw $244.42 million flow in, led by BlackRock's IBIT. This marks a sharp reversal from the net outflows of the previous week. On-chain data from Glassnode shows the market is in a state of extreme compression, with realized volatility near multi-year lows and call option premiums at record lows, suggesting few traders are positioned for a major move. However, such conditions have historically preceded significant upward breakouts. Analyst Ali Martinez also highlighted that Bitcoin's Net Capital Flows are showing a bullish divergence from price, a signal that marked the cycle bottom before the previous massive rally. **Bullish Target:** A sustained breakout above the $64,000 neckline, fueled by continued strong ETF inflows, could propel BTC toward the 100-day EMA at $66,988. **Bearish Risk:** A failure to hold the $64,000-$64,500 level could invalidate the patt...

Bitcoin is breaking out of a classic cup-and-handle pattern at the $64,742 level on August 6, as spot ETFs have already posted their best week since May, and a cycle bottom signal flashes on net capital flows.

$BTC Breaks Cup and Handle with RSI Above 50
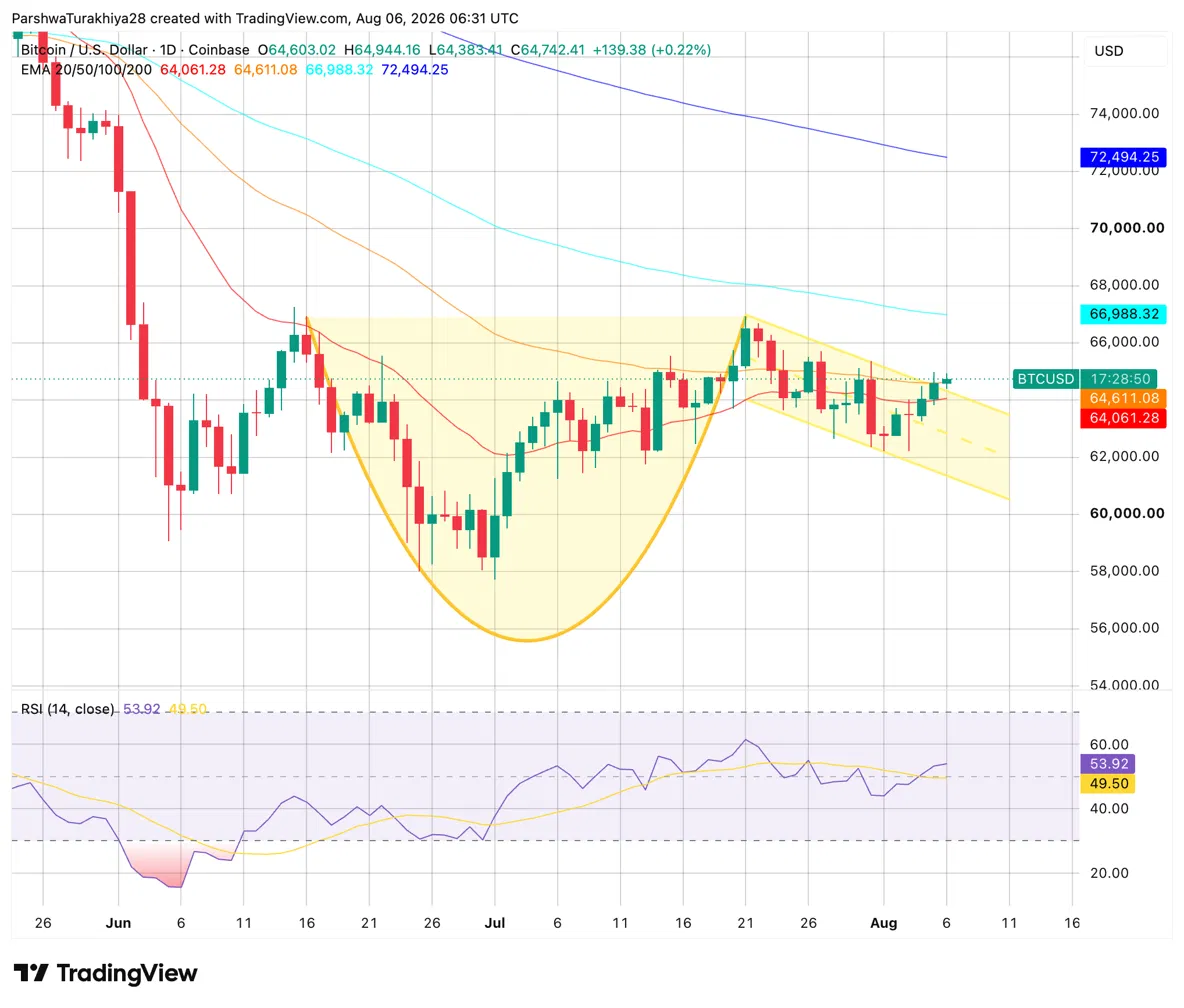
Price action of $BTC (Source: TradingView)

The daily chart shows $BTC completing a 'cup and handle' pattern formed between the June lows around $57,700 and the August recovery. The cup base formed in June and early July, the price recovered to retest the neckline around $65,000, was then pushed back forming the handle between $62,000 and $64,500, and is now breaking above the neckline. Today's session opened at $64,603, rose to $64,944, and is holding at $64,742.

The RSI at 53.92 is above the neutral 50 line for the first time since July's highs, confirming momentum has shifted in favor of buyers. The 20-day EMA at $64,061 and the 50-day at $64,611 are both clustered just below the current price and have been reclaimed.

Related: Zcash Price Forecast for August 2026: ZEC Presses for Triangle Breakout as DCG Buys Mining Site in Nebraska

The 100-day EMA at $66,988 is the next target above, while the 200-day at $72,494 represents the long-term ceiling. Horizontal support at $62,000 is the level that must hold on any pullback to preserve the cup-and-handle structure.

$BTC Support and Resistance Levels for August 6, 2026

Type Price Level
Resistance $66,988 100-day EMA, next major target
Resistance $72,494 200-day EMA, long-term ceiling
Support $64,611 50-day EMA
Support $64,061 20-day EMA
Support $62,000 Cup and Handle Neckline, must hold
Support $57,000 Cup Base, last major floor

Spot ETF Flows Exceed $626M, Two Days Still Remain This Week

Spot Bitcoin ETFs recorded net inflows of $626M over the first three sessions of the week ending August 5, with Wednesday and Thursday yet to close, according to SoSoValue. This already makes it the highest weekly sum since early May, when the week of May 8 brought $622.75M. If the pace holds in the remaining sessions, it will be the best ETF week in roughly three months.

August 5 alone brought $244.42M — the largest day of the week so far. BlackRock's IBIT led with $196.83M, followed by ARK and 21Shares' ARKB with $37.63M, Fidelity's FBTC with $11.28M, and Bitwise's BITB with $10.56M. VanEck's HODL was the only product to record an outflow of $14.67M. Cumulative net inflows across all products now stand at $51.95B with total net assets of $79.21B.

The reversal from the prior week is sharp. The week beginning July 31 recorded a net outflow of $61.53M, driven by one poor day on July 31 itself. The three days since have literally erased that in a single session.

Glassnode: Bitcoin, Unresponsive to Everything

In its latest report, Glassnode describes Bitcoin as a market where bottom signals are building, but the final piece is still missing. On-chain data shows price compression reaching levels that have historically preceded major rallies. The problem is, past recoveries had institutional buyers actively absorbing supply in the background. That is not the case yet: spot ETFs took in just 65,800 $BTC in June — the worst month on record.

The options market reinforces the picture. Traders are paying the lowest amount ever for upside — around 23% implied volatility, while demand for downside protection is also low. Simply put, no one is pricing in a big move in either direction. In Glassnode's view, such quietness typically ends loudly, and when the move happens, most people will not be ready for it and will be chasing price higher rather than already positioned.

Metric Reading What It Means
One-Month Realized Volatility Near multi-year lows Compressions this deep have nearly always resolved upwards
Upside Implied Volatility ~23%, lowest ever No one is paying for upside; The crowd will chase late
June ETF Net Flows Took in just 65,800 $BTC Worst month on record; Demand engine not fully recovered
Seller Exhaustion Constant Inside lower zone Still a third higher than every prior bear cycle level
Coldcard-Related $BTC Movement ~119,000 $BTC moved Price barely reacted; No live bids or offers under the surface

Bitcoin Net Capital Flows Signal Cycle Bottom

BITCOIN MARKET BOTTOM

The last bullish divergence between the $BTC price and Net Capital Flows marked the cycle bottom.

What followed was a bull run from $15,000 to $126,000.

The same signal is back. https://t.co/SxJ0w635qE pic.twitter.com/suckGSld8s

— Ali Charts (@alicharts) August 5, 2026

Analyst Ali Martinez noted on X that Bitcoin's net capital flow is showing the same bullish divergence from price that marked the cycle bottom ahead of the rally from $15,000 to $126,000.

The signal occurs when capital flows turn positive while price remains depressed, and has historically preceded significant recoveries. Ali Charts explicitly noted: the same pattern is back.

Bitcoin Price Forecast: Upside and Downside Targets

Bull Case, Target: $66,988 (100-day EMA)

The cup-and-handle breakout holds above the $64,000 neckline on a daily close, with the RSI holding above 50 confirming the momentum shift. Weekly ETF inflows continuing through Wednesday and Thursday lift the week's total above $700M, indicating a real return of institutional demand. Short liquidations continue to fuel the move, and price advances towards the 100-day EMA at $66,988, fitting Glassnode's historical observation that volatility compressions this deep nearly always resolve to the upside.

Bear Case, Risk Level: $62,000 (Handle Support)

The $64,000–$64,500 neckline fails to hold on a daily close, invalidating the cup and handle. ETF inflows slow in the week's remaining sessions, and Glassnode's warning about the missing demand engine proves prescient as institutional flows fail to materialize. Price pulls back towards handle support at $62,000, where buyers must step in to prevent a deeper retest of the cup base around $57,000.

end-content

Trending Cryptos

Related Questions

QWhat is the key technical chart pattern mentioned in the article that Bitcoin ($BTC) is breaking out of?

AThe key technical chart pattern mentioned is the 'cup and handle' pattern, which is completing between the June low and the August recovery.

QAccording to the article, what milestone did Spot Bitcoin ETFs achieve in the first three sessions of the week ending August 5, 2026?

ASpot Bitcoin ETFs recorded net inflows of $626 million in the first three sessions of that week, which was already the highest weekly amount since early May.

QWhat does the analyst Ali Martinez identify in the Net Capital Flow for Bitcoin, and what is its historical significance?

AAli Martinez identifies a bullish divergence between the Bitcoin price and Net Capital Flows. Historically, this same signal marked the cycle bottom before a bull run from $15,000 to $126,000.

QBased on the bullish case outlined in the article, what is the initial price target for Bitcoin ($BTC) and what indicator does it correspond to?

AThe initial bullish price target is $66,988, which corresponds to the 100-day Exponential Moving Average (EMA).

QWhat critical support level must hold to maintain the bullish structure according to the bearish case described?

AAccording to the bearish case, the critical support level that must hold to maintain the bullish structure is $62,000, which is the support level of the 'handle' in the cup and handle pattern.

Related Reads

Home Furnishing Listed Companies Are Trying to Turn Around with AI and Semiconductors

Chinese home furnishing listed companies are increasingly turning to AI and semiconductor cross-border ventures to revive their fortunes amid declining core businesses. A prominent example is PVC flooring giant **Elegant Home Furnishing**, whose stock price skyrocketed with 10 consecutive trading limits after announcing a plan to acquire a majority stake in **Ou Kang Nuo**, a semiconductor storage testing equipment and services company. Despite Elegant Home's own financial struggles—including recent losses and tight cash flow—the acquisition, funded through asset sales and loans, has dramatically boosted its market value. The deal involves a cross-shareholding structure with Ou Kang Nuo's controlling shareholder. This trend is widespread. Over the past year, numerous home furnishing firms with stagnant main operations have seen their stock prices surge after announcing moves into hot sectors like AI, semiconductors, or computing power. Key cases include: * **Markor Home Furnishings** ("high-end home furnishing first share"), after years of heavy losses, acquired an AI server high-speed copper cable company and later introduced AI computing power investors. * **Zhenai Meijia** ("blanket king") became the first A-listed manufacturer controlled by an AI large model company following a takeover. * **Fasilon** (integrated ceiling) saw its stock soar after establishing an AI subsidiary. * **Jinlong Decoration** experienced multiple trading limits after being linked to "commercial aerospace" and "AI computing," despite clarifying these segments contribute less than 1% of its business. Statistics show over 20 A-share companies announced semiconductor crossovers in 2025, with home furnishing and building materials firms being the most active. This shift is largely driven by pressures from the real estate downturn, shrinking overseas demand, and trade tariffs, pushing companies to seek growth through trendy concepts rather than core business improvement. However, the article warns that such speculative frenzies often end when the hype fades, leaving stock prices to eventually reflect the companies' weak fundamentals, as seen in Jinlong Decoration's subsequent sharp price correction. The repeated attempts to "ride the trend" highlight a desperate struggle for survival in a challenging traditional industry.

marsbit15m ago

Home Furnishing Listed Companies Are Trying to Turn Around with AI and Semiconductors

marsbit15m ago

"Sell America" Trade Resurfaces: Global Funds Reprice Washington Policy Risks, Dollar and Treasuries Bear the Brunt

"Sale of America" Trade Resurges as Global Funds Reprice Washington Policy Risks, Hitting Dollar and Treasuries First Recent policy signals from Washington are prompting global bond and foreign exchange investors to reignite the "Sale of America" debate. Uncertainty stems from Fed Chair Wash's shift towards less policy communication, Treasury Secretary Bessant's approval of joint intervention with Japan to support the Yen (the first such coordinated move in nearly 30 years), expanding fiscal deficits, and trade war fears. These factors are undermining confidence in U.S. assets. The 30-year Treasury yield recently broke above 5%, hitting a high not seen since 2007, while the Bloomberg Dollar Spot Index has fallen about 2% from its June peak. This dollar weakness is unusual given still-high U.S. interest rates. Investors cite policy uncertainty as a key driver, with one manager calling the Fed Chair and Treasury Secretary a "double whammy" creating a "Trump administration premium." While the S&P 500 continues hitting record highs and foreign holdings of U.S. Treasuries remain high, parts of the bond and FX markets are adjusting. A core concern is whether the Fed under Wash can effectively anchor inflation expectations; analysts warn that if the Fed lags the hiking cycle, long-end yields could face further upward pressure. The 30-year term premium has risen sharply. The U.S.-backed Yen intervention has also sparked debate on the dollar's structural outlook. While framed by Bessant as a "reallocation of reserves," market participants caution that if Japan—America's largest foreign creditor—must sell Treasuries to fund interventions, ripple effects could hit the bond market. Strategists predict moderate dollar depreciation ahead. Most experts are not predicting an end to dollar hegemony or the safe-haven status of Treasuries. However, a key underlying risk is highlighted: the pace of foreign buying of U.S. debt may not keep up with the speed of American borrowing, gradually eroding the structural advantages that have long supported "American exceptionalism."

marsbit16m ago

"Sell America" Trade Resurfaces: Global Funds Reprice Washington Policy Risks, Dollar and Treasuries Bear the Brunt

marsbit16m ago

Trading

Spot

Hot Articles

What is $BITCOIN

DIGITAL GOLD ($BITCOIN): A Comprehensive Analysis Introduction to DIGITAL GOLD ($BITCOIN) DIGITAL GOLD ($BITCOIN) is a blockchain-based project operating on the Solana network, which aims to combine the characteristics of traditional precious metals with the innovation of decentralized technologies. While it shares a name with Bitcoin, often referred to as “digital gold” due to its perception as a store of value, DIGITAL GOLD is a separate token designed to create a unique ecosystem within the Web3 landscape. Its goal is to position itself as a viable alternative digital asset, although specifics regarding its applications and functionalities are still developing. What is DIGITAL GOLD ($BITCOIN)? DIGITAL GOLD ($BITCOIN) is a cryptocurrency token explicitly designed for use on the Solana blockchain. In contrast to Bitcoin, which provides a widely recognized value storage role, this token appears to focus on broader applications and characteristics. Notable aspects include: Blockchain Infrastructure: The token is built on the Solana blockchain, known for its capacity to handle high-speed and low-cost transactions. Supply Dynamics: DIGITAL GOLD has a maximum supply capped at 100 quadrillion tokens (100P $BITCOIN), although details regarding its circulating supply are currently undisclosed. Utility: While precise functionalities are not explicitly outlined, there are indications that the token could be utilized for various applications, potentially involving decentralized applications (dApps) or asset tokenization strategies. Who is the Creator of DIGITAL GOLD ($BITCOIN)? At present, the identity of the creators and development team behind DIGITAL GOLD ($BITCOIN) remains unknown. This situation is typical among many innovative projects within the blockchain space, particularly those aligning with decentralized finance and meme coin phenomena. While such anonymity may foster a community-driven culture, it intensifies concerns about governance and accountability. Who are the Investors of DIGITAL GOLD ($BITCOIN)? The available information indicates that DIGITAL GOLD ($BITCOIN) does not have any known institutional backers or prominent venture capital investments. The project seems to operate on a peer-to-peer model focused on community support and adoption rather than traditional funding routes. Its activity and liquidity are primarily situated on decentralized exchanges (DEXs), such as PumpSwap, rather than established centralized trading platforms, further highlighting its grassroots approach. How DIGITAL GOLD ($BITCOIN) Works The operational mechanics of DIGITAL GOLD ($BITCOIN) can be elaborated on based on its blockchain design and network attributes: Consensus Mechanism: By leveraging Solana’s unique proof-of-history (PoH) combined with a proof-of-stake (PoS) model, the project ensures efficient transaction validation contributing to the network's high performance. Tokenomics: While specific deflationary mechanisms have not been extensively detailed, the vast maximum token supply implies that it may cater to microtransactions or niche use cases that are still to be defined. Interoperability: There exists the potential for integration with Solana’s broader ecosystem, including various decentralized finance (DeFi) platforms. However, the details regarding specific integrations remain unspecified. Timeline of Key Events Here is a timeline that highlights significant milestones concerning DIGITAL GOLD ($BITCOIN): 2023: The initial deployment of the token occurs on the Solana blockchain, marked by its contract address. 2024: DIGITAL GOLD gains visibility as it becomes available for trading on decentralized exchanges like PumpSwap, allowing users to trade it against SOL. 2025: The project witnesses sporadic trading activity and potential interest in community-led engagements, although no noteworthy partnerships or technical advancements have been documented as of yet. Critical Analysis Strengths Scalability: The underlying Solana infrastructure supports high transaction volumes, which could enhance the utility of $BITCOIN in various transaction scenarios. Accessibility: The potential low trading price per token could attract retail investors, facilitating wider participation due to fractional ownership opportunities. Risks Lack of Transparency: The absence of publicly known backers, developers, or an audit process may yield skepticism regarding the project's sustainability and trustworthiness. Market Volatility: The trading activity is heavily reliant on speculative behavior, which can result in significant price volatility and uncertainty for investors. Conclusion DIGITAL GOLD ($BITCOIN) emerges as an intriguing yet ambiguous project within the rapidly evolving Solana ecosystem. While it attempts to leverage the “digital gold” narrative, its departure from Bitcoin's established role as a store of value underscores the need for a clearer differentiation of its intended utility and governance structure. Future acceptance and adoption will likely depend on addressing the current opacity and defining its operational and economic strategies more explicitly. Note: This report encompasses synthesised information available as of October 2023, and developments may have transpired beyond the research period.

1.5k Total ViewsPublished 2025.05.13Updated 2025.05.13

What is $BITCOIN

Discussions

Welcome to the HTX Community. Here, you can stay informed about the latest platform developments and gain access to professional market insights. Users' opinions on the price of BTC (BTC) are presented below.

活动图片