Odaily 特邀行情分析师 Conaldo,美国哥伦比亚大学金融统计硕士,自大学期间专注美股量化交易,并逐步拓展至比特币等数字资产,在实战中构建出一套系统化的量化交易模型与风险控制体系;对市场波动具备敏锐的数据洞察力,并立志于在专业交易领域持续深耕,追求稳健回报;将于每周深挖 BTC 技术、宏观、资金面等变化,复盘并展示实操策略,预告近期值得关注的大事记,以供参考。

交易周报核心摘要:
- 策略执行(短期)成效验证:上周交易严格遵循既定策略执行,成功完成二次操作,累计实现收益 3.62%。
- 核心观点(短期)验证:我们上周提出的“市场将呈现宽幅区间震荡”核心观点,已得到市场走势的完美验证。所界定的核心观测区间 89,500~91,000 美元与下方支撑 86,500~87,500 美元区域,被行情反复测试。尤为关键的是,上周币价触及高点 90,598 美元与我们所给核心区域上沿(91,000 美元)仅差 402 美元;周中回踩低点(86,400 美元)与支撑区域下沿(86,500 美元)仅差 100 美元,点位预判的精准性得到市场充分的印证。
- 从宏观技术层面看,比特币自 10 月 6 日创下 126,200 美元历史高点后,调整已历时 82 天,期间最大跌幅约 36%,中期空头趋势已得到确认。然而,从多项技术指标观察,当前已进入低位区域,调整的时间与空间均逐步接近历史常见超跌条件。自 11 月 22 日以来,价格持续在低位区间震荡整理,显示多空力量处于相对平衡状态,方向性突破的动能正在聚积。尽管目前市场“喊涨”声渐起,但我们认为,在排除突发消息干扰的情况下,后续走势仍存在一种关键可能性:如果市场由主力资金主导,对空头而言,更优的策略可能是先向下破位,击穿 80,000 美元关键心理关口,借恐慌情绪清理剩余多头筹码,从而完成最后一次筑底。此后,资金方可顺势实现“空翻多”,快速拉升币价脱离成本区,继而启动一轮较有力度的技术性修复行情。需要强调的是,上述走势仅为基于市场行为逻辑的一种推演,并非必然路径。无论行情如何演化,都应谨记:“市场永远是对的。”在方向选择之前,保持观察与灵活应对仍是当前阶段的关键。
一、上周交易成果回顾:(12.22~12.28)
1、短线交易复盘(未加杠杆):
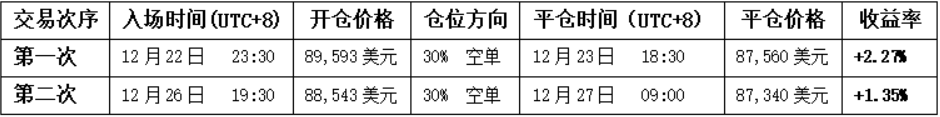
• 第一次交易(盈利 2.27%):依据“反弹至核心压力区域遇阻沽空“模式。在币价冲击89,500~91,000美元区域遇阻时,叠加价差交易模型同步发出顶部信号,即可建立 30%的空头仓位,并最终在价格回落至支撑区域附近时获利了结。
• 第二次交易(盈利 1.35%):本次交易逻辑同上。在币价冲击89,500~91,000美元区域遇阻时,再叠加两个模型发出的共振信号,成功完成本次交易。
2、上周走势预测与操作策略回顾:
在上周的前瞻分析中明确指出:预计市场将主要呈现宽幅区间震荡格局。核心观测区间为89,500~91,000美元,该区域的争夺结果将决定短期走向。以下为策略复盘与解析。
1、行情走势预测回顾:
• 核心压力位:第一压力看89,500~91,000美元区域;第二压力看93,000~94,500美元区域。
• 核心支撑位:第一支撑看86,500~87,500美元区域;第二支撑看83,500~84,500美元区域。
2、操作策略回顾:
• 中线策略:保持65%左右的中线仓位(空单)。
• 短线策略:上周我们初步拟定了A/B两套短线操作预案。结合市场的实际走势,我们最终以方案 B作为核心策略并予以执行。
(方案 B:反抽验证,89,500~91,000美元核心区域已被有效跌破)
• 开仓:当反抽验证过程中出现遇阻信号时,可建立30%的空头仓位。
• 风控:止损设于 92,000 美元上方。
• 平仓:当币价下探至83,500~84,500美元区域出现抵抗时,考虑部分或全部清仓,获利了结。
二、技术分析:比特币中期趋势判断
结合上周的市场运行,笔者将综合运用多维度分析模型,对比特币内部结构和趋势的演变进行深入剖析。
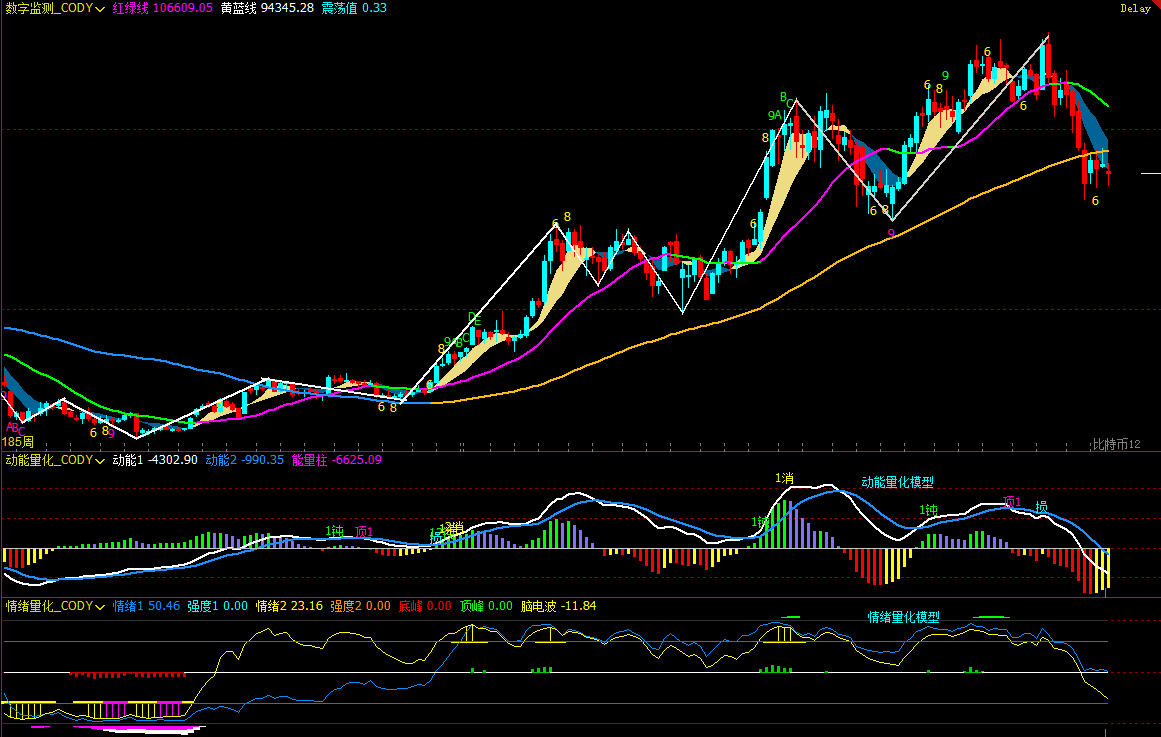
比特币周 K 线图:(动能量化模型+情绪量化模型)
图二
1、如(图二)所示,从周线图分析:
• 动能量化模型:经历上周调整后,两条动能指标线仍在零轴下方运行,负向量能柱逐步缩短,这表明,尽管周线已进入空头市场,但空头动能尚未充分释放。
动能量化模型预示:币价下跌指数:高
• 情绪量化模型:蓝色情绪线数值 49.74,强度为零;黄色情绪线数值 19.99(接近低位阈值),强度为零,顶峰数值是 0。
情绪量化模型预示:币价压力及支撑指数:中性
• 数字监测模型:币价跌破多空(黄蓝线)分界线已达 6 周时间;短期见底数字信号(9 以上)还未出现。
以上数据预示:比特币周线已确立空头趋势,需警惕空头力量的后续释放。
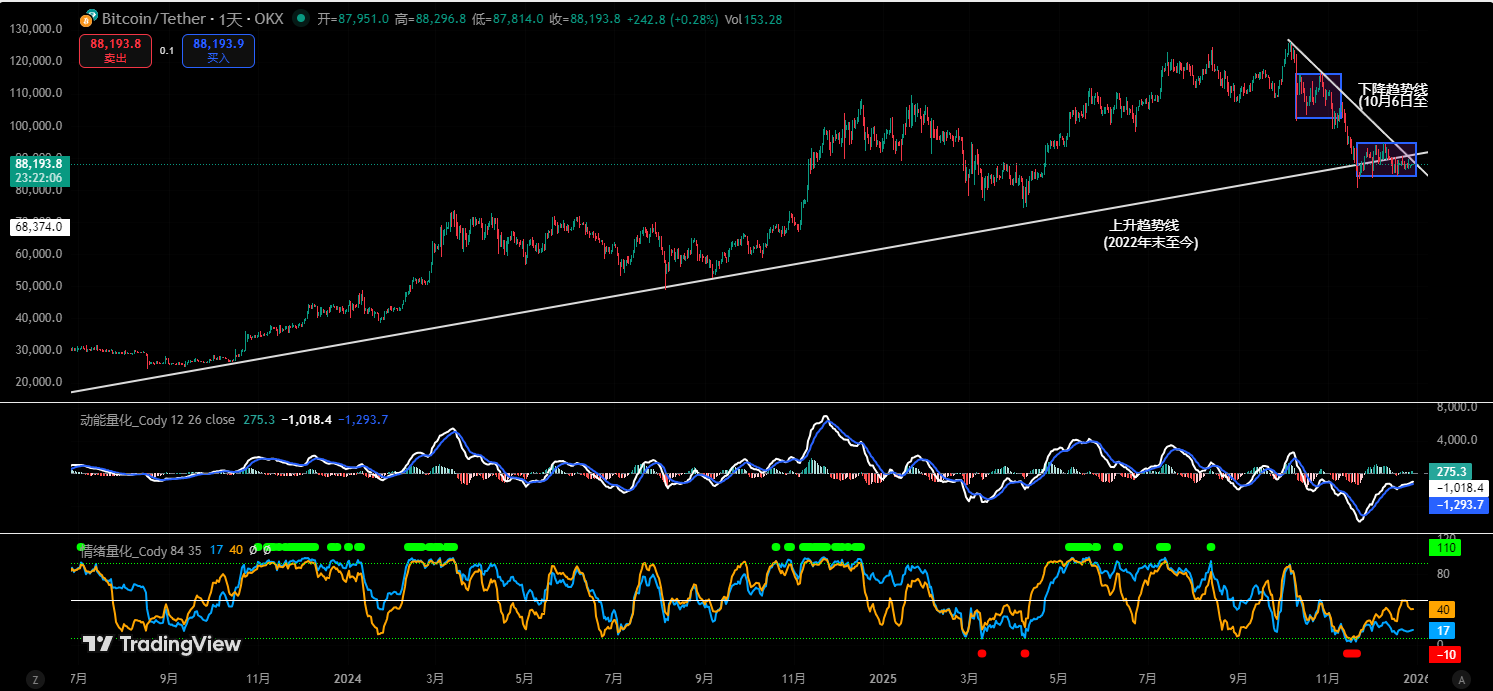
比特币日 K 线图:
图三
2、如(图三)所示,从日线图分析:
• 动能量化模型:在上周走势中,两条动能线几乎粘合在一起,在零轴下方缓慢上行并逐渐靠近零轴。受假日影响,每日成交量持续萎缩,正向量能柱变化不明显。
动能量化模型预示:买盘动能疲软,量能柱收缩至“星点”状,表明多空力量暂时均衡。
• 情绪量化模型:上周日收盘后,蓝色情绪线数值 16(接近低位阈值),强度为零;黄色情绪线数值 40,强度为零。
情绪量化模型预示:压力及支撑指数:中性
以上数据提示:日线级别处于空头市场,短期市场即将选择方向。
三、本周比特币行情预测:(12.29~01.04)
1、预计本周市场极大可能以震荡探底为主,核心观察区间看 86,000~86,500美元。
• 若有效跌破:币价可能继续下探,将考验下方83,500~84,500美元支撑区域。
• 若有效站稳:市场或延续当前86,500~91,000美元区间震荡格局。
2、核心压力位:
• 第一压力区:89,500~91,000美元区域
• 第二压力区:93,000~94,500美元区域
• 重要压力区:97,000美元附近
3、核心支撑位:
• 第一支撑位:86,000~86,500美元区域
• 第二支撑位:83,500~84,500美元区域
• 重要支撑位:80,000美元附近。
四、本周比特币操作策略(排除突发消息影响):(12.29~01.04)
1、 中线策略:保持65%左右的中线仓位(空单)。
2、 短线策略:利用30%仓位,设置止损点,依据支撑及压力位,寻找做“价差”机会。(以 30 分钟作为操作周期)。
3、 重点观察多空双方对86,000~86,500 美元区域的争夺。为应对市场演变,我们拟定A/B两套短线操作预案:
• 方案 A:若有效站稳86,000~86,500 美元区域:
• 开仓:当币价反弹到89,500~91,000 美元区域并出现遇阻信号时,可建立30%的空头仓位。
• 风控:空单止损设于92,500 美元上方。
• 平仓:当币价下跌至86,000~86,500 美元区域出现企稳信号时,清仓全部空单获利了结。
• 方案 B:若有效跌破86,000~86,500 美元区域:
• 开仓:若币价有效跌破,可建立30%的空头仓位。
• 风控:止损设于88,000 美元上方。
• 平仓:当币价下探至83,500~84,500美元区域出现企稳信号时,可逐步清仓获利了结。
五、特别提示:
1. 开仓时:立即设置初始止损位。
2. 盈利达 1%时:将止损位移至开仓成本价(盈亏平衡点),确保本金安全。
3. 盈利达 2%时:将止损位移至盈利 1%的位置。
4. 持续跟踪:此后币价每再盈利 1%,止损位就同步移动 1%,动态保护并锁定已有利润。
(注:上述 1%的盈利触发阈值,投资者可根据自身风险偏好与标的波动性灵活调整。)
六、本周重点事件前瞻:(12.29~01.04)
1、美联储会议纪要释放“真实分歧”信号
周三 03:00,美联储将公布最新货币政策会议纪要。相比利率决议本身,纪要更关键的是内部成员在“降息时点、幅度与持续性”上的分歧程度。
若纪要显示官员对通胀回落的信心增强、并讨论更早或更快的宽松路径,将强化市场对“实际利率下行”的预期,对比特币构成中期利好;反之,若纪要强调对通胀反复或金融条件过快放松的担忧,则可能阶段性抬升美元与美债收益率,对 BTC 形成情绪压制。
对比特币而言,这并非短线方向信号,而是影响中期资金定价锚的重要节点。
2、初请失业金人数:流动性预期的温度计
周三 21:30,美国将公布至 12 月 27 日当周初请失业金人数。
当前市场更关注“劳动力市场是否出现结构性降温”,而非单一数据波动。
若初请持续高于趋势水平,将进一步验证经济降温逻辑,强化市场对宽松政策延续的预期,有利于比特币等非收益型资产的估值修复;若数据再度回落,则可能强化“经济仍具韧性”的判断,短期内不利于 BTC 的风险偏好扩张。
该指标对比特币的影响主要体现在利率预期而非基本面本身。
3、制造业 PMI 终值验证实体经济方向
周五 22:45,美国 12 月标普全球制造业 PMI 终值公布。
PMI 作为领先指标,将帮助市场判断“软着陆”是否仍在轨道之中。
若终值确认制造业企稳甚至改善,风险资产整体情绪有望维持,对 BTC 的系统性压制有限;若 PMI 再度下修,则可能引发对经济下行的再定价,短期利空风险资产,但中长期反而可能强化对货币宽松的预期。
金融市场瞬息万变,所有行情分析及交易策略均需动态调整。本文所涉及的全部观点、分析模型与操作策略,均源自个人技术分析,仅为个人交易日志之用,不构成任何投资建议或操作依据。市场有风险,投资需谨慎,DYOR。