17 Desember: Analisis Pasar BTC, ETH, SOL, PTB, IR

金色财经Published on 2025-12-17Last updated on 2025-12-17

Abstract

Analisis Pasar Kripto 17 Desember: BTC, ETH, SOL, PTB, dan IR Data non-farm AS terbaru menunjukkan sinyal campuran, dengan fokus utama pada data Januari terkait potensi pemotongan suku bunga. Pasar prediksi menunjukkan sedikit kenaikan probabilitas pemotongan suku bunga Januari, namun tidak signifikan. BTC menunjukkan tren lemah dengan breakdown dari tren bullish. MACD death cross mengonfirmasi momentum bearish. Support kunci berada di $77.250-$78.800 untuk entri awal, dengan area beli utama di $74.600-$75.000 jika $77.000 tembus. ETH berada dalam siklus koreksi dengan support terdekat di $2.228. Support berikutnya di EMA52 ($2.508) dan low Juni ($2.112). Area bottoming diperkirakan di $2.112-$2.222. SOL berpotensi uji support di $102-$114, dengan EMA52 bulanan di $109.5. Break di bawah $100 bisa picu penurunan ke $84.85-$86.25. PTB dinilai sangat berisiko (high risk, low reward) dengan volatilitas ekstrem dan potensi penurunan drastis hingga 40%. IR (dengan harga pool $0.1) memiliki latar belakang pendanaan kuat dan revenue protocol, namun tokenomics tidak transparan dan minat komunitas rendah. Disarankan hindari pembelian saat peluncuran dan tunggu stabilisasi pasca-penjualan. Saran umum: Tunggu reaksi pasar setelah kenaikan suku bunga Jepang (19 Des) untuk konfirmasi arah. Fokus pada support-level kunci untuk akumulasi aset berkualitas.

Data terkait NFP tadi malam, satu menguntungkan dan satu merugikan, saling menetralisir. Wall Street saat ini benar-benar memfokuskan pada data bulan Januari karena terkait dengan kemungkinan penurunan suku bunga pada Januari. Setelah data NFP dirilis, pasar prediksi mengenai penurunan suku bunga pada Januari mengalami kenaikan, tetapi tidak signifikan.

Bitcoin terus melakukan penyesuaian lemah dalam 4 jam terakhir, saat ini belum ada sinyal penghentian penurunan atau dukungan yang efektif. Tunggu hingga tanggal 19 setelah kenaikan suku bunga Jepang untuk melihat reaksi pasar.

BTC

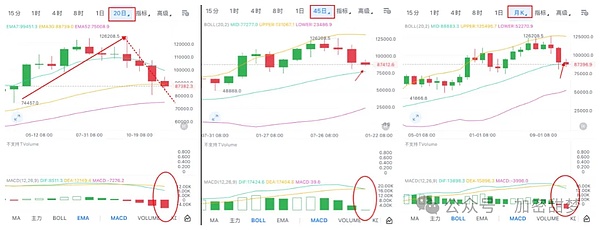
Dari segi pola level harian, BTC telah menembus di bawah tren, MACD dead cross, berpotensi turun lebih lanjut, level harian masih dalam pola bearish, lakukan short pada level resistance.

Bollinger Band tengah bulanan BTC di 88800 tembus minggu ini, sekarang telah menjadi resistance, jadi perhatikan Bollinger Band tengah 45 hari di 77250. Jadi bulan ini, beli kepala di 78800-77250 untuk posisi awal.

Sedangkan level 20 hari membentuk top bulat, momentum penurunan menunjukkan tren penguatan, titik dukungnya adalah Bollinger Band bawah di 80250 dan EMA52 (sekitar 75000). Jadi setelah tembus 7.7w, 75000-74600 adalah range beli utama kali ini.
ETH

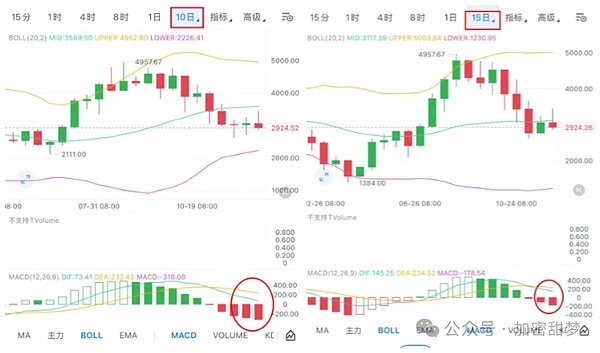
Saat ini berada dalam tahap penyesuaian level 10-15 hari dalam siklus penyesuaian bulanan. Penyesuaian 10 hari belum berakhir, garis cepat MACD hampir mencapai nol, mungkin akan mempercepat penurunan saat menyentuh nol; EMA7/30/52 semua tembus, dukungan jangka pendek hanya Bollinger Band bawah di 2228.

20 hari dead cross kemudian muncul 5 bearish berturut-turut, harga sedikit di bawah tengah, jauh dari bawah; dukungan utama EMA52 (2752), jika tembus maka titik terendah melihat rendah Juni 2112 (penyesuaian jarak sama tercapai, penyesuaian kanan berakhir). Bollinger Band tengah bulanan telah tembus, tetapi bawah 1620 terlalu jauh tidak efektif; dukungan efektif EMA52 (2508).

Range dasar bertahap kali ini: 2222-2112. Di antaranya 2752-2680 memiliki dukungan tertentu, tanpa berita buruk ekstrem yang menyebabkan penurunan, dapat dijadikan titik beli jangka pendek.
SOL

Saat ini berjalan di antara 10, 15, 20 hari dan Bollinger Band tengah-bawah bulanan, Bollinger Band bawah mereka均在 114-102, range ini dapat dijadikan referensi beli. Sekaligus EMA7-30 10, 15, 20 hari semua tembus, tidak ada dukungan.

EMA52 bulanan harganya 109.5. Jadi range beli sebelum 100 tembus adalah 114-102.

Mempertimbangkan kemungkinan jarum besar dalam kondisi ekstrem yang mungkin membuat 100 tembus virtual, titik setelah 100 tembus virtual adalah 96.25-95.65. Jika tembus di bawah 95 termasuk tembus nyata, maka pertimbangkan turun hingga 86.25-84.85.
PTB

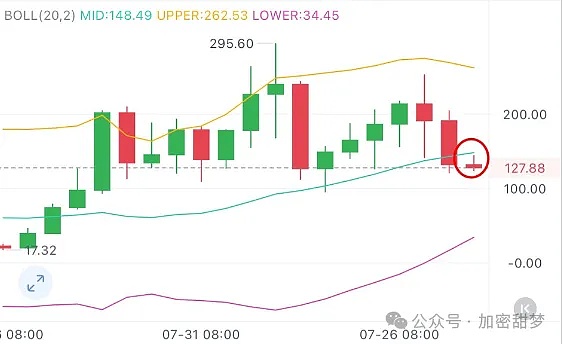
Koin seperti PTB ini tidak berani sentuh, seperti koin tunggal, long atau short mudah kena pukul, rasio harga-kinerja sangat rendah, mungkin lari cepat bisa jilat sedikit, tetapi lari lambat pasti kena pukul, singkatnya selama serakah akhirnya harus dikembalikan, terbang dulu kemudian satu jarum turun langsung 40% lebih.
IR

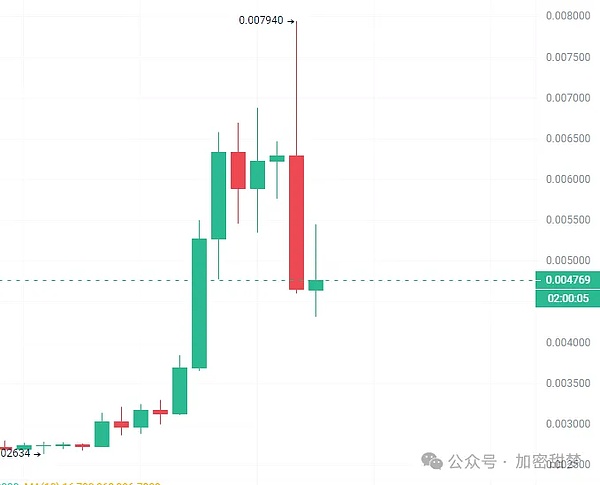
Total suplai 1 miliar, sirkulasi awal 20.5%, harga pool 0.1

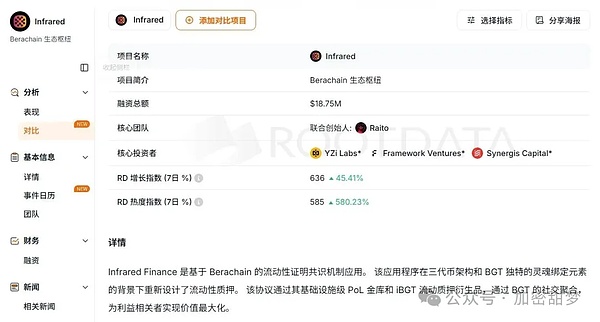
Keuntungan: 1. Latar belakang pendanaan bagus, diinvestasikan Yzi Lab, co-founder Bera 2. Pendapatan protokol tahun ini lebih dari 8 juta dollar, TVL masih 210M 3. Harga pool tidak mahal, 0.1, 100M 4. Airdrop di dalam CEX, teman yang berpartisipasi bilang airdrop tidak banyak

Kerugian: 1. Pendapatan protokol karena bear chain tidak bagus terus menurun, puncak tidak keluarkan token sekarang keluarkan, puncak Maret sebulan 2.81 juta, bulan ini sampai sekarang hanya lebih dari 10 ribu 2. Tokenomics tidak diumumkan, komunitas juga tidak banyak diskusi

Satu-satunya kesempatan proyek adalah mengumpulkan chip saat semua orang jual, kemudian balik komunitas, mencapai kontrol chip, dapatkan posisi kontrak sepenuhnya, sehingga masih bisa untung一波 melalui kontrak, kalau tidak基本上 tidak ada kesempatan Buka tidak ingin接, tunggu setelah jual habis bisa stabil再说, dengan efek赚钱几个 proyek sebelumnya, perhatian pasar kembali ke ALPHA, proyek-proyek terakhir mulai panen, lebih猥琐一点吧.
Jika merasa konten kami bagus, bagikan akun publik kami ke teman-teman Anda! Selamat bergabung dan follow, pahami informasi terbaru dunia kripto!Setiap gelombang jatuh diikuti oleh lautan bintang, yang sangat bingung dengan tata布局 selanjutnya bisa follow Tianmeng,交硫葳:RFGH8689


Trending Cryptos

Related Questions

QApa yang menjadi fokus utama Wall Street terkait data ekonomi saat ini dan mengapa?

AWall Street saat ini lebih memfokuskan pada data bulan Januari karena berkaitan dengan kemungkinan penurunan suku bunga pada bulan tersebut. Data NFP terbaru memang memicu sedikit kenaikan dalam prediksi pasar tentang potensi penurunan suku bunga Januari, tetapi pergerakannya tidak signifikan.

QApa sinyal teknis untuk BTC berdasarkan analisis level daily, dan apa rekomendasi tradingnya?

APada level daily, BTC menunjukkan sinyal bearish: harga telah menembus below tren line, MACD mengalami death cross, dan terdapat potensi penurunan lebih lanjut. Rekomendasi tradingnya adalah melakukan short (jual) saat harga mencapai level resistance.

QDi level harga berapa analis merekomendasikan untuk mulai accumulation (akumulasi) BTC, dan mengapa level-level tersebut dipilih?

AAnalis merekomendasikan akumulasi pertama di range 78.800 - 77.250 USDT, yang merupakan area Bollinger Bands Middle Band pada chart 45-day. Jika harga jatuh di bawah 77.000 USDT, area akumulasi utama adalah di 75.000 - 74.600 USDT, yang merupakan level support dari Bollinger Bands lower band dan EMA52 pada chart 20-day.

QApa saja level support kunci untuk ETH dan di mana interval bottom (dasar) stagewise-nya diperkirakan?

ASupport penting untuk ETH termasuk Bollinger Lower Band (2.228 USDT) pada chart 10-15 day, EMA52 (2.752 USDT) pada chart 20-day, dan EMA52 (2.508 USDT) pada monthly chart. Interval bottom stagewise diperkirakan berada antara 2.222 - 2.112 USDT.

QBagaimana analis menilai potensi risiko dan imbal hasil untuk koin PTB?

AAnalis menilai PTB sebagai koin dengan risiko sangat tinggi dan imbal hasil (risk-reward ratio) yang buruk. Koin ini digambarkan seperti 'single-player coin' yang berbahaya baik untuk posisi long maupun short, dengan potensi penurunan drastis lebih dari 40% setelah kenaikan singkat, sehingga sangat tidak disarankan untuk trading.

Related Reads

Goldman Sachs: July Smashes Through Crowded Trades, U.S. Stock Bull Market Not Broken but Harder to Navigate

Goldman Sachs: July Sees Crowded Trades Unwound, U.S. Bull Market Intact but Getting Tougher. The U.S. stock market in July did not see an index-level crash, but rather a significant unwinding of speculative positions. While the S&P 500 remained stable—trading within a narrow 3.5% range and staying within 2% of its high—underlying market dynamics were volatile. Heavily crowded trades, particularly in high-momentum tech, AI-linked stocks, and Asian strategies, faced severe pressure and forced deleveraging. Data indicates this was a meaningful cleanse, not a minor adjustment. Global tech exposure saw its largest sell-off in over five years, leverage in Korean equity ETFs plummeted, and Goldman's prime brokerage recorded the largest gross exposure reduction since late 2022. Leverage on momentum factors among fundamental long/short clients fell to the 28th percentile of its one-year range. The AI trade narrative shifted from pure potential to a focus on tangible returns. While Meta failed to show clear AI monetization, Microsoft and Amazon provided evidence that massive capital expenditure is translating into scalable revenue and product growth, preventing a blanket sell-off of the AI sector. The Federal Reserve's more opaque communication style and volatility in long-end Treasury yields have introduced new friction, particularly for rate-sensitive growth and tech stocks. The broader outlook for U.S. equities remains favorable, supported by a strong economy, robust earnings, and substantial AI capital expenditure. However, risk/reward is no longer cheap, and the market's upward elasticity has weakened. The Nasdaq 100's trajectory—up 12% year-to-date despite significant pullbacks—illustrates that the bull trend persists but the path is becoming more difficult. The key lesson from July is that the market no longer rewards crowded, highly leveraged trades, requiring more disciplined and liquid portfolio approaches.

marsbit44m ago

Goldman Sachs: July Smashes Through Crowded Trades, U.S. Stock Bull Market Not Broken but Harder to Navigate

marsbit44m ago

Interview with Robinhood Executive: Meme + Tokenized US Stocks as "Barbell" Customer Acquisition Strategy, All Business Lines Achieve Hundreds of Millions in Revenue

Interview with Robinhood executive Johann Kerbrat reveals the company's "barbell" customer acquisition strategy for its new Robinhood Chain, combining meme tokens with tokenized stocks. Three weeks after mainnet launch, the chain has seen over $3B in weekly DEX volume and 105M transactions. Kerbrat explains the logic behind the permissionless chain: meme tokens attract DeFi users, while tokenized real-world assets (RWA), currently over 90 US stocks and ETFs accessible in 120+ countries, serve global users. The goal is to bring Robinhood's 27 million funded accounts on-chain by simplifying DeFi with a user-friendly interface, exemplified by features like Robinhood Earn which offers yield without requiring wallet management. Built on Arbitrum's technology stack for its speed, low cost, and Ethereum's security, the chain focuses on financial products like Earn, spot trading, and perpetuals. Kerbrat downplays direct competition with platforms like Base, emphasizing the goal of expanding the overall market for on-chain assets. He details selective partnerships (e.g., Morpho, Lighter) based on compliance, unique UX, and differentiation. While regulatory clarity is pending for US perpetuals, the expansion continues via Bitstamp in Europe. Finally, Kerbrat positions Robinhood as a "super app" integrating stocks, options, crypto, banking, and AI trading, with all major business lines generating hundreds of millions in revenue. For the chain, current priority is driving adoption over maximizing gas fee revenue.

marsbit2h ago

Interview with Robinhood Executive: Meme + Tokenized US Stocks as "Barbell" Customer Acquisition Strategy, All Business Lines Achieve Hundreds of Millions in Revenue

marsbit2h ago

Fidelity Q3 Report: BTC, ETH, and SOL Continue to Build Bottoms; How Much Further Will This Crypto Bear Market Go?

Fidelity's Q3 Crypto Signal Report analyzes the current bear market, noting Bitcoin (BTC), Ethereum (ETH), and Solana (SOL) are in a prolonged bottoming phase. Key indicators like the weighted Net Unrealized Profit/Loss (NUPL) have turned negative (-0.01), signaling the market is slightly below its aggregate cost basis, with BTC acting as the primary stabilizing asset. BTC's dominance has risen to 68%, indicating a lack of capital rotation to other digital assets. Performance has been weak across the board, with BTC, ETH, and SOL down significantly year-to-date. Market sentiment is depressed, exacerbated by substantial outflows from spot ETPs and a challenging macro environment. The report compares the current ~203-day downtrend to historical ~300-day bottoming cycles, suggesting the process may be two-thirds complete, with late 2026 as a potential timeframe to monitor. For Bitcoin, NUPL at 0.09 indicates cautious sentiment, while momentum signals remain negative. The Yardstick metric points to potential undervaluation relative to network security (hashrate). Ethereum's NUPL is deep in the "capitulation" zone at -0.43, a historically positive signal for future returns, though its momentum and network fee revenue are negative. Solana shows the deepest NUPL at -0.72 but demonstrates relative resilience in on-chain activity and stablecoin transfer volume. The report concludes that while several metrics are near historical capitulation levels, a definitive market bottom has not yet been established. The path forward likely involves continued consolidation, with BTC's relative strength and fundamental on-chain usage for ETH and SOL providing key areas for investor observation.

marsbit3h ago

Fidelity Q3 Report: BTC, ETH, and SOL Continue to Build Bottoms; How Much Further Will This Crypto Bear Market Go?

marsbit3h ago

Trading

Spot

Hot Articles

How to Buy IR

Welcome to HTX.com! We've made purchasing Infrared Finance (IR) simple and convenient. Follow our step-by-step guide to embark on your crypto journey.Step 1: Create Your HTX AccountUse your email or phone number to sign up for a free account on HTX. Experience a hassle-free registration journey and unlock all features.Get My AccountStep 2: Go to Buy Crypto and Choose Your Payment MethodCredit/Debit Card: Use your Visa or Mastercard to buy Infrared Finance (IR) instantly.Balance: Use funds from your HTX account balance to trade seamlessly.Third Parties: We've added popular payment methods such as Google Pay and Apple Pay to enhance convenience.P2P: Trade directly with other users on HTX.Over-the-Counter (OTC): We offer tailor-made services and competitive exchange rates for traders.Step 3: Store Your Infrared Finance (IR)After purchasing your Infrared Finance (IR), store it in your HTX account. Alternatively, you can send it elsewhere via blockchain transfer or use it to trade other cryptocurrencies.Step 4: Trade Infrared Finance (IR)Easily trade Infrared Finance (IR) on HTX's spot market. Simply access your account, select your trading pair, execute your trades, and monitor in real-time. We offer a user-friendly experience for both beginners and seasoned traders.

4.2k Total ViewsPublished 2025.12.17Updated 2026.06.02

How to Buy IR

Discussions

Welcome to the HTX Community. Here, you can stay informed about the latest platform developments and gain access to professional market insights. Users' opinions on the price of IR (IR) are presented below.

活动图片