Semiconductor Mid-Game Check-in: How Much Left in the Tail-End Rally?

marsbitDipublikasikan tanggal 2026-08-20Terakhir diperbarui pada 2026-08-20

Abstrak

Semiconductor Mid-Game Review: How Much is Left in the Rally? This analysis compares the current semiconductor market trend to NVIDIA's trajectory in 2024, drawing lessons on identifying market tops and bottoms. In July-August 2024, NVIDIA's stock fell 33%, triggered by a combination of "fundamental rumors" (Blackwell delays, antitrust probes) and "macro-driven asset selling" (BOJ rate hike leading to carry-trade unwinding). The low was marked by extreme panic selling across global markets. Key characteristics of a TOP include: Technical patterns like double tops or failure to break highs; Overcrowded and leveraged positioning (e.g., excessive retail and ETF inflows into a single stock like NVDA); High fragility where even a minor fundamental disappointment (e.g., a slight margin dip in stellar earnings) triggers a sharp correction. The practical action is to reduce exposure upon seeing technical warning signs combined with crowded trades. Key characteristics of a BOTTOM include: Technical reversal signals like a high-volume bullish engulfing pattern after a steep drop; Panic indicators hitting extremes (e.g., record VIX, major index crashes) signaling selling exhaustion; The downturn being driven by macro or systemic shocks unrelated to the company's core business fundamentals, creating a mispricing that quality companies eventually recover from. The conclusion is that while the current semiconductor rally may be in its later stages ("fish tail"), understanding these pa...

Author: XinGPT

The current semiconductor market trend somewhat resembles the script from Nvidia in 2024. Let's review what happened then:

From July 11 to August 5, 2024, Nvidia fell from around $134 to $90.94, a drop of 33%.
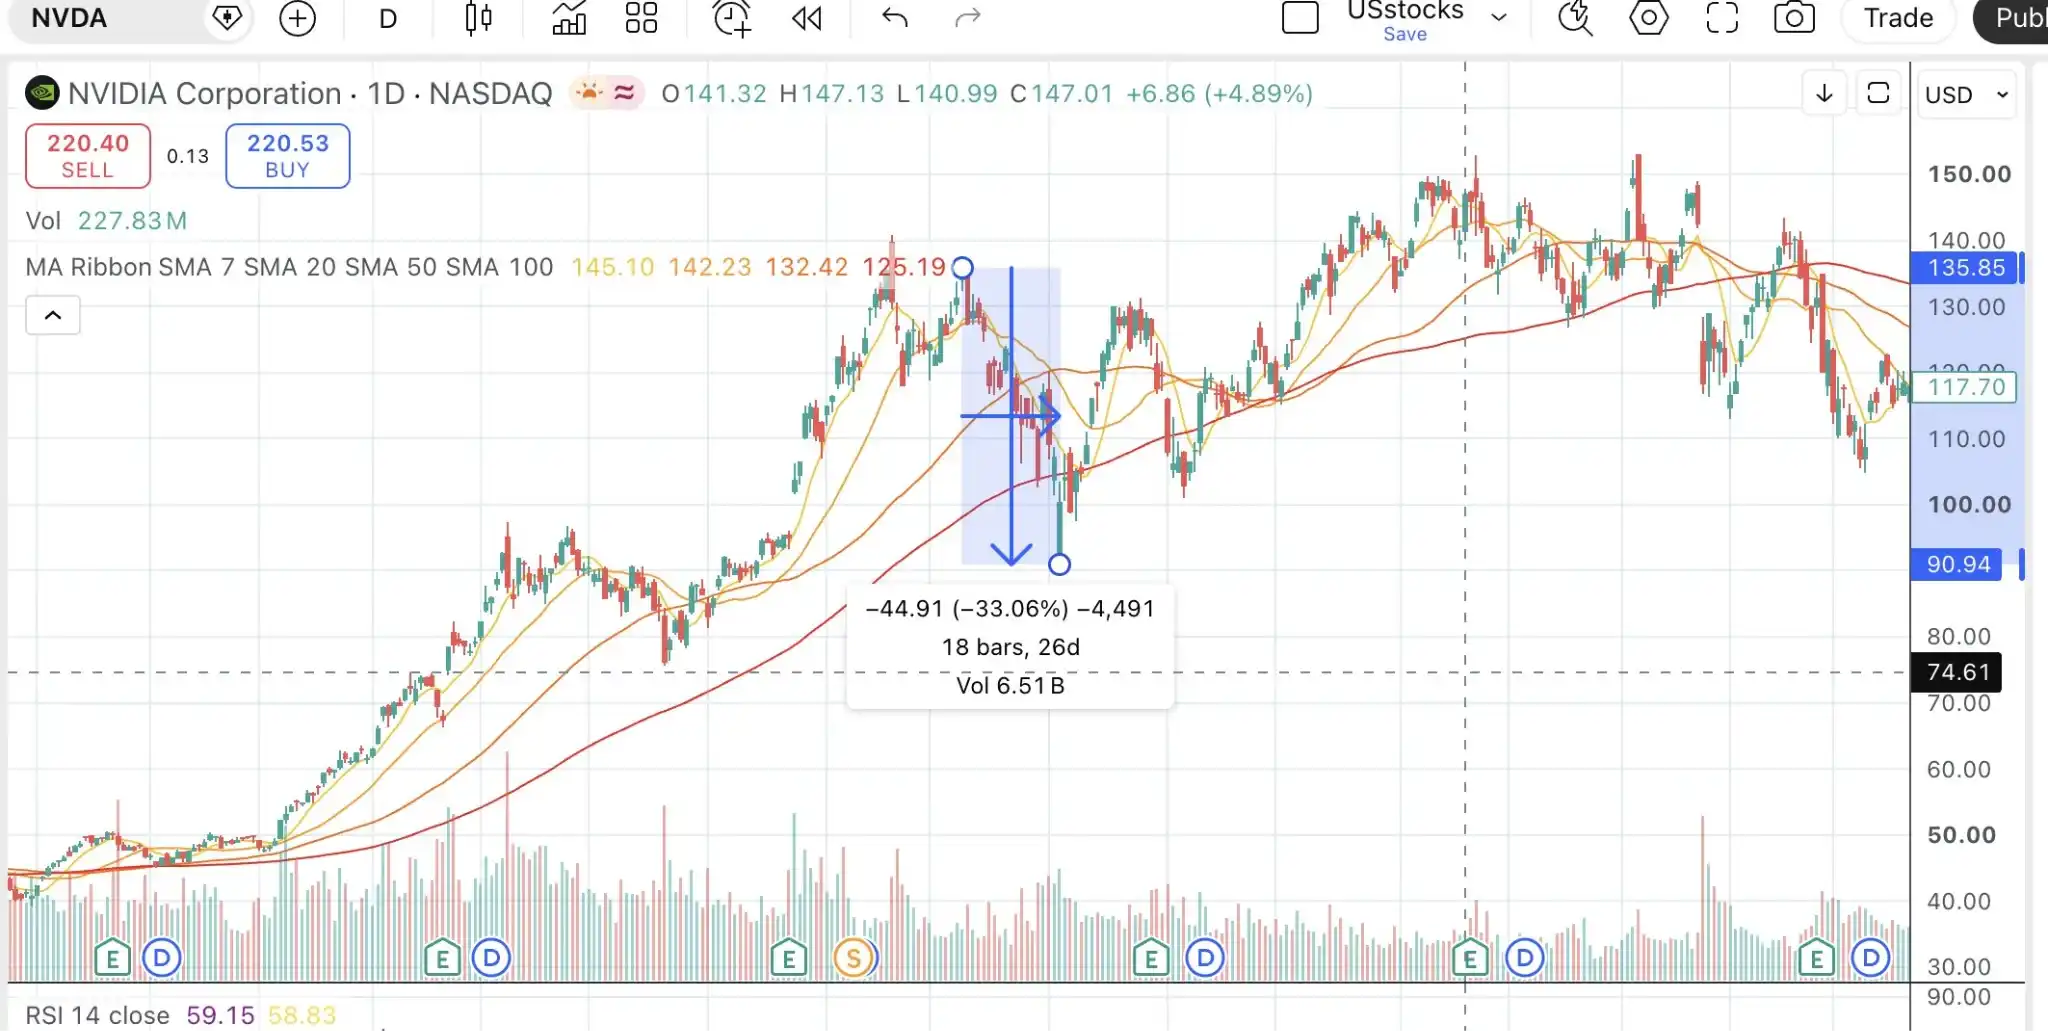
On the news front, triggers for the decline included rumors of Blackwell delays starting in July, reports of a US Department of Justice antitrust investigation, and finally, the Bank of Japan's interest rate hike on August 5th, which triggered carry trade unwinding and a panic sell-off in global risk assets, hitting the low. In other words, "a mix of fundamental rumors/small stories + macro-driven asset sell-off."

From August 8th to September 6th, over the course of a month, the stock rebounded from being oversold, coupled with some policy easing on the macro front; but it didn't surpass the previous high. Nvidia's "good but not perfect" earnings report triggered another decline.

Subsequently, on September 11th, Nvidia announced that Blackwell had entered full production and shipments would begin in Q4. Nvidia's stock rose 8% that day. Coupled with the Fed's first 50bp rate cut in 4 years, Nvidia's stock price broke to a new all-time high again on November 8th.

What can we learn from history?

1. What are the characteristics of a阶段性 (stage-wise) top?

Technical: Double top or failure to break through the previous high resistance level; simultaneously, candlestick patterns show bearish engulfing patterns;

Crowded positioning + high leverage: In June 2024, 70% of fund managers believed being long the Mag7 was the most crowded trade, while small-cap short interest approached historical records. The entire market was crowded on one side of the boat;

In the five trading days leading up to August 27, 2024, during another top interval for Nvidia's stock price, retail investors net bought $1.4 billion worth of NVDA. In the same period, the second-place, Tesla, was only at the $100-200 million level, a nearly tenfold difference. NVDL (the 2x Long NVDA ETF) had net inflows of $3.5 billion for the year and repeatedly became the most actively traded instrument intraday.

Fundamentals: On August 28th, Nvidia's earnings report showed revenue and guidance exceeding expectations, but because gross margin fell by 3%, the stock dropped nearly 7% after hours.

So, it's not hard to see that the characteristics of a stage-wise top are the emergence of topping patterns on the technical side, coupled with increased fragility in positioning (high concentration, high leverage). Once there's any hint of trouble in fundamentals or news, the stock price will immediately plummet.

The practical approach is: once technical characteristics appear for identification, and if positioning shows excessive leverage and concentration, one should immediately reduce holdings to hedge risks. Once the downtrend is confirmed, sell.

2. Bottom characteristics

Technical: On August 5th, a long-bodied candlestick after a gap down open, with sufficient volume — 553 million shares was the highest single-day trading volume in that period, exceeding all surrounding trading days. On August 6th, it closed above the previous day's body, confirming an engulfing pattern. On the 7th, a pullback did not break the previous low.

These three days formed the technical signal for a bottom.
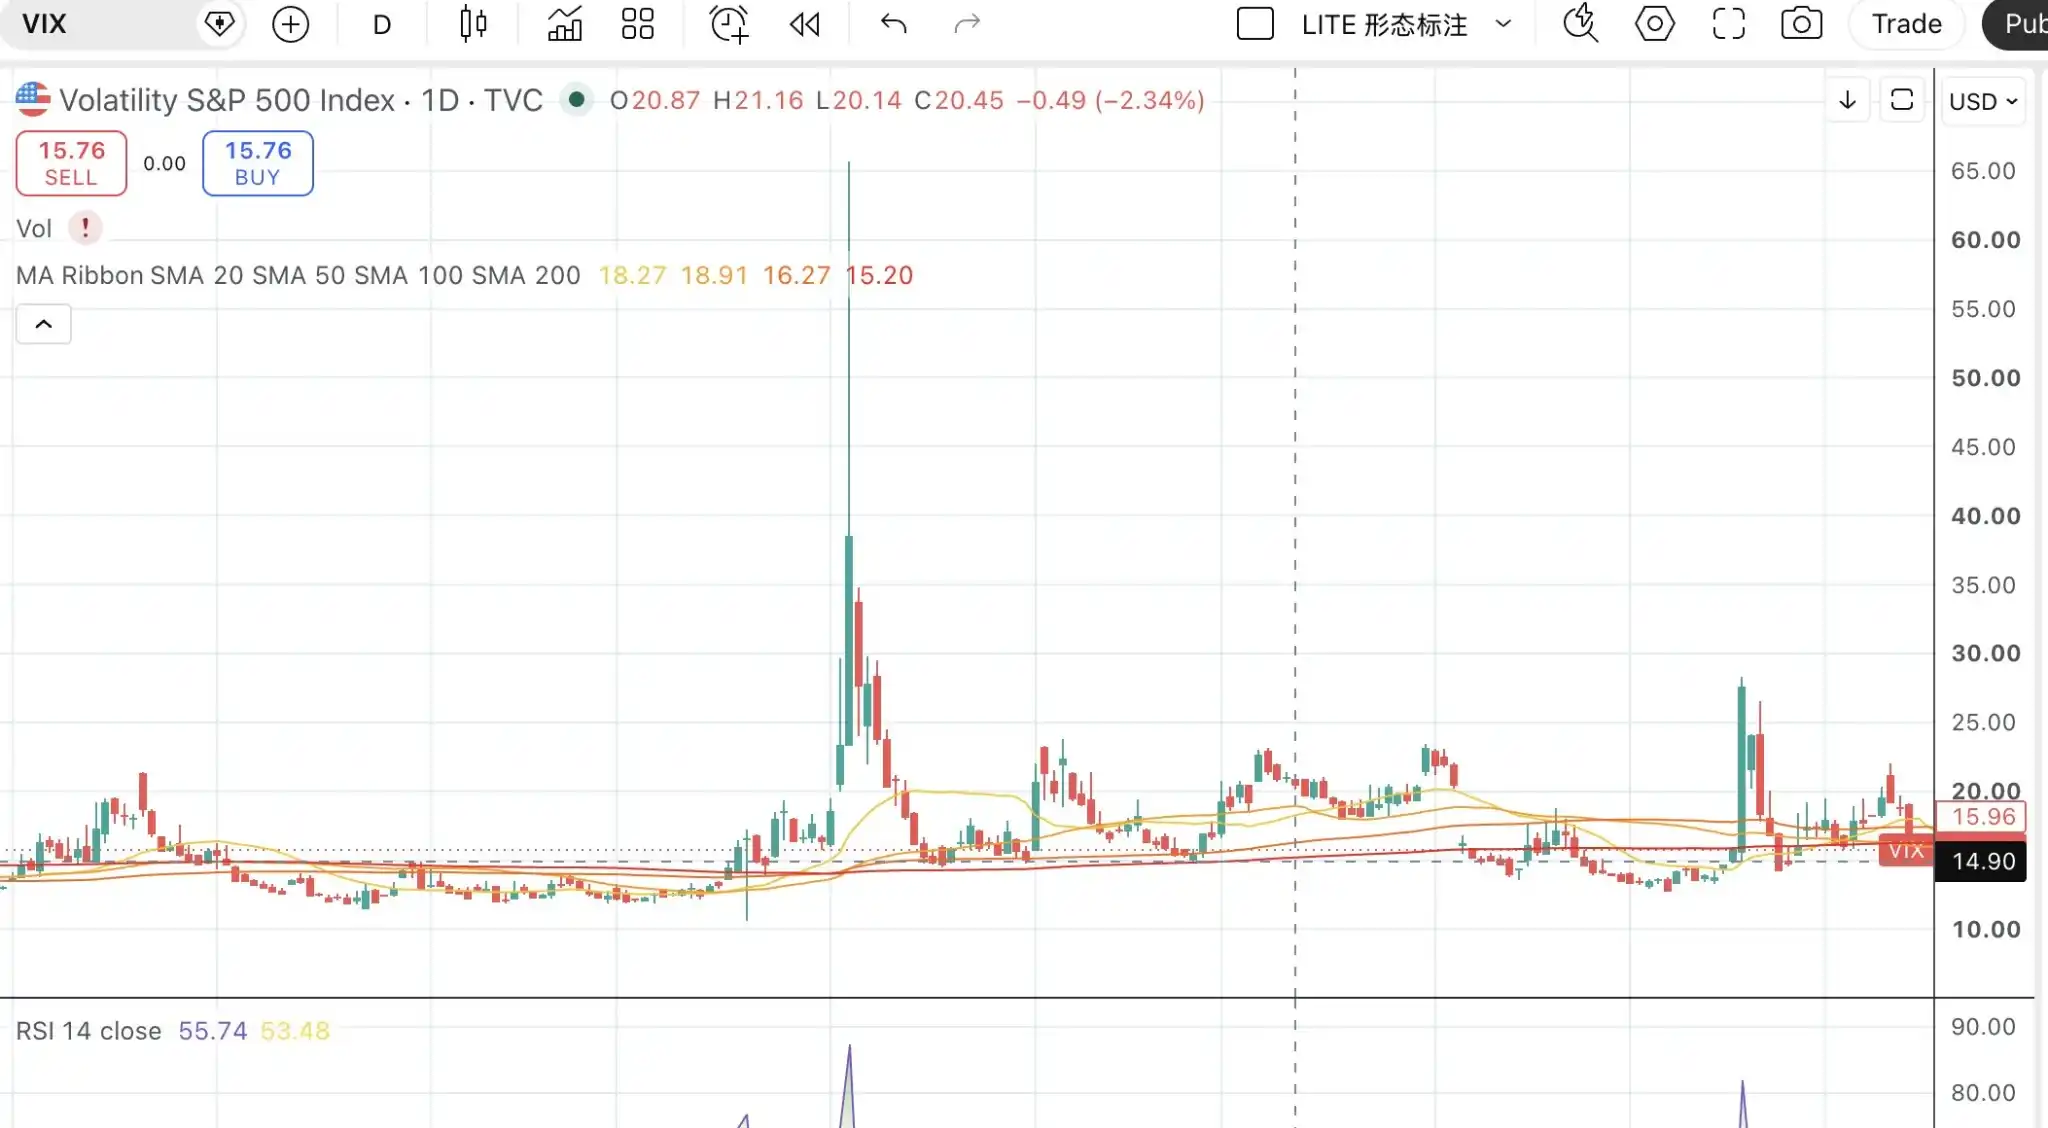
We further confirm with positioning: The VIX指数 (VIX index) hit a record that day, reaching 65 intraday (the third highest in history);外围市场 (peripheral markets) like the Nikkei were down -12.4% (largest since 1987), KOSPI down -9% triggering a circuit breaker. All market-level恐慌指标 (panic indicators) were off the charts, also meaning selling pressure reached an extreme;

Fundamentally, the main bearish trigger chain was the BoJ's rate hike on July 31st, yen carry trade unwinding, and the US July non-farm payrolls at 114k, far below expectations. This was a macro-driven sell-off for the broader market, unrelated to Nvidia's fundamentals.

The rebound on September 6th followed similar logic, just not as extreme as on August 5th.

We can also identify bottom characteristics: first, technical patterns begin to show bottoming formations, especially confirmed by volume; second, the logic of the decline does not touch the core business fundamentals of the enterprise. It's more often a one-off macro event or short-term shock for the broader market. Ultimately, quality companies will see their prices修复 (recover from) the erroneous sell-off.
Kripto yang Sedang Tren

Pertanyaan Terkait

QWhat is the main analogy the author draws to analyze the current semiconductor market situation?

AThe author analogizes the current semiconductor market situation to the script of Nvidia in 2024, specifically comparing the potential phase of the semiconductor cycle ('fish tail' phase) to Nvidia's price action pattern from mid-2024.

QWhat were the combined factors that led to Nvidia's sharp decline in July-August 2024 according to the article?

AThe sharp decline was triggered by a combination of factors: fundamental rumors (like Blackwell delay), regulatory news (DOJ antitrust investigation), and a macro event (the Bank of Japan's rate hike leading to carry trade unwinding and a panic sell-off in global risk assets).

QAccording to the article, what are the key characteristics of a 'stage top' (díng) in a stock's price movement?

AThe key characteristics are: technical chart patterns showing a top (like a double top or failure to break previous highs), crowded and highly leveraged capital inflows which increase fragility, and a subsequent negative catalyst from fundamentals or news that triggers a sharp price drop.

QWhat technical and market signals indicated the formation of a bottom for Nvidia on August 5, 2024?

AThe bottom was indicated by technical signals: a long-bodied bullish candlestick on high volume (the highest in that period) on August 5th, followed by a confirming pattern in the next two days. Market signals included extreme fear indicators like a spike in the VIX index and major sell-offs in other global markets, suggesting selling pressure had peaked.

QWhat practical trading advice does the article suggest once signs of a potential top appear?

AThe article suggests that once technical top signals appear, especially if accompanied by signs of excessive leverage and crowded positioning, an investor should immediately reduce position size to hedge risk. If a confirmed downtrend begins, one should sell the position.

Bacaan Terkait

Estafet 'Menyelamatkan Obligasi AS': Bessent Gagal Pekan Lalu, Pekan Ini Lihat Walsh

Upaya Menteri Keuangan AS Besant menstabilkan imbal hasil obligasi pemerintah jangka panjang melalui peningkatan pembelian kembali (buyback) ternyata hanya berdampak singkat. Alih-alih mendukung pasar obligasi, langkah tersebut justru memicu lonjakan harga emas dan Bitcoin sebagai "katup pelepas tekanan" bagi kecemasan pasar. Kini perhatian beralih ke Ketua Fed Walsh, yang diharapkan memberikan kejelasan dalam pidato Jackson Hole-nya. Pasar menantikan respons kebijakan Fed terkait inflasi yang masih tinggi dan kondisi fiskal yang memburuk. Jika Walsh gagal memberikan sinyal meyakinkan, tekanan jual pada obligasi jangka panjang bisa meningkat. Analis mengkritik langkah Besant sebagai terlalu kecil dibandingkan total utAS yang beredar. Solusi potensial yang dibahas adalah "Operation Twist" oleh Fed—menjual obligasi jangka pendek dan membeli obligasi jangka panjang untuk menekan imbal hasil—tanpa memperbesar neraca. Namun, ketegangan antara kebijakan moneter dan beban biaya bunga fiskal tetap menjadi tantangan. Data PCE yang dirilis Rabu akan menjadi petunjuk penting sebelum pidato Walsh. Sementara itu, tingkat imbal hasil obligasi 30-tahun AS di level 5% dianggap sebagai batas kritis. Jika tidak tembus, tekanan pada aset berisiko tinggi seperti sektor teknologi AI dan kredit privat akan meningkat. Investor seperti Ray Dalio menyarankan diversifikasi ke emas dan Bitcoin sebagai lindung nilai dari potensi krisis utang.

marsbit1j yang lalu

Estafet 'Menyelamatkan Obligasi AS': Bessent Gagal Pekan Lalu, Pekan Ini Lihat Walsh

marsbit1j yang lalu

Tiga Bulan Dua Putaran, "Palantir" Versi China Populer

**Ringkasan: Platform AI Cerdas Kausal versi China, "China's Palantir", Mengumpulkan Pendanaan Strategis Senilai Miliaran Yuan** Beijing Zhongshu Ruizhi Technology Co., Ltd. (Zhongshu Ruizhi), yang dianggap sebagai "Palantir-nya China", baru saja mengumumkan penyelesaian putaran pendanaan strategis senilai ratusan juta yuan. Pendanaan ini dipimpin oleh China Internet Investment Fund (CIIF) dan didukung oleh investor seperti Su Chuangtou National Social Security Fund, Financial Street Capital, ICBC Capital, dan Kunlun Capital. Ini adalah putaran pendanaan besar kedua perusahaan dalam tiga bulan, menunjukkan pengakuan pasar yang kuat terhadap teknologi inti dan kemampuan komersialisasinya. Didirikan pada tahun 2020 oleh Dr. Han Han, alumni doktoral Universitas Tsinghua dengan pengalaman di China Academy of Information and Communications Technology (CAICT), Zhongshu Ruizhi berfokus pada pengembangan AI keputusan yang andal untuk sektor industri. Perusahaan ini mengatasi tantangan kritis seperti "halusinasi AI" dan kurangnya kemampuan penalaran dalam model besar generatif dengan teknologi dasar yang orisinal, termasuk teori kognitif meta-kausal, pemodelan kausal, dan mesin ontologi dinamis. Teknologi ini memungkinkan AI membuat keputusan yang dapat dipercaya, dijelaskan, dan dapat dilacak untuk skenario industri yang kompleks dan toleransi kesalahan rendah. Zhongshu Ruizhi telah mencapai komersialisasi skala besar, melayani lebih dari 50 klien perusahaan milik negara dan grup industri di bidang tenaga listrik, minyak & gas, dan dirgantara, dengan lebih dari 800 skenario produksi kompleks yang diimplementasikan. Perusahaan melaporkan pendapatan yang berlipat ganda pada tahun 2025, menunjukkan kemampuan menghasilkan pendapatan yang kuat. Dana segar ini akan dialokasikan untuk penelitian teori dasar lebih lanjut, replikasi aplikasi percontohan yang matang untuk memperluas pasar, dan perekrutan talenta tinggi. Investor seperti CIIF melihat perusahaan sebagai pemain kunci dalam mendefinisikan paradigma AI industri yang andal dan mendorong perkembangan kekuatan produktif baru di China, terutama dalam mengamankan infrastruktur kritis dan membangun keamanan siber.

marsbit1j yang lalu

Tiga Bulan Dua Putaran, "Palantir" Versi China Populer

marsbit1j yang lalu

Trading

Spot

Artikel Populer

Cara Membeli CHECK

Selamat datang di HTX.com! Kami telah membuat pembelian Checkmate (CHECK) menjadi mudah dan nyaman. Ikuti panduan langkah demi langkah kami untuk memulai perjalanan kripto Anda.Langkah 1: Buat Akun HTX AndaGunakan alamat email atau nomor ponsel Anda untuk mendaftar akun gratis di HTX. Rasakan perjalanan pendaftaran yang mudah dan buka semua fitur.Dapatkan Akun SayaLangkah 2: Buka Beli Kripto, lalu Pilih Metode Pembayaran AndaKartu Kredit/Debit: Gunakan Visa atau Mastercard Anda untuk membeli Checkmate (CHECK) secara instan.Saldo: Gunakan dana dari saldo akun HTX Anda untuk melakukan trading dengan lancar.Pihak Ketiga: Kami telah menambahkan metode pembayaran populer seperti Google Pay dan Apple Pay untuk meningkatkan kenyamanan.P2P: Lakukan trading langsung dengan pengguna lain di HTX.Over-the-Counter (OTC): Kami menawarkan layanan yang dibuat khusus dan kurs yang kompetitif bagi para trader.Langkah 3: Simpan Checkmate (CHECK) AndaSetelah melakukan pembelian, simpan Checkmate (CHECK) di akun HTX Anda. Selain itu, Anda dapat mengirimkannya ke tempat lain melalui transfer blockchain atau menggunakannya untuk memperdagangkan mata uang kripto lainnya.Langkah 4: Lakukan trading Checkmate (CHECK)Lakukan trading Checkmate (CHECK) dengan mudah di pasar spot HTX. Cukup akses akun Anda, pilih pasangan perdagangan, jalankan trading, lalu pantau secara real-time. Kami menawarkan pengalaman yang ramah pengguna baik untuk pemula maupun trader berpengalaman.

785 Total TayanganDipublikasikan pada 2026.01.19Diperbarui pada 2026.06.02

Cara Membeli CHECK

Diskusi

Selamat datang di Komunitas HTX. Di sini, Anda bisa terus mendapatkan informasi terbaru tentang perkembangan platform terkini dan mendapatkan akses ke wawasan pasar profesional. Pendapat pengguna mengenai harga CHECK (CHECK) disajikan di bawah ini.

活动图片