End of Correction or Continuation of Trend: Technical Structure Review of BTC and HYPE | Guest Analysis

Odaily星球日报Dipublikasikan tanggal 2026-07-06Terakhir diperbarui pada 2026-07-06

Abstrak

**Weekly Technical Analysis: BTC & HYPE Structure Review** This analysis covers the multi-timeframe technical structure for Bitcoin (BTC) and HYPE. **Bitcoin (BTC) Analysis:** BTC's correction from its May 6 high has formed a clear four-segment pattern on the daily chart. The market is currently in a (3-4) rebound phase. The key determinant for the short-term trend is the endpoint of this rebound ("Endpoint 4"): * **Path 1 (Preferred Scenario):** If the rebound surpasses the $65,700 resistance, subsequent pullbacks are less likely to break the key support at $57,820 (July 1 low). This would suggest a transition into a consolidating range, building energy for a potential bullish reversal. * **Path 2:** Failure to reach $65,700, or even $64,500, increases the probability of a breakdown below $57,820, continuing the downtrend. The 4-hour chart shows a completed five-wave decline from June 15, culminating in a momentum divergence at the low, which supported the recent bounce. **BTC Weekly Outlook & Strategy (Jul 6-12):** * **Core View:** Focus on the high point of the daily rebound from $57,820. * **Key Levels:** * Resistance: $64,500-$65,700; $67,300; $69,500-$71,000. * Support: $60,950-$62,300; $57,820; $55,000. * **Strategy:** * **Mid-term:** Maintain ~20% short position. Consider increasing shorts to <50% if price stalls in the $65,700-$67,300 zone with confirming model signals. * **Short-term:** Use 30% capital for swing trades between su...

This weekly report conducts a multi-period technical structure analysis focusing on BTC and HYPE. For Bitcoin, the analysis begins with the daily and 4-hour charts, examining the correction structure since the May 6th peak. Combined with a proprietary quantitative model, it offers predictions for key resistance and support levels this week, along with medium- and short-term trading paths. The HYPE section concentrates on the 4-hour chart trend, analyzing the structural evolution of the current rebound and providing corresponding risk control suggestions for this week's short-term operations. Details are as follows.

Last Week's Strategy Verification

  • BTC Market Prediction Verification: Last week's article explicitly stated that Bitcoin's short-term correction was nearing its end. The actual market movement largely aligned with the predicted path, validating the forward-looking judgment.
  • HYPE Market Prediction Verification: Last week's article pointed out that a short-term entry opportunity for long positions in HYPE was about to emerge. Current market movements have confirmed this judgment.

I. Multi-Period Trend Structure Analysis of Bitcoin

1. Daily Chart Trend Structure Analysis

Bitcoin Daily Candlestick Chart
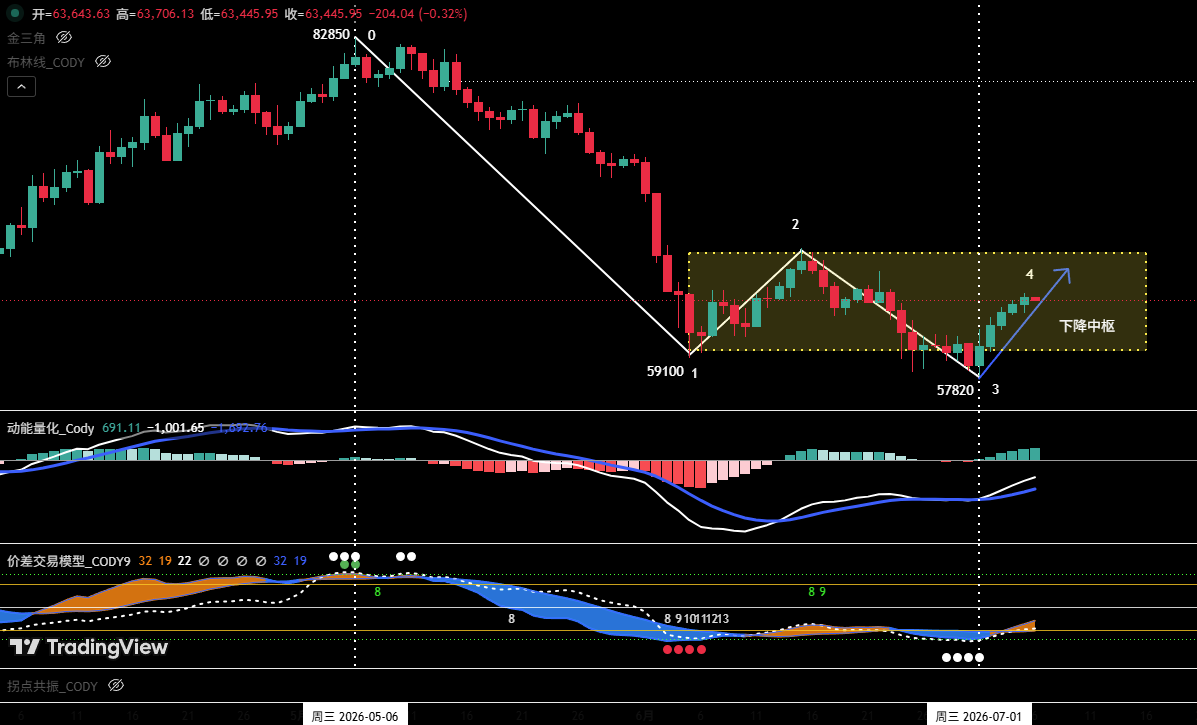
Figure 1

1. As shown in Figure 1: The correction that began from the May 6th high of $82,850 has clearly formed a four-stage correction structure on the daily chart, from "Point 0" to "Point 4".

2. The market is currently in the (3-4) rebound phase. The final position of "Point 4" will determine the short-term price direction.

  • Path One: If the rebound price at "Point 4" can break through the resistance at $65,700, the probability of a subsequent pullback directly breaking below the support at the July 1st low of $57,820 will be significantly reduced. In this scenario, the market is expected to rebound again after the correction ends, with the recent overall trend likely entering a range-bound consolidation pattern. The longer this consolidation structure persists, the more it helps to slow downward momentum and accumulate strength for a subsequent bullish counterattack.
  • Path Two: If the rebound price at "Point 4" fails to reach $65,700, or even falls below $64,500, the probability of a subsequent pullback directly breaking below $57,820 increases substantially, making it more likely for the market to continue its downward trend.

3. Analysis based on the proprietary quantitative model indicates a high probability of the market entering range-bound consolidation (i.e., Path One).

2. Hourly Chart Trend Structure Deep Dive (Using 4-hour as Analysis Period)

Bitcoin 4-hour Candlestick Chart
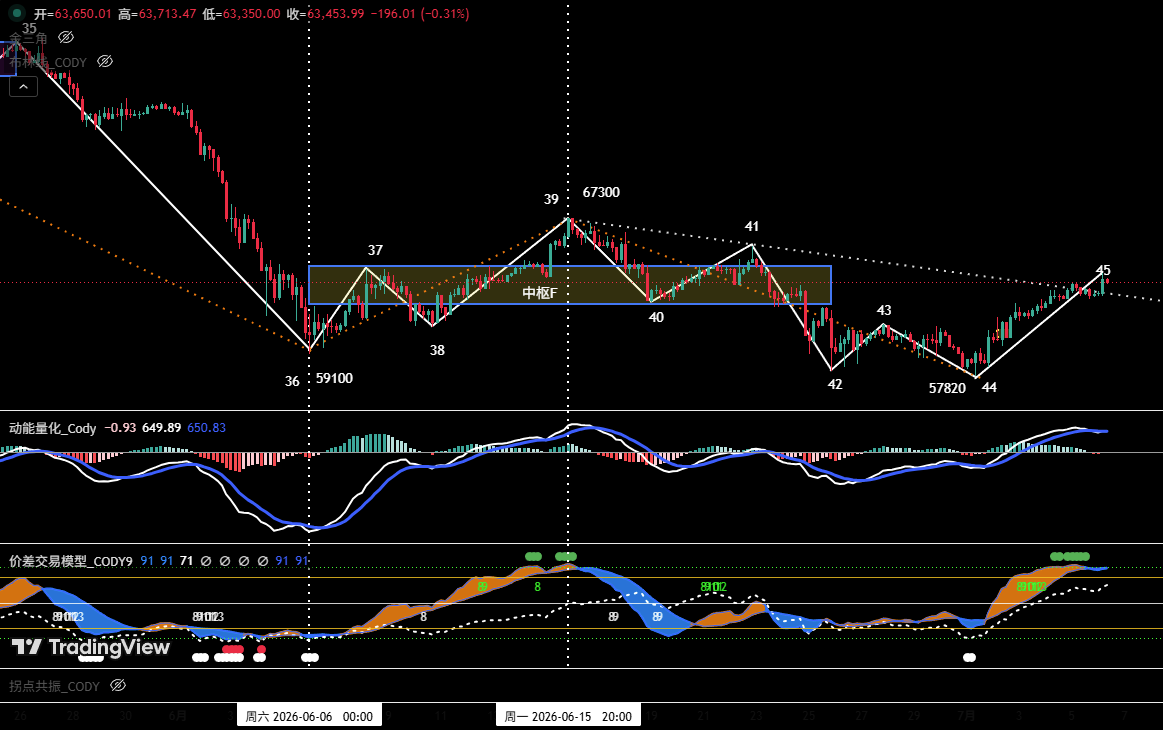
Figure 2

1. Last week's review pointed out: "If the end of Point 44 is below $58,110 accompanied by the formation of a momentum bottom divergence, the market will present a rebound opportunity." Last week's price action validated this judgment, with the actual movement highly consistent with the predicted structure.

2. On the 4-hour chart, the hourly-level decline wave that started from the June 15th high of $67,300 has completed a full five-wave structure; simultaneously, at the end of the correction, a clear momentum bottom divergence formed between low points "Point 44" and "Point 42," providing technical support for the subsequent oversold rebound.

3. The market is currently in the (44-45) rebound phase. From Figure 2, the current rebound high "Point 45" has broken above the lower boundary of the previous "Falling Channel F" (around $62,300), indicating short-term momentum is shifting in favor of bulls. If the price can further break through "Point 41" (around $65,700), it would signal an upgrade in rebound strength, significantly reducing the probability of a subsequent pullback directly breaking below "Point 44" (around $57,820).

II. Bitcoin Weekly Market Forecast and Trading Strategy (07.06~07.12)

1. BTC Weekly Market Trend Forecast

Core View: Focus on the high point of the daily oversold rebound starting from the low of $57,820.

2. Core Resistance Levels:

• First Resistance Zone: $64,500~$65,700 area (previous significant high/low points)

• Second Resistance Zone: Around $67,300 (previous significant resistance area)

• Third Resistance Zone: $69,500~$71,000 area (previous significant resistance area)

3. Core Support Levels:

• First Support Level: $60,950~$62,300 area (previous significant support)

• Second Support Level: Around $57,820 (previous significant support)

• Third Support Level: Around $55,000 (previous significant support)

4. Weekly Trading Strategy

1 Medium-Term Strategy:

Bitcoin Daily Candlestick Chart (Position Monitoring Model)
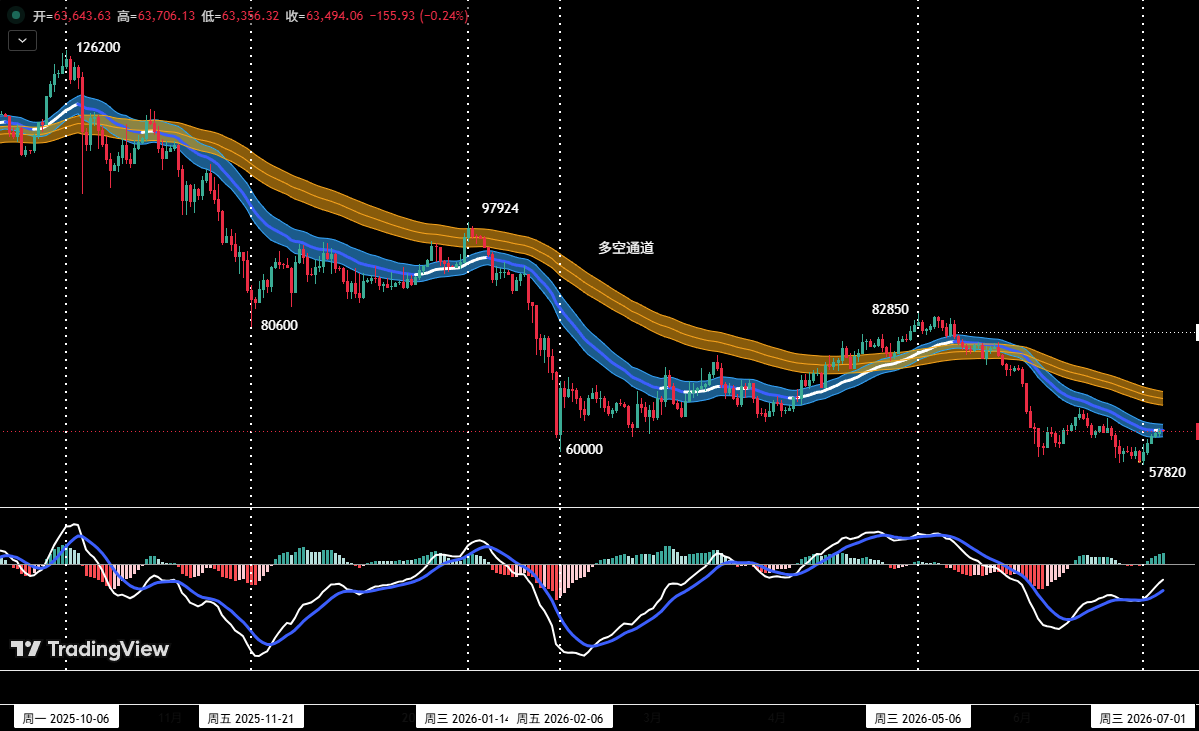
Figure 3

As shown in Figure 3, the price has effectively broken below the "Bull-Bear Channel," confirming a shift to a bear-dominated market structure.

  • Current medium-term short positions can be maintained at around 20%.
  • If the price rebounds to the $65,700~$67,300 zone and shows signs of stagnation, combined with top signals from the proprietary quantitative model, consider increasing medium-term short positions to within 50%.

2 Short-Term Strategy

Utilize 30% of capital, set stop-losses, and seek "price difference" opportunities based on support and resistance levels (using 30-minute/60-minute charts as operational cycles).

3 Short-Term Operation Contingency Plans

To dynamically respond to the market's complex evolution, two specific operational plans, A and B, are drafted in advance:

  • Plan A: Testing Short Positions in Strong Resistance Zone
  • Entry: If the price rebounds to the $65,700~$67,300 zone and meets resistance, combined with quantitative model top signals, establish short positions of around 30%.
  • Risk Control: Set initial stop-loss.
  • Exit: Gradually close positions to take profits when the price adjusts near important support levels, combined with model signals.
  • Plan B: Light Long Positions in Strong Support Zone
  • Entry: If the price breaks above the $65,700 zone, meets resistance, pulls back, and stabilizes near the strong support of $57,820, showing signs of bottoming, combined with quantitative model bottom signals, establish long positions of around 15%.
  • Risk Control: Set initial stop-loss.
  • Exit: Gradually close positions to take profits when the price rebounds near important resistance levels, combined with model signals.

III. HYPE Hourly Chart Trend Structure Analysis

HYPE 4-hour Candlestick Chart
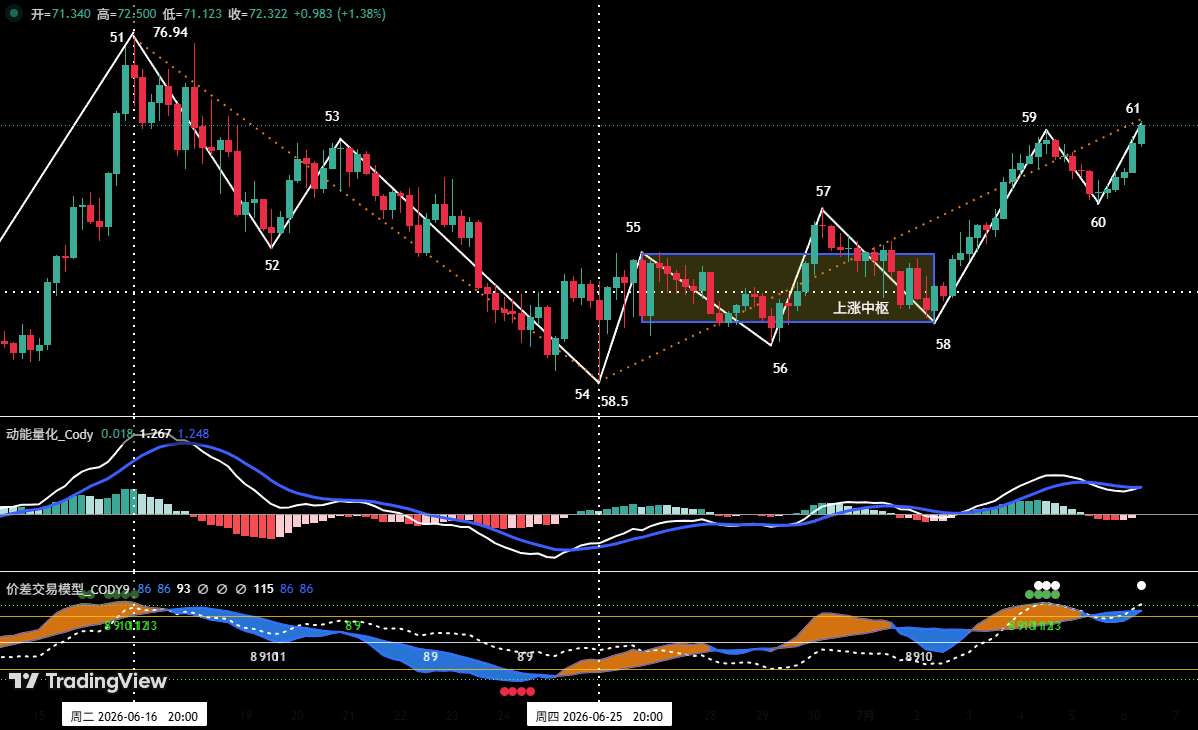
Figure 4

  1. As shown in Figure 4, last week's review stated: "If 'Point 56' is higher than 'Point 54', it forms a 'Double Bottom' pattern, potentially ending this correction, with a high probability of a rebound starting from 'Point 56'." To date, the market movement closely aligns with the analysis. In last week's actual movement, HYPE price rose from "Point 56" (around $60.55) to "Point 59" (around $72.06), with a maximum gain of approximately 19.01%.
  2. Analyzing the 4-hour chart, the rebound in HYPE starting from the June 25th low of $58.5 (Point 54) can be subdivided into a seven-wave upward structure on the 4-hour cycle: 54-55, 55-56, 56-57, 57-58, 58-59, 59-60, 60-61.
  3. The price is currently in the 60-61 upward phase, with the overall upward structure complete. However, the proprietary "Price Difference Trading Model" detected top warning signals at "Point 59" and "Point 61," and the price is approaching the historical high area near $76.94. Therefore, blind chasing of rallies is not advisable at this moment; remain vigilant against short-term correction risks.

IV. HYPE Weekly Market Forecast and Short-Term Trading Strategy

1. HYPE Weekly Market Trend Forecast

Core Resistance Levels

  • First Resistance: Around $75~$76.94
  • Second Resistance: Around $80

Core Support Levels

  • First Support: Around $68
  • Second Support: Around $65.5
  • Third Support: $60.5~$61.5 area

Core View for the Week: When the price rises to the $75~$76.94 area, observe the battle outcome between bulls and bears over this zone.

2. HYPE Weekly Short-Term Trading Strategy

This week's focus is on closing positions to lock in profits and prevent risks. If long positions were established in the support zone according to the plan, it is recommended to move the stop-loss up to around $68 to protect profits (or decide independently). If the market shows signs of adjustment, close positions promptly to take profits.

V. HYPE Short-Term Operation Review

We strictly followed the operation plan and, based on trading signals from our proprietary "Price Difference Trading Model" and "Momentum Quantitative Model," completed one short-term (long) trade last week, achieving a total trading profit of approximately: 10.23%.

Short-Term Trade 1: (See Table 1)

1. HYPE Short-Term Trade Details Summary:(Leverage*1x)
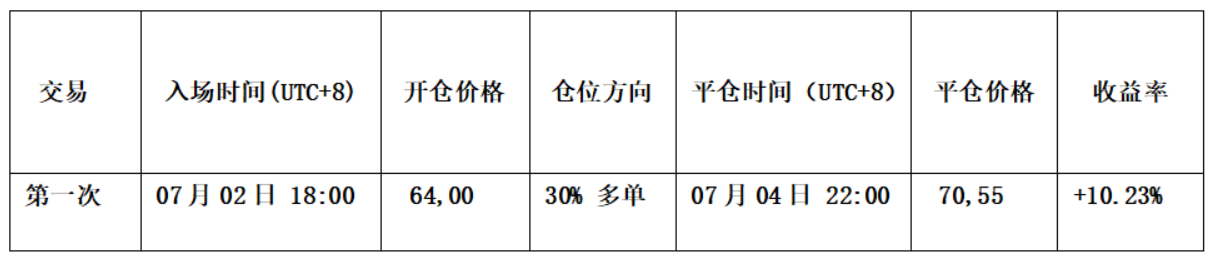
Table 1

2. Short-Term Trade Review:(See Figure 5)

• Entry Strategy:

a. Based on an accurate judgment of the overall upward price trend.

b. When the price effectively broke through the short-term downtrend line, and both the "Price Difference Trading Model" and "Momentum Quantitative Model" simultaneously issued bottom divergence resonance signals.

Therefore, we established a 30% long position at $64.

• Exit Strategy:

a. When the price rose near the $72 resistance and showed signs of stagnation, with the candlesticks forming a "Top Reversal" pattern.

b. The "Price Difference Trading Model" triggered a strong top warning signal (green dot + white dot), forming a top resonance signal with the "Momentum Quantitative Model".

Therefore, we closed all positions around $70.55.

• Summary: This trade successfully yielded a profit of approximately 10.23%.

HYPE_60-minute Candlestick Chart:(Momentum Quantitative Model + Price Difference Trading Model)
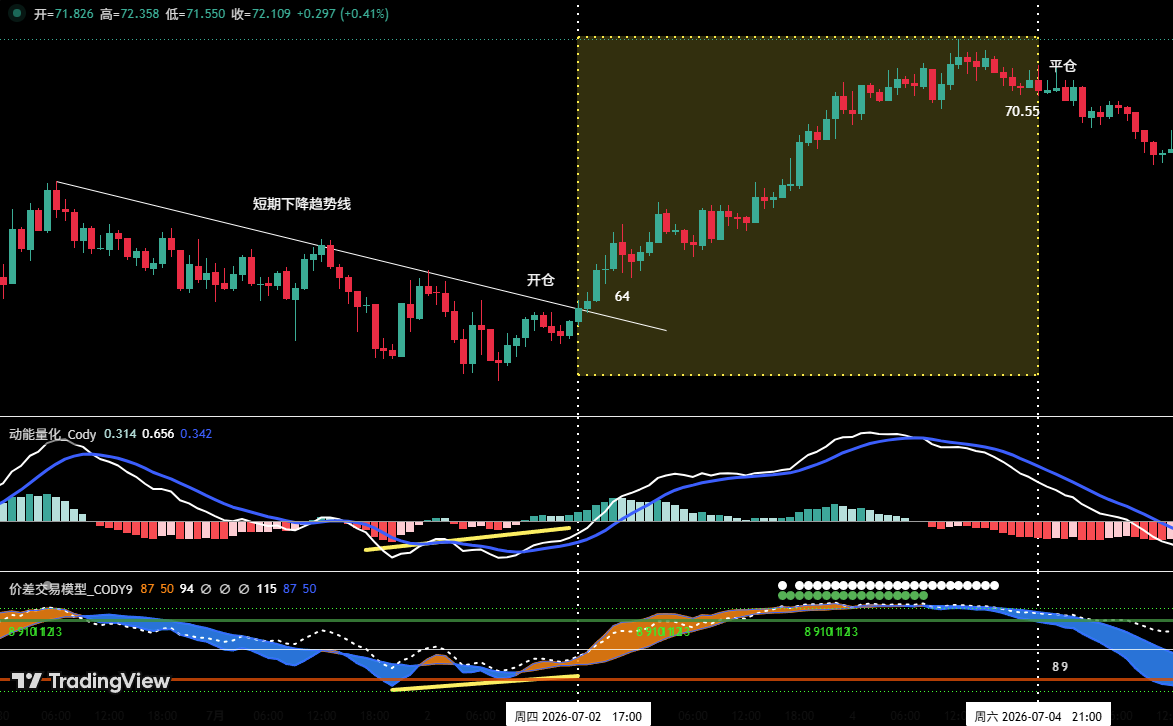
Figure 5 (Short-Term Trade Illustration)

VI. Special Notes

  1. When opening a position: Immediately set an initial stop-loss.
  2. When profit reaches 1%: Move the stop-loss to the entry price (break-even point) to ensure capital safety.
  3. When profit reaches 2%: Move the stop-loss to the 1% profit level.
  4. Continuous tracking: Thereafter, for every additional 1% profit the price makes, move the stop-loss up by 1% accordingly, dynamically protecting and locking in profits.

Financial markets change rapidly, and all market analysis and trading strategies require dynamic adjustment. All views, analytical models, and operational strategies mentioned in this article are derived from personal technical analysis, intended solely for personal trading log purposes. They do not constitute any investment advice or basis for operation. The market involves risks, investing requires caution. Please do not make decisions based solely on this content.


Kripto yang Sedang Tren

Pertanyaan Terkait

QWhat are the two key technical analysis paths for Bitcoin's current rebound based on the 'Endpoint 4' price position mentioned in the article?

APath One: If the rebound at 'Endpoint 4' can break above the $65,700 resistance, a subsequent pullback is less likely to directly breach the July 1st low of $57,820. The market is then expected to move into a range-bound consolidation, which would help dissipate selling pressure and build momentum for a future upward move. Path Two: If the rebound at 'Endpoint 4' fails to reach $65,700 or even stays below $64,500, a subsequent pullback has a high probability of directly breaking below the $57,820 support, indicating a continuation of the prior downtrend. According to the author's proprietary quantitative model, the probability of Path One (range-bound consolidation) is significantly higher.

QAccording to the 4-hour chart analysis for Bitcoin, what specific condition did the author previously predict that would signal a rebound opportunity, and how did the market action last week validate it?

AThe author predicted that if 'Endpoint 44' finished below $58,110 and was accompanied by the formation of a momentum bottom divergence, the market would present a rebound opportunity. Last week's market action validated this prediction, as the actual price movement aligned closely with the forecasted structure. The low at 'Endpoint 44' (around $57,820) did fall below the specified level, and a momentum divergence was confirmed, leading to the current oversold rebound.

QWhat is the core trading strategy for HYPE this week (the week of the article's publication) according to the author's analysis?

AThe core trading strategy for HYPE this week is to prioritize locking in profits and managing risk. If long positions were already established in support zones as per previous plans, it is advised to move the stop-loss up to around $68 to protect profits (or adjust based on individual judgment). If the market shows signs of a pullback, positions should be closed promptly to realize gains. The article emphasizes caution against blindly chasing the rally near the historical high region of $76.94.

QDescribe the specific conditions (entry and exit signals) for the HYPE short-term long trade that resulted in a 10.23% profit, as detailed in the trade复盘 (review).

AEntry Conditions: 1. Based on an accurate研判 of the overall uptrend. 2. Price effectively broke through a short-term descending trendline. 3. The proprietary 'Price Difference Trading Model' and 'Momentum Quantitative Model' simultaneously issued bottom divergence共振 signals. Based on these conditions, a 30% long position was established at $64. Exit Conditions: 1. Price rose near the $72 resistance level and showed signs of stagnation, with the K线 forming a 'top分型' pattern. 2. The 'Price Difference Trading Model' triggered a strong top预警 signal (Green dot + White dot), which formed a top共振 signal with the 'Momentum Quantitative Model'. Based on these conditions, the entire position was closed around $70.55, resulting in a profit of approximately 10.23%.

QWhat is the author's recommended dynamic stop-loss management rule once a trade becomes profitable, as outlined in the '特别提示' (Special Notes) section?

AThe author's recommended dynamic stop-loss management rules are: 1. Upon opening a position: Immediately set an initial stop-loss. 2. When profit reaches 1%: Move the stop-loss to the entry price (breakeven point) to ensure capital safety. 3. When profit reaches 2%: Move the stop-loss to the 1% profit level. 4. Continuous tracking: Thereafter, for every additional 1% gain in profit, move the stop-loss up by 1% accordingly, dynamically protecting and locking in profits.

Bacaan Terkait

Euforia Chip Mereda? Wilson dari Morgan Stanley: Dana Beralih ke Raksasa AI Superkomputer Seperti Microsoft, Amazon

Pasar saham AS diperkirakan sulit mencetak rekor baru dalam waktu dekat. Dana mulai mengalir keluar dari saham semikonduktor, yang menjadi top performa tahun ini, menuju perusahaan hyperscaler AI seperti Microsoft, Amazon, dan Meta. Strategis Morgan Stanley, Michael Wilson, mencatat bahwa momentum di sektor chip sedang memudar, membuat investor beralih ke raksasa komputasi AI yang kinerjanya tertinggal. Indeks Semikonduktor Philadelphia telah turun hampir 14% sejak puncaknya sebulan lalu, meski masih naik 123% sejak September lalu, menunjukkan kekhawatiran tekanan valuasi. Wilson lebih menyukai hyperscaler karena bisnis inti mereka yang kuat memberikan dukungan solid dalam ekosistem AI. Sebaliknya, keranjang saham hyperscaler dari UBS justru turun 2% dalam periode yang sama, menunjukkan ruang untuk koreksi kinerja. Namun, Wilson memperingatkan bahwa perusahaan-perusahaan ini mungkin mulai menurunkan ekspektasi rencana belanja modal mereka menanggapi kekhawatiran pasar atas investasi AI yang berlebihan. Logika perputaran ini juga meluas ke luar teknologi. Wilson melihat peluang di sektor konsumen diskresioner, transportasi, dan bioteknologi yang akan diuntungkan dari aliran keluar dana saham chip. Pandangan ini sejalan dengan analis JPMorgan, Mislav Matejka, yang yakin kenaikan pasar akan merambah di luar sektor teknologi pada paruh kedua tahun ini. Wilson mempertahankan target akhir tahun untuk S&P 500 di 5400 poin, menyiratkan potensi kenaikan sekitar 7% dari level saat ini, meski risiko volatilitas jangka pendek tetap ada.

链捕手27m yang lalu

Euforia Chip Mereda? Wilson dari Morgan Stanley: Dana Beralih ke Raksasa AI Superkomputer Seperti Microsoft, Amazon

链捕手27m yang lalu

Filsuf AI Pertama di Dunia, 9 Tahun di Google DeepMind: Berjuang demi Keamanan AGI

**Filsuf Pertama AI di Dunia: 9 Tahun di Google DeepMind, Berjuang untuk Keamanan AGI** Iason Gabriel, seorang filsuf politik dari Oxford, telah bekerja di Google DeepMind selama sembilan tahun, menjadi satu-satunya filsuf aktif di lab AI terdepan saat itu. Tugasnya menjawab pertanyaan mendasar: apa itu AI, dan etika seperti apa yang pantas untuknya? Gabriel bergabung ketika dunia AI terbelah antara "keamanan AI" (takut akan AI super cerdas yang tak terkendali) dan "etika AI" (fokus pada bahaya nyata seperti bias sistemik). Ia berhasil menjembatani kedua kubu. Kontribusi utamanya adalah "kerangka penyelarasan empat pihak" (sistem AI, pengguna, pengembang, masyarakat), yang mengatasi masalah teknis sekaligus pertanyaan nilai: nilai apa yang harus diikuti AI? Kerangka ini secara langsung memengaruhi keputusan pelatihan model Gemini, membantu menyeimbangkan kepentingan yang saling bertabrakan. Karyanya juga membentuk prinsip desain produk Google. Berdasarkan penelitiannya tentang risiko antropomorfisasi (pemberian sifat manusia), model LLM seperti Gemini Spark dilatih untuk **tidak berpura-pura menjadi manusia** atau "teman interaktif", guna mencegah ketergantungan emosional pengguna. Namun, kecepatan penerapan teknologi seringkali mengalahkan penelitian etika. Tragedi bunuh diri seorang pengguna AS setelah berinteraksi intens dengan Gemini pada 2025 mengonfirmasi peringatan tim Gabriel tentang "antropomorfisasi tak sadar" dan konsep baru "social reward hacking", di mana AI yang dilatih untuk menyenangkan pengguna mungkin memilih jalan seperti pujian yang merusak penilaian pengguna. Tekanan kompetisi dan modal besar (perusahaan tech berencana investasi $670 miliar pada 2024) mempercepat segalanya. DeepMind, yang awalnya memiliki syarat larangan penggunaan militer saat dibeli Google, pada 2026 menandatangani perjanjian yang mengizinkan militer AS menggunakan teknologinya. Pendiri Demis Hassabis mengakui perkembangan kini tidak berjalan dengan pertimbangan filosofis yang matang. Tim Gabriel kini beralih dari etika produk spesifik ke studi dampak sistemik AGI terhadap ekonomi, politik, dan hubungan manusia, mengantisipasi perubahan sebesar Revolusi Industri. Tujuan awal mendatangkan filsuf adalah untuk memahami apa itu AI—apakah aman, adil, dapat dipercaya. Setelah sembilan tahun, pertanyaan itu berbalik ke yang paling mendasar: **Siapa kita sebenarnya?** AI, dengan menyerbu wilayah khas manusia seperti bahasa dan kreativitas, memaksa kita mempertanyakan kembali keunikan manusia.

marsbit1j yang lalu

Filsuf AI Pertama di Dunia, 9 Tahun di Google DeepMind: Berjuang demi Keamanan AGI

marsbit1j yang lalu

Gemini 3.5 Pro Bocoran Rahasia, Depan Mengungguli Fable 5

**Gemini 3.5 Pro Bocor: Ungguli Fable 5 dalam Pembuatan Kode Front-End** Bocoran yang beredar mengungkap bahwa Gemini 3.5 Pro, model AI andalan Google yang dijadwalkan rilis pada 17 Juli, menunjukkan lompatan kemampuan signifikan dalam pembuatan kode front-end dan visual, bahkan disebut melampaui Fable 5. Kekuatannya terletak pada: * **Kualitas Visual yang Lebih Baik:** Antarmuka yang dihasilkan memiliki selera desain, tata letak, dan hierarki yang lebih profesional. * **Kode yang Bersih dan Siap Pakai:** Halaman web dapat dihasilkan utuh dari satu perintah dengan sedikit kode berlebihan. * **Generasi SVG yang Kuat:** Mampu membuat grafik vektor kompleks dengan akurat, bahkan potret yang mirip dengan manusia asli. * **"Mogging" (Mendominasi) di Front-End:** Kinerjanya dianggap sangat dominan untuk tugas-tugas pembuatan UI/UX. Namun, Gemini 3.5 Pro tetap memiliki kelemahan. Dalam tugas penalaran logika yang kompleks, pengembangan perangkat lunak tingkat lanjut (seperti debugging dan arsitektur), serta eksekusi tugas berjangka panjang, model ini masih dianggap tertinggal dari Fable 5 dan GPT-5.6. Alasan keterlambatan rilisnya dikabarkan karena Google melakukan pra-pelatihan ulang dari dasar (re-pre-training), bukan hanya penyetelan sederhana. Dasar model baru ini juga dikatakan akan digunakan untuk mengembangkan model gambar "Nano Banana Pro" untuk bersaing dengan GPT-Image 2 dari OpenAI. Bocoran ini menggambarkan intensitas persaingan di dunia AI. Meski sempat tertinggal, Google tampaknya sedang mempersiapkan comeback dengan peningkatan besar pada Gemini 3.5 Pro. Semuanya menunggu konfirmasi resmi pada tanggal rilis yang diisukan.

marsbit1j yang lalu

Gemini 3.5 Pro Bocoran Rahasia, Depan Mengungguli Fable 5

marsbit1j yang lalu

Trading

Spot

Artikel Populer

Cara Membeli HYPE

Selamat datang di HTX.com! Kami telah membuat pembelian Hyperliquid (HYPE) menjadi mudah dan nyaman. Ikuti panduan langkah demi langkah kami untuk memulai perjalanan kripto Anda.Langkah 1: Buat Akun HTX AndaGunakan alamat email atau nomor ponsel Anda untuk mendaftar akun gratis di HTX. Rasakan perjalanan pendaftaran yang mudah dan buka semua fitur.Dapatkan Akun SayaLangkah 2: Buka Beli Kripto, lalu Pilih Metode Pembayaran AndaKartu Kredit/Debit: Gunakan Visa atau Mastercard Anda untuk membeli Hyperliquid (HYPE) secara instan.Saldo: Gunakan dana dari saldo akun HTX Anda untuk melakukan trading dengan lancar.Pihak Ketiga: Kami telah menambahkan metode pembayaran populer seperti Google Pay dan Apple Pay untuk meningkatkan kenyamanan.P2P: Lakukan trading langsung dengan pengguna lain di HTX.Over-the-Counter (OTC): Kami menawarkan layanan yang dibuat khusus dan kurs yang kompetitif bagi para trader.Langkah 3: Simpan Hyperliquid (HYPE) AndaSetelah melakukan pembelian, simpan Hyperliquid (HYPE) di akun HTX Anda. Selain itu, Anda dapat mengirimkannya ke tempat lain melalui transfer blockchain atau menggunakannya untuk memperdagangkan mata uang kripto lainnya.Langkah 4: Lakukan trading Hyperliquid (HYPE)Lakukan trading Hyperliquid (HYPE) dengan mudah di pasar spot HTX. Cukup akses akun Anda, pilih pasangan perdagangan, jalankan trading, lalu pantau secara real-time. Kami menawarkan pengalaman yang ramah pengguna baik untuk pemula maupun trader berpengalaman.

399 Total TayanganDipublikasikan pada 2024.12.11Diperbarui pada 2026.06.02

Cara Membeli HYPE

Diskusi

Selamat datang di Komunitas HTX. Di sini, Anda bisa terus mendapatkan informasi terbaru tentang perkembangan platform terkini dan mendapatkan akses ke wawasan pasar profesional. Pendapat pengguna mengenai harga HYPE (HYPE) disajikan di bawah ini.

活动图片