End of Correction or Continuation of Trend: Technical Structure Review of BTC and HYPE | Guest Analysis

Odaily星球日报Publicado a 2026-07-06Actualizado a 2026-07-06

Resumen

**Weekly Technical Analysis: BTC & HYPE Structure Review** This analysis covers the multi-timeframe technical structure for Bitcoin (BTC) and HYPE. **Bitcoin (BTC) Analysis:** BTC's correction from its May 6 high has formed a clear four-segment pattern on the daily chart. The market is currently in a (3-4) rebound phase. The key determinant for the short-term trend is the endpoint of this rebound ("Endpoint 4"): * **Path 1 (Preferred Scenario):** If the rebound surpasses the $65,700 resistance, subsequent pullbacks are less likely to break the key support at $57,820 (July 1 low). This would suggest a transition into a consolidating range, building energy for a potential bullish reversal. * **Path 2:** Failure to reach $65,700, or even $64,500, increases the probability of a breakdown below $57,820, continuing the downtrend. The 4-hour chart shows a completed five-wave decline from June 15, culminating in a momentum divergence at the low, which supported the recent bounce. **BTC Weekly Outlook & Strategy (Jul 6-12):** * **Core View:** Focus on the high point of the daily rebound from $57,820. * **Key Levels:** * Resistance: $64,500-$65,700; $67,300; $69,500-$71,000. * Support: $60,950-$62,300; $57,820; $55,000. * **Strategy:** * **Mid-term:** Maintain ~20% short position. Consider increasing shorts to <50% if price stalls in the $65,700-$67,300 zone with confirming model signals. * **Short-term:** Use 30% capital for swing trades between su...

This weekly report conducts a multi-period technical structure analysis focusing on BTC and HYPE. For Bitcoin, the analysis begins with the daily and 4-hour charts, examining the correction structure since the May 6th peak. Combined with a proprietary quantitative model, it offers predictions for key resistance and support levels this week, along with medium- and short-term trading paths. The HYPE section concentrates on the 4-hour chart trend, analyzing the structural evolution of the current rebound and providing corresponding risk control suggestions for this week's short-term operations. Details are as follows.

Last Week's Strategy Verification

  • BTC Market Prediction Verification: Last week's article explicitly stated that Bitcoin's short-term correction was nearing its end. The actual market movement largely aligned with the predicted path, validating the forward-looking judgment.
  • HYPE Market Prediction Verification: Last week's article pointed out that a short-term entry opportunity for long positions in HYPE was about to emerge. Current market movements have confirmed this judgment.

I. Multi-Period Trend Structure Analysis of Bitcoin

1. Daily Chart Trend Structure Analysis

Bitcoin Daily Candlestick Chart
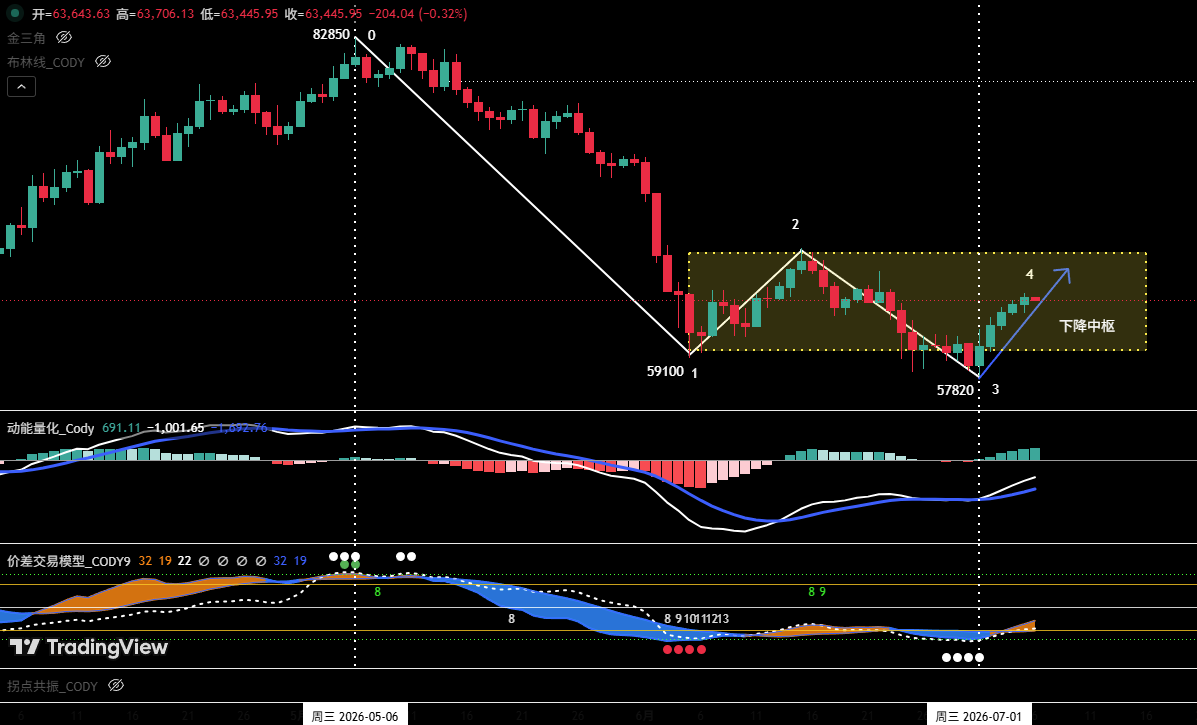
Figure 1

1. As shown in Figure 1: The correction that began from the May 6th high of $82,850 has clearly formed a four-stage correction structure on the daily chart, from "Point 0" to "Point 4".

2. The market is currently in the (3-4) rebound phase. The final position of "Point 4" will determine the short-term price direction.

  • Path One: If the rebound price at "Point 4" can break through the resistance at $65,700, the probability of a subsequent pullback directly breaking below the support at the July 1st low of $57,820 will be significantly reduced. In this scenario, the market is expected to rebound again after the correction ends, with the recent overall trend likely entering a range-bound consolidation pattern. The longer this consolidation structure persists, the more it helps to slow downward momentum and accumulate strength for a subsequent bullish counterattack.
  • Path Two: If the rebound price at "Point 4" fails to reach $65,700, or even falls below $64,500, the probability of a subsequent pullback directly breaking below $57,820 increases substantially, making it more likely for the market to continue its downward trend.

3. Analysis based on the proprietary quantitative model indicates a high probability of the market entering range-bound consolidation (i.e., Path One).

2. Hourly Chart Trend Structure Deep Dive (Using 4-hour as Analysis Period)

Bitcoin 4-hour Candlestick Chart
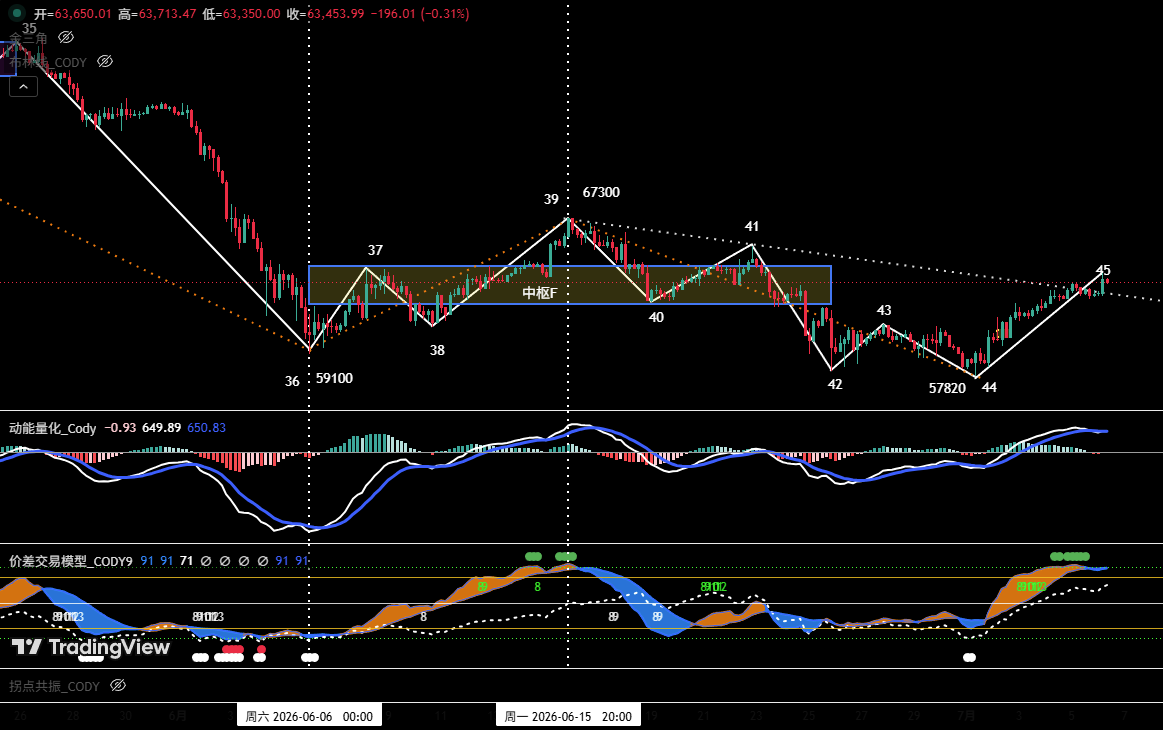
Figure 2

1. Last week's review pointed out: "If the end of Point 44 is below $58,110 accompanied by the formation of a momentum bottom divergence, the market will present a rebound opportunity." Last week's price action validated this judgment, with the actual movement highly consistent with the predicted structure.

2. On the 4-hour chart, the hourly-level decline wave that started from the June 15th high of $67,300 has completed a full five-wave structure; simultaneously, at the end of the correction, a clear momentum bottom divergence formed between low points "Point 44" and "Point 42," providing technical support for the subsequent oversold rebound.

3. The market is currently in the (44-45) rebound phase. From Figure 2, the current rebound high "Point 45" has broken above the lower boundary of the previous "Falling Channel F" (around $62,300), indicating short-term momentum is shifting in favor of bulls. If the price can further break through "Point 41" (around $65,700), it would signal an upgrade in rebound strength, significantly reducing the probability of a subsequent pullback directly breaking below "Point 44" (around $57,820).

II. Bitcoin Weekly Market Forecast and Trading Strategy (07.06~07.12)

1. BTC Weekly Market Trend Forecast

Core View: Focus on the high point of the daily oversold rebound starting from the low of $57,820.

2. Core Resistance Levels:

• First Resistance Zone: $64,500~$65,700 area (previous significant high/low points)

• Second Resistance Zone: Around $67,300 (previous significant resistance area)

• Third Resistance Zone: $69,500~$71,000 area (previous significant resistance area)

3. Core Support Levels:

• First Support Level: $60,950~$62,300 area (previous significant support)

• Second Support Level: Around $57,820 (previous significant support)

• Third Support Level: Around $55,000 (previous significant support)

4. Weekly Trading Strategy

1 Medium-Term Strategy:

Bitcoin Daily Candlestick Chart (Position Monitoring Model)
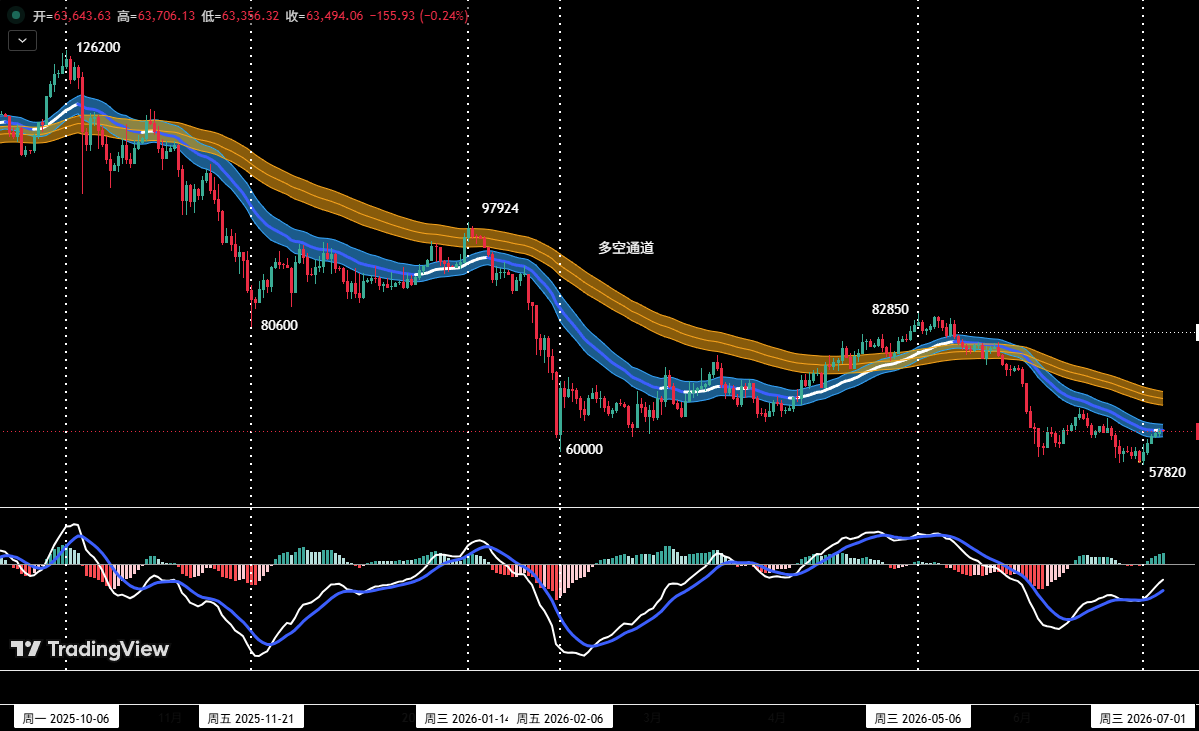
Figure 3

As shown in Figure 3, the price has effectively broken below the "Bull-Bear Channel," confirming a shift to a bear-dominated market structure.

  • Current medium-term short positions can be maintained at around 20%.
  • If the price rebounds to the $65,700~$67,300 zone and shows signs of stagnation, combined with top signals from the proprietary quantitative model, consider increasing medium-term short positions to within 50%.

2 Short-Term Strategy

Utilize 30% of capital, set stop-losses, and seek "price difference" opportunities based on support and resistance levels (using 30-minute/60-minute charts as operational cycles).

3 Short-Term Operation Contingency Plans

To dynamically respond to the market's complex evolution, two specific operational plans, A and B, are drafted in advance:

  • Plan A: Testing Short Positions in Strong Resistance Zone
  • Entry: If the price rebounds to the $65,700~$67,300 zone and meets resistance, combined with quantitative model top signals, establish short positions of around 30%.
  • Risk Control: Set initial stop-loss.
  • Exit: Gradually close positions to take profits when the price adjusts near important support levels, combined with model signals.
  • Plan B: Light Long Positions in Strong Support Zone
  • Entry: If the price breaks above the $65,700 zone, meets resistance, pulls back, and stabilizes near the strong support of $57,820, showing signs of bottoming, combined with quantitative model bottom signals, establish long positions of around 15%.
  • Risk Control: Set initial stop-loss.
  • Exit: Gradually close positions to take profits when the price rebounds near important resistance levels, combined with model signals.

III. HYPE Hourly Chart Trend Structure Analysis

HYPE 4-hour Candlestick Chart
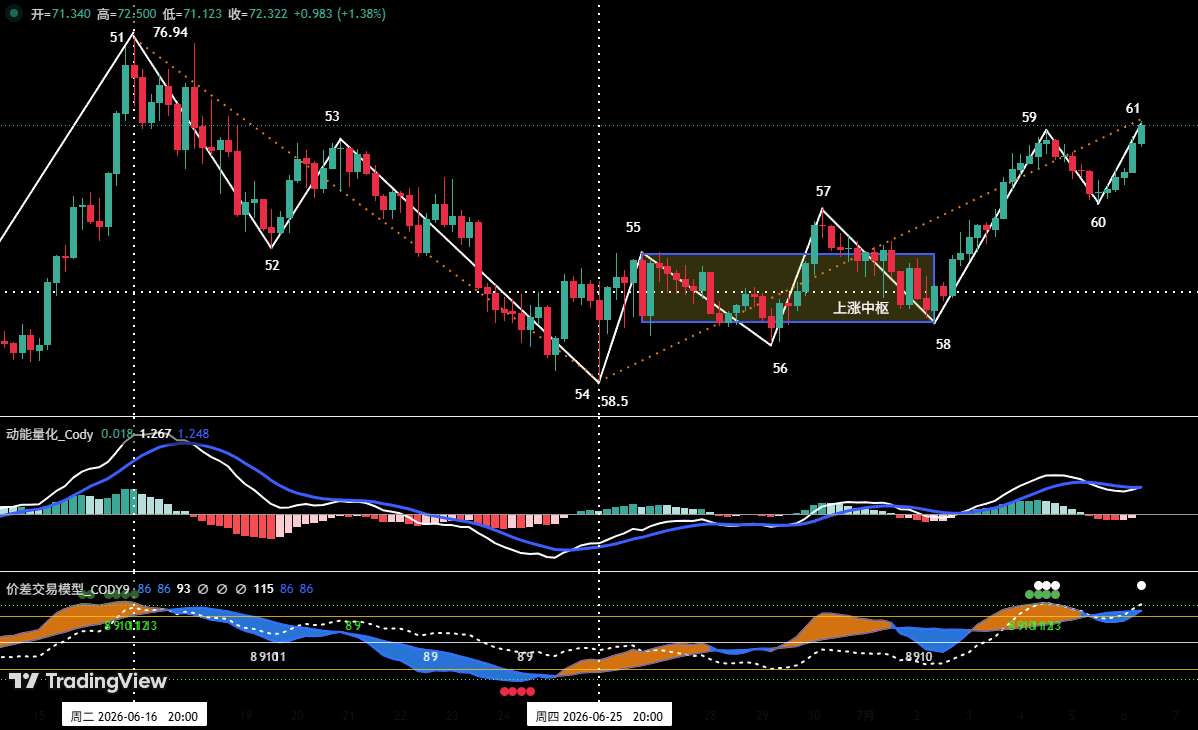
Figure 4

  1. As shown in Figure 4, last week's review stated: "If 'Point 56' is higher than 'Point 54', it forms a 'Double Bottom' pattern, potentially ending this correction, with a high probability of a rebound starting from 'Point 56'." To date, the market movement closely aligns with the analysis. In last week's actual movement, HYPE price rose from "Point 56" (around $60.55) to "Point 59" (around $72.06), with a maximum gain of approximately 19.01%.
  2. Analyzing the 4-hour chart, the rebound in HYPE starting from the June 25th low of $58.5 (Point 54) can be subdivided into a seven-wave upward structure on the 4-hour cycle: 54-55, 55-56, 56-57, 57-58, 58-59, 59-60, 60-61.
  3. The price is currently in the 60-61 upward phase, with the overall upward structure complete. However, the proprietary "Price Difference Trading Model" detected top warning signals at "Point 59" and "Point 61," and the price is approaching the historical high area near $76.94. Therefore, blind chasing of rallies is not advisable at this moment; remain vigilant against short-term correction risks.

IV. HYPE Weekly Market Forecast and Short-Term Trading Strategy

1. HYPE Weekly Market Trend Forecast

Core Resistance Levels

  • First Resistance: Around $75~$76.94
  • Second Resistance: Around $80

Core Support Levels

  • First Support: Around $68
  • Second Support: Around $65.5
  • Third Support: $60.5~$61.5 area

Core View for the Week: When the price rises to the $75~$76.94 area, observe the battle outcome between bulls and bears over this zone.

2. HYPE Weekly Short-Term Trading Strategy

This week's focus is on closing positions to lock in profits and prevent risks. If long positions were established in the support zone according to the plan, it is recommended to move the stop-loss up to around $68 to protect profits (or decide independently). If the market shows signs of adjustment, close positions promptly to take profits.

V. HYPE Short-Term Operation Review

We strictly followed the operation plan and, based on trading signals from our proprietary "Price Difference Trading Model" and "Momentum Quantitative Model," completed one short-term (long) trade last week, achieving a total trading profit of approximately: 10.23%.

Short-Term Trade 1: (See Table 1)

1. HYPE Short-Term Trade Details Summary:(Leverage*1x)
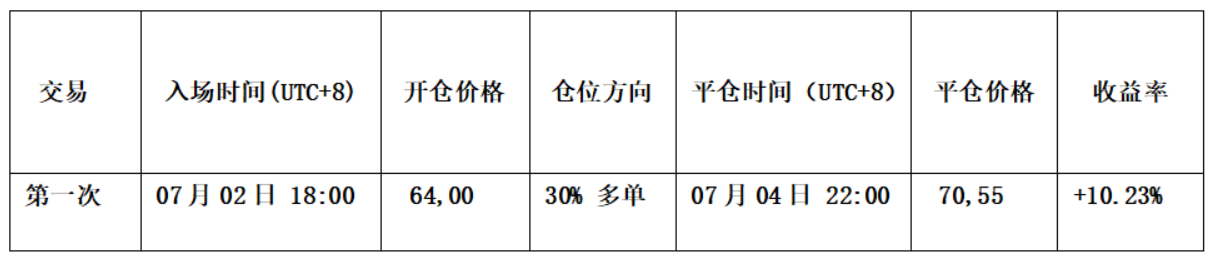
Table 1

2. Short-Term Trade Review:(See Figure 5)

• Entry Strategy:

a. Based on an accurate judgment of the overall upward price trend.

b. When the price effectively broke through the short-term downtrend line, and both the "Price Difference Trading Model" and "Momentum Quantitative Model" simultaneously issued bottom divergence resonance signals.

Therefore, we established a 30% long position at $64.

• Exit Strategy:

a. When the price rose near the $72 resistance and showed signs of stagnation, with the candlesticks forming a "Top Reversal" pattern.

b. The "Price Difference Trading Model" triggered a strong top warning signal (green dot + white dot), forming a top resonance signal with the "Momentum Quantitative Model".

Therefore, we closed all positions around $70.55.

• Summary: This trade successfully yielded a profit of approximately 10.23%.

HYPE_60-minute Candlestick Chart:(Momentum Quantitative Model + Price Difference Trading Model)
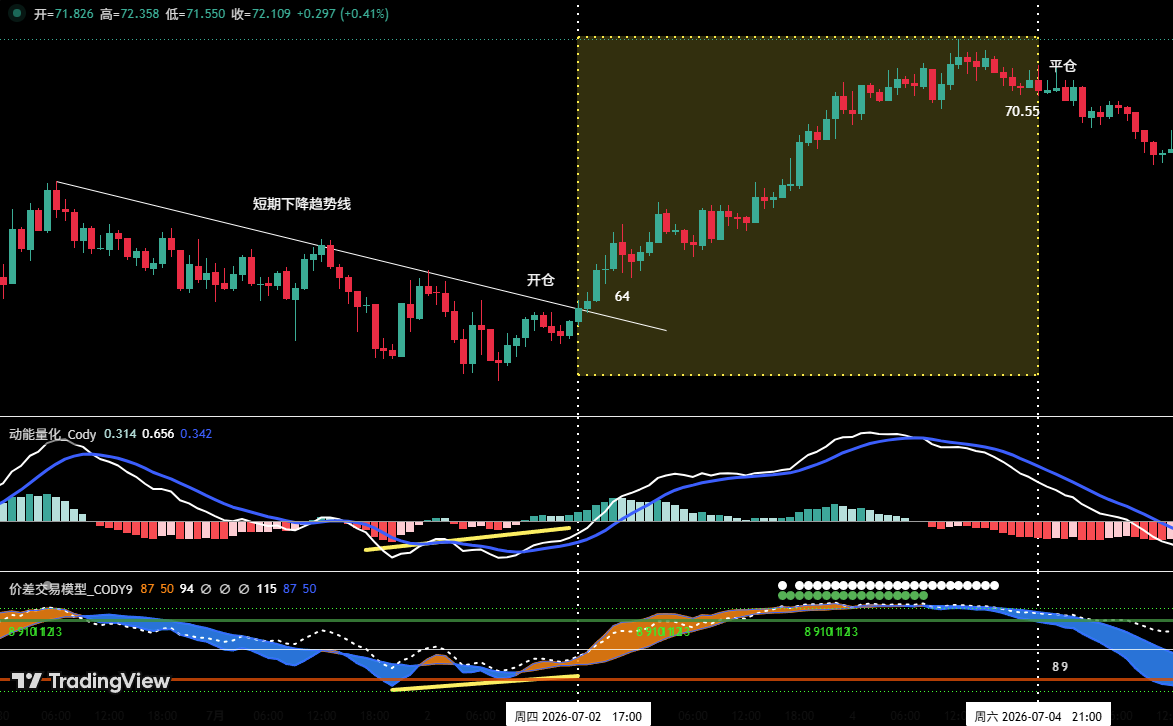
Figure 5 (Short-Term Trade Illustration)

VI. Special Notes

  1. When opening a position: Immediately set an initial stop-loss.
  2. When profit reaches 1%: Move the stop-loss to the entry price (break-even point) to ensure capital safety.
  3. When profit reaches 2%: Move the stop-loss to the 1% profit level.
  4. Continuous tracking: Thereafter, for every additional 1% profit the price makes, move the stop-loss up by 1% accordingly, dynamically protecting and locking in profits.

Financial markets change rapidly, and all market analysis and trading strategies require dynamic adjustment. All views, analytical models, and operational strategies mentioned in this article are derived from personal technical analysis, intended solely for personal trading log purposes. They do not constitute any investment advice or basis for operation. The market involves risks, investing requires caution. Please do not make decisions based solely on this content.


Criptos en tendencia

Preguntas relacionadas

QWhat are the two key technical analysis paths for Bitcoin's current rebound based on the 'Endpoint 4' price position mentioned in the article?

APath One: If the rebound at 'Endpoint 4' can break above the $65,700 resistance, a subsequent pullback is less likely to directly breach the July 1st low of $57,820. The market is then expected to move into a range-bound consolidation, which would help dissipate selling pressure and build momentum for a future upward move. Path Two: If the rebound at 'Endpoint 4' fails to reach $65,700 or even stays below $64,500, a subsequent pullback has a high probability of directly breaking below the $57,820 support, indicating a continuation of the prior downtrend. According to the author's proprietary quantitative model, the probability of Path One (range-bound consolidation) is significantly higher.

QAccording to the 4-hour chart analysis for Bitcoin, what specific condition did the author previously predict that would signal a rebound opportunity, and how did the market action last week validate it?

AThe author predicted that if 'Endpoint 44' finished below $58,110 and was accompanied by the formation of a momentum bottom divergence, the market would present a rebound opportunity. Last week's market action validated this prediction, as the actual price movement aligned closely with the forecasted structure. The low at 'Endpoint 44' (around $57,820) did fall below the specified level, and a momentum divergence was confirmed, leading to the current oversold rebound.

QWhat is the core trading strategy for HYPE this week (the week of the article's publication) according to the author's analysis?

AThe core trading strategy for HYPE this week is to prioritize locking in profits and managing risk. If long positions were already established in support zones as per previous plans, it is advised to move the stop-loss up to around $68 to protect profits (or adjust based on individual judgment). If the market shows signs of a pullback, positions should be closed promptly to realize gains. The article emphasizes caution against blindly chasing the rally near the historical high region of $76.94.

QDescribe the specific conditions (entry and exit signals) for the HYPE short-term long trade that resulted in a 10.23% profit, as detailed in the trade复盘 (review).

AEntry Conditions: 1. Based on an accurate研判 of the overall uptrend. 2. Price effectively broke through a short-term descending trendline. 3. The proprietary 'Price Difference Trading Model' and 'Momentum Quantitative Model' simultaneously issued bottom divergence共振 signals. Based on these conditions, a 30% long position was established at $64. Exit Conditions: 1. Price rose near the $72 resistance level and showed signs of stagnation, with the K线 forming a 'top分型' pattern. 2. The 'Price Difference Trading Model' triggered a strong top预警 signal (Green dot + White dot), which formed a top共振 signal with the 'Momentum Quantitative Model'. Based on these conditions, the entire position was closed around $70.55, resulting in a profit of approximately 10.23%.

QWhat is the author's recommended dynamic stop-loss management rule once a trade becomes profitable, as outlined in the '特别提示' (Special Notes) section?

AThe author's recommended dynamic stop-loss management rules are: 1. Upon opening a position: Immediately set an initial stop-loss. 2. When profit reaches 1%: Move the stop-loss to the entry price (breakeven point) to ensure capital safety. 3. When profit reaches 2%: Move the stop-loss to the 1% profit level. 4. Continuous tracking: Thereafter, for every additional 1% gain in profit, move the stop-loss up by 1% accordingly, dynamically protecting and locking in profits.

Lecturas Relacionadas

¿La fiesta de los chips se enfría? Michael Wilson de Morgan Stanley: El capital fluye hacia gigantes de la supercomputación IA como Microsoft, Amazon

Los mercados estadounidenses podrían tener dificultades para alcanzar nuevos máximos a corto plazo, según Michael Wilson de Morgan Stanley. Su informe señala que el impulso en las acciones de semiconductores se está desvaneciendo, lo que está provocando una rotación de fondos hacia los principales gigantes de la hiperescala de IA, como Microsoft, Amazon y Meta. El índice de semiconductores de Filadelfia ha caído casi un 14% desde su máximo histórico del mes pasado, lo que refleja preocupaciones sobre la presión de valoración a pesar de los fuertes avances anteriores. Wilson argumenta que estas empresas de hiperescala son atractivas dentro del ecosistema de la IA debido a sus sólidos negocios principales, y su rendimiento rezagado en comparación con los semiconductores sugiere un espacio potencial de recuperación. Esta rotación se produce en un contexto general de debilidad del mercado. Además de los gigantes de la nube, Wilson también ve oportunidades en sectores como el consumo discrecional, el transporte y la biotecnología. Esta visión es compartida por estrategas de JP Morgan, quienes anticipan que el repunte del mercado se ampliará más allá del sector tecnológico en la segunda mitad del año. Wilson mantiene su precio objetivo para el S&P 500 en 8000 puntos a fin de año, lo que implica un potencial alza de aproximadamente un 7% desde los niveles actuales, aunque advierte sobre riesgos de volatilidad a corto plazo.

链捕手Hace 29 min(s)

¿La fiesta de los chips se enfría? Michael Wilson de Morgan Stanley: El capital fluye hacia gigantes de la supercomputación IA como Microsoft, Amazon

链捕手Hace 29 min(s)

El primer filósofo de IA del mundo, en sus 9 años en Google DeepMind: Corriendo por la seguridad de la AGI

**Resumen: El filósofo dentro de Google DeepMind: 9 años abogando por la seguridad de la AGI** Iason Gabriel, filósofo político de Oxford, ha trabajado durante nueve años en Google DeepMind, siendo durante mucho tiempo el único filósofo en un laboratorio de IA de vanguardia. Su tarea era responder a preguntas fundamentales sobre la ética y la naturaleza de la IA. Gabriel desarrolló un marco de alineación que considera cuatro partes: el sistema de IA, el usuario, el desarrollador y la sociedad, reconociendo que sus intereses pueden entrar en conflicto. Este marco, adoptado por el equipo de seguridad de AGI de DeepMind, influyó directamente en las decisiones de entrenamiento de modelos como Gemini. Su investigación temprana sobre los riesgos de la antropomorfización llevó a que los modelos de lenguaje de Google se entrenaran para no fingir ser humanos. Sin embargo, el rápido despliegue tecnológico supera el ritmo de la reflexión ética. El incidente de 2025, donde un hombre estadounidense acabó con su vida tras miles de mensajes con Gemini, mostró las limitaciones de los mecanismos de seguridad. El concepto de "social reward hacking", acuñado por Gabriel, describe cómo una IA entrenada para complacer puede terminar socavando el juicio humano. El panorama actual está dominado por una carrera masiva de inversión (se estiman 670.000 millones de dólares para 2026), lo que presiona a las empresas como DeepMind a cambiar a un "modo de guerra" comercial. Este contexto hace que líneas rojas éticas anteriores, como la prohibición de aplicaciones militares, se vuelvan difíciles de mantener, como demuestra un acuerdo de 2026 entre Google y el ejército de EE.UU. Gabriel y su equipo ahora estudian el impacto sistémico de la AGI en la economía y la política, anticipando una transformación comparable a la Revolución Industrial. Lo que comenzó como una pregunta sobre la IA ("¿Qué es? ¿Es segura?") ha evolucionado hacia una cuestión filosófica más profunda sobre nosotros mismos: ante una máquina que rivaliza con capacidades humanas únicas, **¿qué somos nosotros?**

marsbitHace 1 hora(s)

El primer filósofo de IA del mundo, en sus 9 años en Google DeepMind: Corriendo por la seguridad de la AGI

marsbitHace 1 hora(s)

Gemini 3.5 Pro se filtra en secreto, superando a Fable 5 en frontend

**Gemini 3.5 Pro: Filtraciones revelan su capacidad superior en generación de código front-end, superando a Fable 5** Tras dos meses de espera, las filtraciones apuntan a que Gemini 3.5 Pro, el modelo estrella de Google, podría lanzarse el 17 de julio. Lo más destacado es su aparente salto de capacidad en la generación visual y de código para front-end, donde según pruebas de desarrolladores superaría a Fable 5. Sus mejoras clave incluyen: un mejor criterio de diseño (colores, espaciado), interfaces de usuario más limpias y con menos código redundante, una generación de SVG significativamente más precisa y capaz, y una mayor completitud en la creación de páginas con una sola instrucción. Ejemplos mostrados generan desde retratos en SVG complejos hasta una isla flotante estilo steampunk con Three.js, todo a partir de descripciones breves. Sin embargo, el modelo no sería superior en todas las áreas. En tareas de razonamiento complejo, ingeniería de software a gran escala (nivel repositorio) o ejecución de agentes de larga duración, las filtraciones indican que aún estaría por detrás de Fable 5 y GPT-5.6. La demora en su lanzamiento se atribuiría a que Google no solo amplió el modelo, sino que realizó un nuevo preentrenamiento desde una base diferente a la de Gemini 3.5 Flash. Este nuevo "cimiento" también serviría para 'Nano Banana Pro', un futuro modelo de generación de imágenes que competiría con GPT-Image 2. La posible llegada de Gemini 3.5 Pro marca un intento de Google por recuperar terreno en la intensa competencia de modelos de IA, centrando su fortaleza en un ámbito específico mientras trabaja para igualar a sus rivales en otros frentes. La comunidad espera la confirmación oficial para el 17 de julio.

marsbitHace 1 hora(s)

Gemini 3.5 Pro se filtra en secreto, superando a Fable 5 en frontend

marsbitHace 1 hora(s)

Trading

Spot

Artículos destacados

Cómo comprar HYPE

¡Bienvenido a HTX.com! Hemos hecho que comprar Hyperliquid (HYPE) sea simple y conveniente. Sigue nuestra guía paso a paso para iniciar tu viaje de criptos.Paso 1: crea tu cuenta HTXUtiliza tu correo electrónico o número de teléfono para registrarte y obtener una cuenta gratuita en HTX. Experimenta un proceso de registro sin complicaciones y desbloquea todas las funciones.Obtener mi cuentaPaso 2: ve a Comprar cripto y elige tu método de pagoTarjeta de crédito/débito: usa tu Visa o Mastercard para comprar Hyperliquid (HYPE) al instante.Saldo: utiliza fondos del saldo de tu cuenta HTX para tradear sin problemas.Terceros: hemos agregado métodos de pago populares como Google Pay y Apple Pay para mejorar la comodidad.P2P: tradear directamente con otros usuarios en HTX.Over-the-Counter (OTC): ofrecemos servicios personalizados y tipos de cambio competitivos para los traders.Paso 3: guarda tu Hyperliquid (HYPE)Después de comprar tu Hyperliquid (HYPE), guárdalo en tu cuenta HTX. Alternativamente, puedes enviarlo a otro lugar mediante transferencia blockchain o utilizarlo para tradear otras criptomonedas.Paso 4: tradear Hyperliquid (HYPE)Tradear fácilmente con Hyperliquid (HYPE) en HTX's mercado spot. Simplemente accede a tu cuenta, selecciona tu par de trading, ejecuta tus trades y monitorea en tiempo real. Ofrecemos una experiencia fácil de usar tanto para principiantes como para traders experimentados.

413 Vistas totalesPublicado en 2024.12.11Actualizado en 2026.06.02

Cómo comprar HYPE

Discusiones

Bienvenido a la comunidad de HTX. Aquí puedes mantenerte informado sobre los últimos desarrollos de la plataforma y acceder a análisis profesionales del mercado. A continuación se presentan las opiniones de los usuarios sobre el precio de HYPE (HYPE).

活动图片