# Bottom Related Articles

HTX News Center provides the latest articles and in-depth analysis on "Bottom", covering market trends, project updates, tech developments, and regulatory policies in the crypto industry.

Five Historic Indicators Simultaneously Flash Signals: Bitcoin Bear Market Bottoms Out

Title: "Five Major Historical Indicators Simultaneously Flash, Bitcoin Bear Market Hits Bottom" Bitcoin is currently down 50% from its all-time high, with the bear market persisting over 40 weeks. A set of long-term cyclical indicators suggests the market may be at or nearing a price and time-cycle low point. Key Indicators: 1. Nasdaq/BTC Relative Strength: The 14-week moving average of the Nasdaq 100/BTC ratio's RSI has reached a historically unprecedented overbought level of 72.6, indicating Bitcoin is extremely oversold relative to equities. Historically, such extremes have preceded major cycle lows and strong outperformance by Bitcoin over the next 1-3 years. 2. Long-Term Expected Returns: Past instances of extreme Nasdaq/BTC RSI readings have been followed by asymmetric positive returns for Bitcoin over a 1-3 year horizon, though the magnitude of gains has diminished each cycle. 3. Gold/BTC Relative Strength: A similar RSI indicator for the Gold/BTC ratio also hit a record high in February 2026, another signal aligning with historical cycle lows for Bitcoin. 4. Bitcoin Realized Price: The on-chain realized price (average cost basis) is currently $53,000, 18% above the spot price. Historically, Bitcoin's spot price has spent only 12% of its time below this level, and every past bear market bottom has occurred below the realized price. 5. Cycle Clock: Previous cycles saw price lows form around 60 weeks after the all-time high. The current cycle is at week 40. If this pattern holds, a low point could form around late November 2026. Conclusion: The convergence of these rare, extreme signals points to Bitcoin being at or very near a long-term cyclical bottom, likely forming before the end of 2026. This period may present a highly attractive opportunity for long-term accumulation, with an asymmetric return profile favoring significant upside over the next 1-3 years, despite noted risks like diminishing marginal returns, small sample size, and potential structural market changes.

marsbit07/24 07:13

Five Historic Indicators Simultaneously Flash Signals: Bitcoin Bear Market Bottoms Out

marsbit07/24 07:13

Bitcoin Shifts to Building a Bottom, with Selling Pressure from Long-Term Holders Significantly Easing

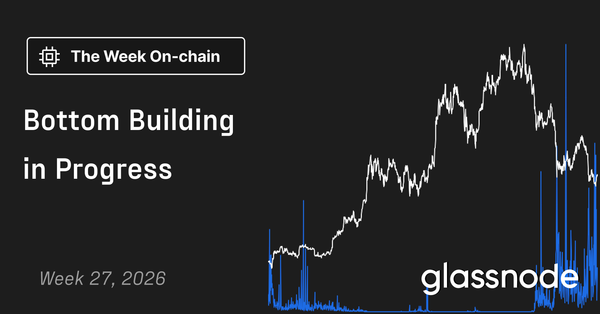
Bitcoin is transitioning into a basing phase, with significant selling pressure from long-term holders showing signs of easing. The market is testing overhead resistance, with Bitcoin responding more positively to favorable macro data like soft inflation reports than major equity indices. Its correlation with stocks is weakening while its inverse relationship with the US dollar strengthens, indicating a shift in primary drivers towards liquidity factors rather than risk sentiment. On-chain analysis reveals that long-term holder profit-taking has largely dried up, and the wave of capitulation selling from this cohort has peaked and begun to recede. Buyers successfully absorbed selling pressure at the June lows. Bitcoin currently trades between the network's average realized price (a support floor) and the short-term holder cost basis near $69k, which will be a key resistance level. A breakout above this level is needed to signal a more sustained recovery. In derivatives markets, traders are unwinding bearish bets, with put/call ratios falling and crash protection premiums declining. However, this futures and options positioning adjustment has not been accompanied by significant spot buying. US spot ETF outflows have slowed but not reversed. Volatility has compressed to low levels. In summary, the foundations for a bottom are forming: long-term holder selling is subsiding, demand absorbed the recent low, and the market is reacting to positive catalysts. However, confirmation is still lacking, requiring a spot-driven breakout and hold above the short-term holder cost basis around $69k.

Foresight News07/16 08:32

Bitcoin Shifts to Building a Bottom, with Selling Pressure from Long-Term Holders Significantly Easing

Foresight News07/16 08:32

The Signal That Has Appeared Before Every BTC Bottom Since 2014, It Was Close This Time

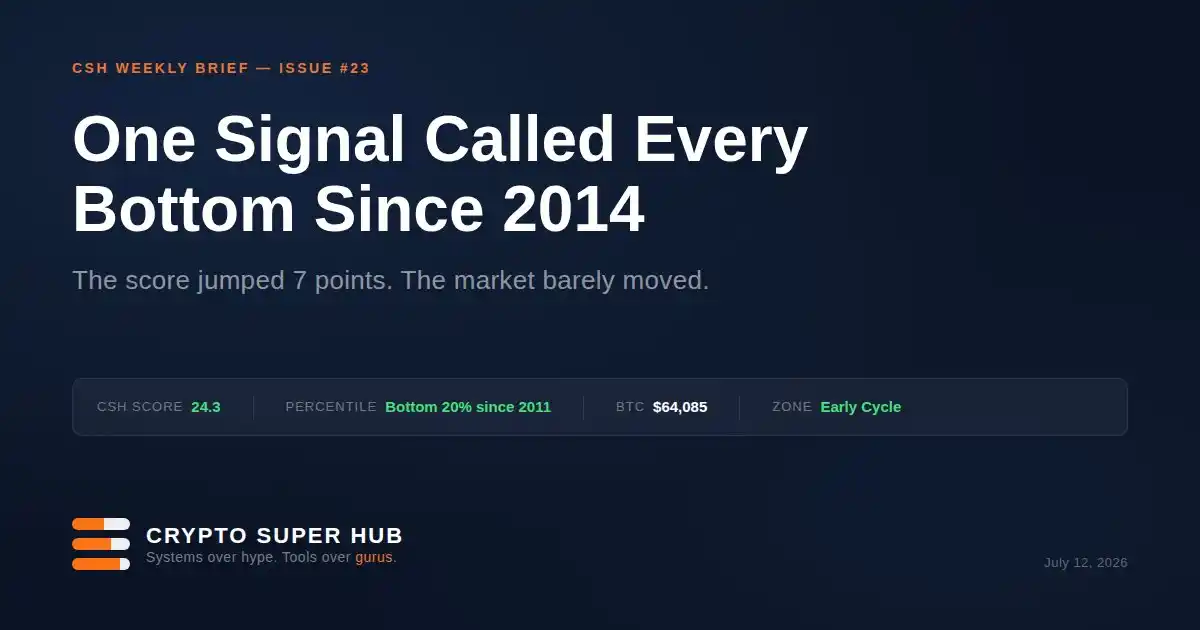
A valuation model tracking Bitcoin for 12 years has been updated. The new model shows a current score of 24.3, placing BTC in the historical bottom 20% range. However, analysis reveals that since 2014, every Bitcoin bear market bottom has seen this score drop *below 20* for a sustained period before turning around. The current cycle's low so far was 21.5 on July 1st. The author explains the model was rebuilt to address a flaw in its historical baseline, making it a more accurate "map" of current value. Two interpretations are offered: either the historically definitive washout has not yet occurred, or this cycle's bottom will be shallower, as each cycle has been less volatile than the last. The author's action plan involves automated buying triggered at specific score levels. A purchase was made at the cycle's cheapest reading (21.5), with more capital allocated for a potential drop below 20. The strategy emphasizes following a pre-written plan over emotion. Additional market context is provided: Bitcoin reclaimed its 200-week moving average, the BTC/Gold ratio is at a 3-year low showing capital preference for gold, and Bitcoin dominance remains high at 59%, indicating no "altcoin season." The summary concludes by noting the model's inconvenient implication—the market looks less like a bottom now—and poses a question to readers: at what score would they deploy their final capital?

marsbit07/13 04:38

The Signal That Has Appeared Before Every BTC Bottom Since 2014, It Was Close This Time

marsbit07/13 04:38

Crypto Welcomes the 'July Rebound'? On-Chain Bottom Signals Align, Reversal Still Requires Breakthrough Above $70k

The cryptocurrency market is showing signs of a potential "July rebound," with Bitcoin leading a recovery above $63,000 and total market cap rising. This bounce is attributed to improved macro expectations (weaker US jobs data easing Fed hike fears), a short squeeze in derivatives, and signs of whale accumulation. Key on-chain metrics signal a potential bottom, including the Sharpe Ratio hitting extreme lows, the AHR999 index nearing historic buy zones, and miner pressure reaching significant levels. However, analysts caution this is likely a corrective rebound rather than a confirmed trend reversal. Persistent challenges include weak spot demand, negative Coinbase Premium indicating institutional caution, and ongoing selling pressure in the altcoin market. Market sentiment remains in "extreme fear" territory, and the AVIV ratio suggests the average active Bitcoin investor is still at a loss. For a true bullish reversal, Bitcoin needs to convincingly break above the key $70,000 level (aligned with the Short-Term Holder Realized Price). The path to a new parabolic bull market is seen as dependent on attracting substantially more capital, as capital efficiency has declined. While prices may be approaching a cyclical bottom zone (with estimates between $37k-$60k), the market requires more sustained positive signals for a definitive uptrend.

marsbit07/06 10:04

Crypto Welcomes the 'July Rebound'? On-Chain Bottom Signals Align, Reversal Still Requires Breakthrough Above $70k

marsbit07/06 10:04

Bitwise CIO: STRC Plunge is a Bottom Signal, Bull Market to Begin in Autumn

Matt Hougan, Chief Investment Officer at Bitwise, explains the recent Bitcoin price drop below $60,000 and its connection to the steep decline in MicroStrategy's STRC (Strategy's Perpetual Preferred Stock). STRC, designed as a high-yield, stable-price instrument, fell from its $100 target to $75 due to market fears over MicroStrategy's ability to sustain its dividend amid Bitcoin's price weakness. Hougan clarifies that while MicroStrategy's overall financial position remains strong, with significant Bitcoin holdings and cash, the core market anxiety centered on the optional nature of the dividend payments. In response, MicroStrategy announced a new operational framework: it will sell some Bitcoin as needed to fund dividends, will no longer actively defend the $100 share price through dividend hikes, and may repurchase STRC on the open market. This shift marks a change in MicroStrategy's role from a consistent, one-way buyer of Bitcoin to a more dynamic participant that may both buy and sell. According to Hougan, the STRC volatility is a classic late-cycle event, signaling the painful but necessary process of flushing out excessive leverage from the market. He draws parallels to the unwinding of the GBTC premium in the previous cycle. He identifies key potential bottoming signals: MSTR trading at a discount to its net asset value (NAV), extreme readings on the Crypto Fear & Greed Index, and persistently negative Bitcoin funding rates. Hougan concludes that while the exact timing of the market bottom is unpredictable, the current deleveraging phase suggests it is near. He expresses confidence that a new bull market will begin in the fall of this year, with the next major wave of buying expected to come from institutional investors like banks, asset managers, and pension funds.

Foresight News07/02 02:43

Bitwise CIO: STRC Plunge is a Bottom Signal, Bull Market to Begin in Autumn

Foresight News07/02 02:43

BTC Hits Its Lowest Point Since 2024, But Is It Still Not the Right Time to Buy the Dip?

**Summary:** Bitcoin (BTC) has plunged to new lows in 2024, dropping over 50% from its all-time high to around $57,800, while Ethereum and Solana also show significant weakness. The market sentiment is at "extreme fear." The primary headwinds are identified as massive and sustained net outflows from US spot Bitcoin ETFs since May 2026, creating significant selling pressure, and the evaporation of expectations for a US Federal Reserve interest rate cut in 2026, which makes holding cash and bonds more attractive than risk assets like crypto. Analysts are actively debating the potential bottom. Key predictions include: * **glassnode's Rafael:** Suggests a bottom between $46,000 and $54,000, based on on-chain metrics like Realized Price and CVDD. He notes that institutional demand (via ETFs) is currently a net seller, not a buyer. * **BIT Analysis:** Argues the bear market is in its final stage, with a potential bottoming zone between $50,000 and $55,000, possibly aligning with the 2026 FIFA World Cup period (June-July). * **Wintermute:** Believes the market is in the late stages of a bear market but cautions the true bottom may not arrive until September-October 2026, contingent on renewed capital inflows. * **Liquid Capital's JackYi:** Posits that July-August 2026 could be the final capitulation and the best accumulation window, with potential bottom prices ranging from $51,000 to $43,000. * **Jiang Zhuo'er (BTC.TOP):** Predicts a bottom between $42,000 and $44,000 in October-December 2026, based on cycle analysis and MSTR's mNAV metric. * **Prediction Markets:** Polymarket data indicates a 79% chance BTC falls below $55,000 in 2026, a 65% chance below $50,000, and a 30% chance below $40,000. The consensus is that while bearish conditions are severe, the exact timing and price level of the ultimate bottom remain uncertain and depend on factors like ETF flows, macroeconomic policy, and potential market shocks.

Foresight News07/01 06:24

BTC Hits Its Lowest Point Since 2024, But Is It Still Not the Right Time to Buy the Dip?

Foresight News07/01 06:24

活动图片