The Signal That Has Appeared Before Every BTC Bottom Since 2014, It Was Close This Time

marsbitPublished on 2026-07-13Last updated on 2026-07-13

Abstract

A valuation model tracking Bitcoin for 12 years has been updated. The new model shows a current score of 24.3, placing BTC in the historical bottom 20% range. However, analysis reveals that since 2014, every Bitcoin bear market bottom has seen this score drop *below 20* for a sustained period before turning around. The current cycle's low so far was 21.5 on July 1st. The author explains the model was rebuilt to address a flaw in its historical baseline, making it a more accurate "map" of current value. Two interpretations are offered: either the historically definitive washout has not yet occurred, or this cycle's bottom will be shallower, as each cycle has been less volatile than the last. The author's action plan involves automated buying triggered at specific score levels. A purchase was made at the cycle's cheapest reading (21.5), with more capital allocated for a potential drop below 20. The strategy emphasizes following a pre-written plan over emotion. Additional market context is provided: Bitcoin reclaimed its 200-week moving average, the BTC/Gold ratio is at a 3-year low showing capital preference for gold, and Bitcoin dominance remains high at 59%, indicating no "altcoin season." The summary concludes by noting the model's inconvenient implication—the market looks less like a bottom now—and poses a question to readers: at what score would they deploy their final capital?

Author: Jake Pahor

Compilation: Shenchao TechFlow

Shenchao Guide: A valuation model that has tracked Bitcoin's 12-year history has just been rebuilt. The new model shows a current reading of 24.3, in the bottom 20% historical range—but at the true bottom of every previous bear market, this number has fallen below 20. Either this time is different, or the real washout hasn't come yet. For those wanting to buy the dip, it's an uncomfortable but worthwhile signal to watch.

Two weeks ago I told you Bitcoin was in the bottom 3% range of its entire history. Today that score reads 24.3, bottom 20%.

The market hasn't moved 17 points. The model changed. Rather than quietly updating a number and hoping no one checks, I'd rather explain in plain English exactly what happened.

Because here's the thing: if you're using a score to make real-money decisions, you deserve to know when and why it changes. That's the difference between a system and a pitch.

Why the Score Moved But the Market Didn't

Our old model had a flaw we've known about. It compared today's price to Bitcoin's entire history, including the early years when BTC could swing thousands of percent in months. That volatility will never repeat. Because it was baked into the baseline, the score would read low and drift, and could never again reach the top of its own range. Useful, but drifting.

The rebuilt model (v4.1, now live) measures where price sits within a fair value band that projects forward with the asset, instead of being anchored to 2012. Same 0 to 100 scale. Same job. Better ruler. We validated it against 21 hand-labeled cycle tops and bottoms in Bitcoin's history, and it's about 35% more accurate at identifying those points than the old model. I'm not dumping the full methodology in a newsletter, but we've published the plain-English version on the site because a score you can't interrogate is just a feeling with numbers attached.

So what does the new ruler actually say?

This is where it gets interesting, and honestly a bit uncomfortable.

Since 2014, every Bitcoin bear market has ended the same way on this model: the score spends real time below 20 before the turn. The 2015 bottom printed around 7. December 2018 printed around 15. At the November 2022 price low of $15,742, the score read 18, and spent weeks below 20 around that time.
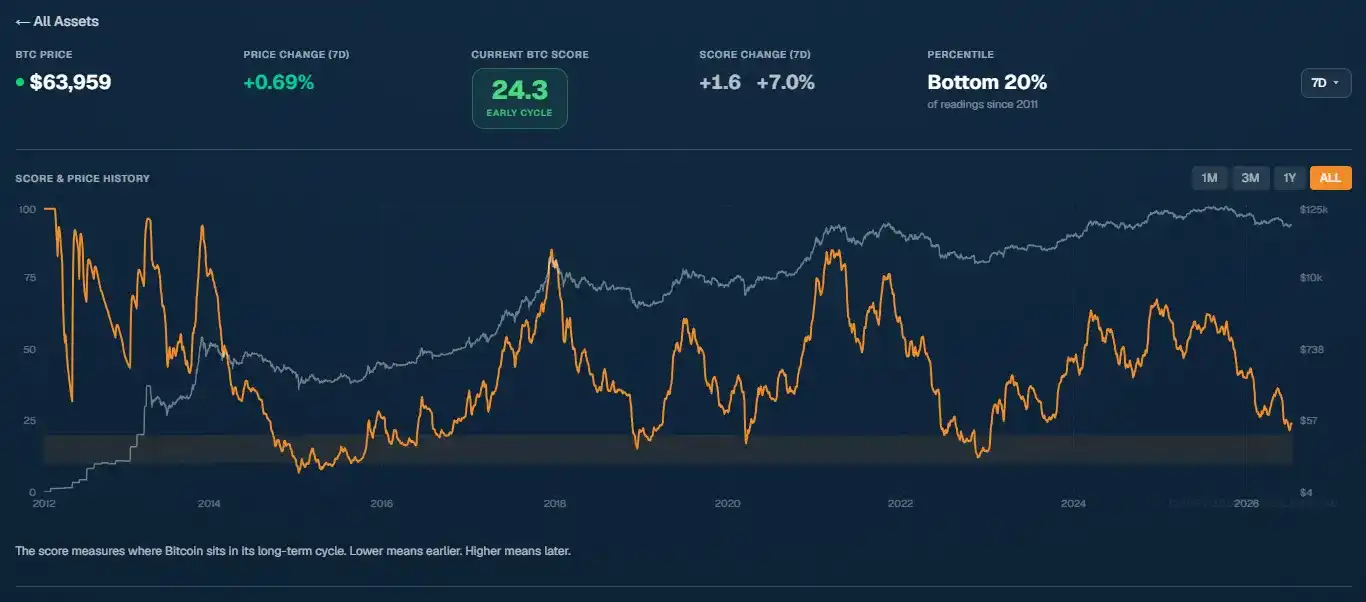
The lowest print of this cycle so far: 21.5, July 1st, with BTC at $58,550.

Close. But not there.

Take from that what you will, but here is my honest take: By the standard of every previous cycle, we have not yet seen the kind of washout that has historically marked the end. That is one possibility. The other possibility is that this cycle stays shallower, just as each prior cycle has been shallower than the last. Our October 2025 top printed a score of 59, well short of the 74+ readings of past manias. A compressed top could mean a compressed bottom. The past doesn't predict the future, and I won't pretend the model is a crystal ball. It's a map of where we are, not a prediction of where we're going.

What I actually did, because a score without a decision is just decoration:

I bought on July 1st. Not because I called a bottom (I didn't know it was a bottom, no one does). But because my plan had a trigger set at that price, and the trigger fired. It felt like a completely ordinary day. The score printed the cheapest reading of the entire cycle, and my phone didn't ring once. That's what real accumulation zones feel like: boring, quiet, slightly nauseating.

I still have a large chunk of capital left. Its deployment schedule is written in my plan, tied to score levels, not to how I feel on a given day. If the score prints below 20, my plan buys more aggressively. If it doesn't and the market turns anyway, my regular DCA already has me positioned. In either case, I don't need to be right. I just need to follow what I wrote when I was calm.

The rebuilt score is live in the app now, along with historical data, so you can check every claim I just made against the charts yourself.

CSH Risk Dashboard
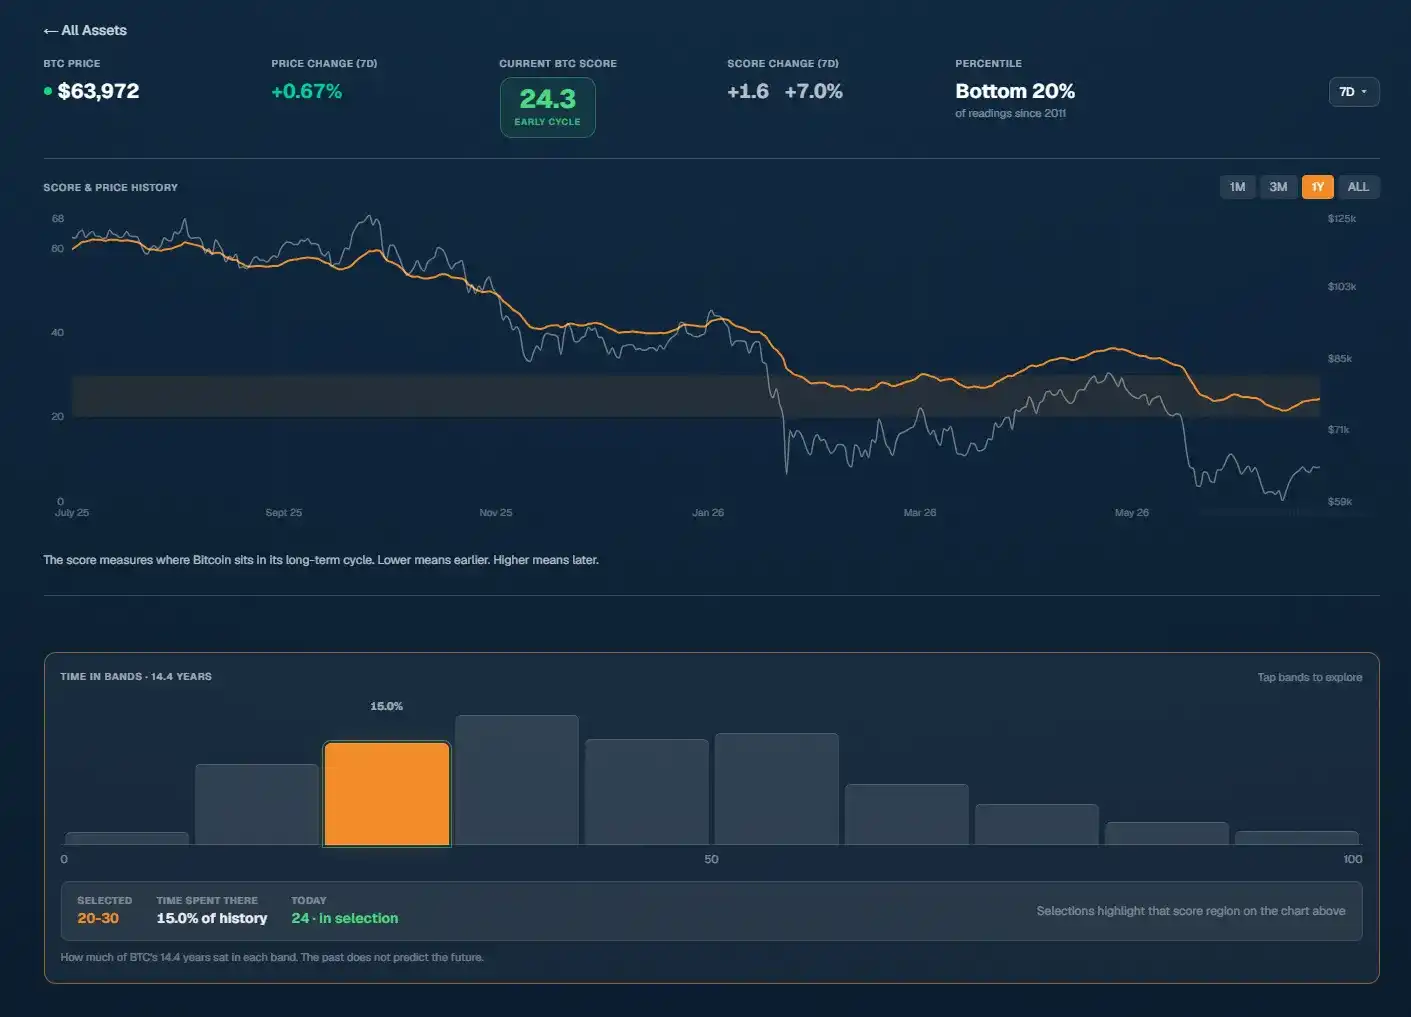
The numbers as of tonight:

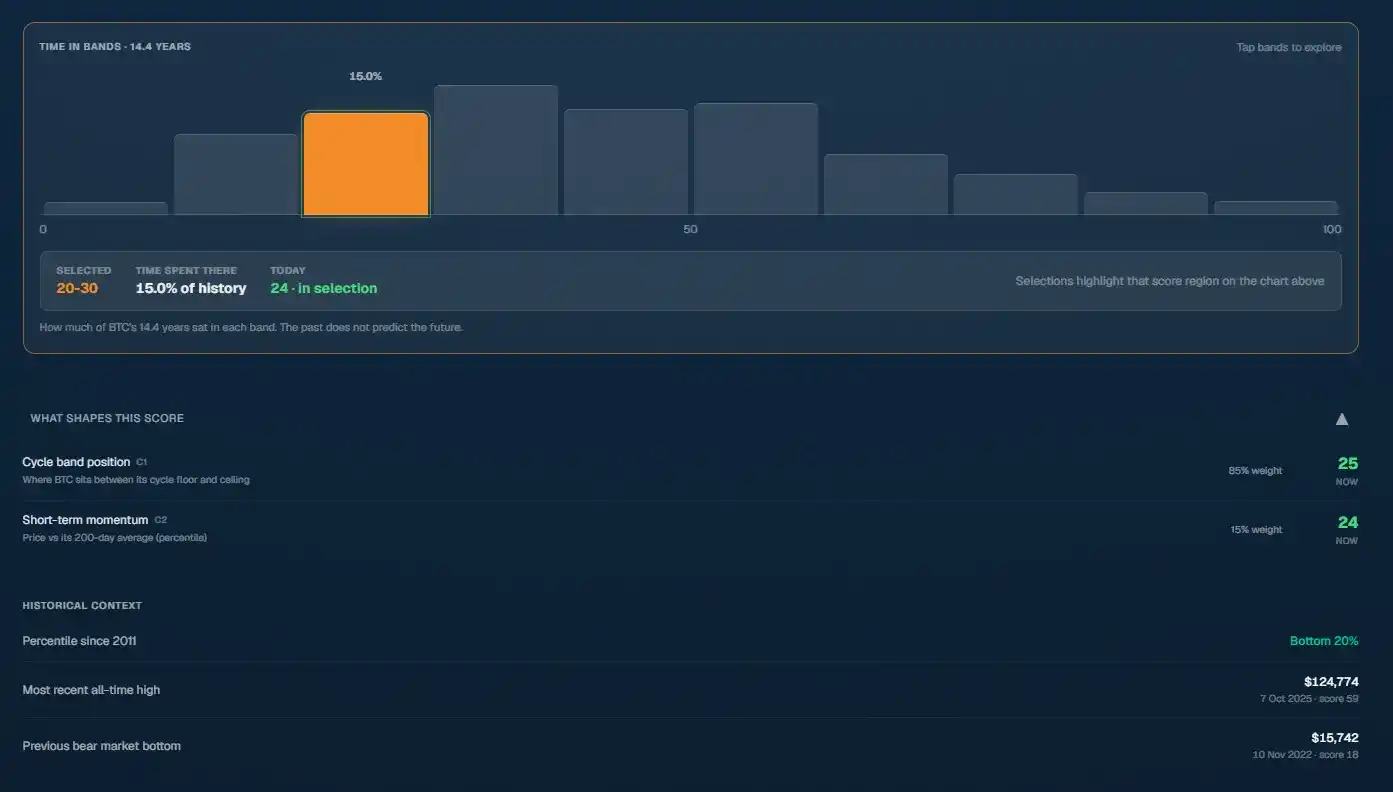
BTC $64,085, up 0.96% this week. The score sits at 24.3, up 1.6 points (7%) over the same period, in the bottom 20% of all readings since 2011. We're in the 20-30 band, where BTC has spent about 15% of its 14.4-year history.

To callback, because the system keeps receipts: The July 1st low at $58,550 printed the cheapest score of this cycle, 21.5. Since then, price is up about 9.5%, and the score has risen with it. None of this changes the plan. The next tier has its trigger, and the trigger hasn't moved.

BTC reclaimed its 200-week moving average this week, around $62.9k, after losing it on July 1st. So what: That line is the life/death line for long-term holders, and the past two bear markets ground below it for months. A quick reclaim is constructive. My plan doesn't trade moving averages, but this aligns with the shift the score's momentum reading captured this week.

One bitcoin now buys about 15.5 ounces of gold, the lowest in nearly three years. Gold has corrected hard, from near-record highs of ~$5,100 in January to around $4,120, but BTC has still lost ground relative to it: This ratio has roughly halved since the October top, when one coin bought nearly 30 ounces. So what: Hard money capital went to gold first this cycle. When the crypto cycle turns, this ratio will snap back fast. My plan doesn't trade this ratio, but there's no clearer picture of how unloved BTC is right now.

Bitcoin dominance at 59%. So what: Altseason isn't even on the radar. The playbook's bear market rule: Altcoins bleed longer and harder. Plan accumulates the index leader first, asks altcoin questions much later in the cycle.

Jake's Workbench: Launch Week

The biggest build week we've ever had. Tom is a machine:

CSH Score v4.1 is live for BTC, with ETH, SOL, and XRP to follow. The website ate a full UI overhaul, charts and mobile included. And we ran a full security audit ahead of something we've been working toward all year: The paid Founding Plan.
To be direct about that last thing: There will be exactly 100 Founding seats, discount priced and permanently locked. That cap is real, not marketing theater, so when it's full, it's full. If you want first look, create a free account, and you'll hear it from me before anyone else. For the price of a coffee or two a month, you get the score, the plan builder, and a dashboard that keeps you honest on the days you don't want to be.

An apology here: If you were using a live plan with triggers on the score this week, the model change moved your readings. I know that's annoying. Short-term pain, long-term sharper tool. Full changelog on the site.

Looking Ahead to Next Week

I'm watching three things, none requiring prediction:

The 200-week MA around $62.9K. We reclaimed it this week after losing it July 1st. Holding above it is the first good sign; losing it again puts lower support back in play.

The path of the score to 20. Every prior bear market printed below it before turning, but not this one yet. If it gets there, my plan buys harder. If it doesn't, DCA already has me positioned. Watch this number with me in the app.

The gold rotation. If the BTC/gold ratio stops declining, that's the earliest signal hard money capital is starting to look our way.

We rebuilt our own model 10 to 12 weeks before asking anyone to pay for it, and the new version makes today's market look less like a bottom, not more. That was the most commercially inconvenient possible result, and we shipped it anyway. Systems over hype was never meant to be a slogan.

My question for you this week, and I'll feature the best answers next issue: What score level would get you to deploy your final third of dry powder? Reply with a number. Mine is already written in my plan.

If this issue was useful, give it a heart. Substack decides who else to show it to based on that.

Talk next Sunday,

Thanks for reading. Share this with someone who would find it valuable.

Trending Cryptos

Related Questions

QAccording to the article, what is the key historical signal for Bitcoin bottoming out since 2014 that has not yet been fully met in the current cycle?

ASince 2014, every Bitcoin bear market has ended with the CSH Score valuation model reading remaining below 20 for a substantial period before the turn. The current cycle's lowest reading so far is 21.5, which is close but has not yet fallen below the 20 threshold.

QWhat major change was made to the CSH Score model (v4.1), and what was its purpose?

AThe model was rebuilt to measure the price's position within a projected fair value range that moves forward with the asset, rather than comparing today's price against Bitcoin's entire volatile history. This corrects a flaw in the old model where early extreme volatility made the score read lower and drift, providing a better and more accurate measuring tool.

QWhat action did the author take on July 1st, and why?

AThe author bought Bitcoin on July 1st when the price was $58,550. This was not an attempt to call the bottom, but because a pre-set trigger in his investment plan was activated at that price level, which coincided with the cycle's cheapest CSH Score reading of 21.5 at that time.

QWhat does the current Bitcoin-to-Gold ratio indicate about market sentiment towards BTC?

AThe current ratio of approximately 15.5 ounces of gold per Bitcoin is near a three-year low, having halved since the peak in October. This indicates that hard-money capital favored gold this cycle and that Bitcoin is currently deeply out of favor relative to gold.

QWhat is the author's stated investment strategy regarding potential further downside and his remaining capital?

AThe author has a significant portion of capital remaining. His deployment schedule is tied to specific CSH Score levels outlined in his plan, not daily emotions. If the score prints below 20, his plan dictates more aggressive buying. If it doesn't fall below 20 but the market turns anyway, his regular Dollar-Cost Averaging (DCA) already gives him exposure. The strategy is to follow the pre-written plan.

Related Reads

Qingyan Jingzhun Raises Hundreds of Millions in Funding, with Investment from National Equipment Manufacturing Giants

Qingyan Precision, a provider of physical AI infrastructure, has secured billions of RMB in Series B financing. The investment round, led by prominent automotive industry funds and notably featuring the state-owned China National Machinery Industry Corp. (Sinomach) fund, underscores a strategic shift in the capital market towards companies with proven industrial application capabilities. The company positions itself as the "engineering foundation for physical AI," specializing in enabling embodied intelligence (like humanoid robots) to operate in complex, real-world industrial environments. Its core offering is the "TsingLoop" multi-modal data engineering pipeline, which captures and standardizes data from physical workspaces (like visual, force, and process parameters) to create reusable data assets. This system supports a "Robot-in-the-Loop" testing framework that validates robotic performance in digital twin simulations and real-world conditions before deployment. Qingyan Precision leverages over eight years of experience and a network of 2000+ industrial sensor nodes across sectors like automotive and mining. This provides a crucial "training ground" for embodied AI models. The founding team combines academic pedigree from Tsinghua University and Stanford with deep industry experience from leading robotics firms. The company's vision is to build "one foundation, one brain, and hundreds of vertical applications," using its data platform and industrial world model to deploy scalable physical intelligence across various industrial tasks.

marsbit1h ago

Qingyan Jingzhun Raises Hundreds of Millions in Funding, with Investment from National Equipment Manufacturing Giants

marsbit1h ago

Making a Fortune of $10.32 Million: The World Cup Money-Printing Tactic of a Polymarket Whale

**Earning $10.32 Million: A Polymarket Whale's World Cup Profit Strategy** While teams battle for the World Cup trophy, a hidden whale nicknamed "swisstony" has been quietly making a fortune on the prediction market Polymarket. This account, created around July 2025, boasts total profits of $18.62 million, with $10.33 million earned in the past month alone. With a 52.9% win rate, it has placed over 139,600 predictions, averaging about 380 trades per day—indicating it is likely a high-frequency quantitative bot. The account's signature "trash panda" aptly describes its strategy: sifting through vast market data and tiny price discrepancies to build wealth. Its current holdings are heavily concentrated on the France vs. Spain semi-final, including a roughly $160,000 bet against France. Analysis shows two core tactics driving its success: 1. **High-Volume "Anti-Favorite" Bets:** Placing large wagers (often $400k-$1M) against overvalued favorites like Germany or England, buying "No" shares at favorable prices when market-implied win probability is 46%-64%. It has recorded over 17 individual profits exceeding $1 million using this method. 2. **"Lottery-Ticket" Bets on Extreme Long Shots:** Allocating small amounts (thousands of dollars) to buy shares priced as low as 0.2¢-1.2¢ on outcomes deemed nearly impossible. While most of these bets lose, the occasional win—like those with payouts over 100x—generates significant profits (over $100,000 per hit) that boost overall returns without risking much capital. This dual approach combines consistent, large-scale profit from correcting major market mispricings with opportunistic, high-reward bets on extreme underdogs. The account exemplifies how systematic, high-frequency execution can amplify a small statistical edge into millions in profits on prediction markets.

Foresight News1h ago

Making a Fortune of $10.32 Million: The World Cup Money-Printing Tactic of a Polymarket Whale

Foresight News1h ago

AI Token Factory Explosion: Tsinghua University Team Raises 10 Billion in Half a Year

Qijing Tech, a company founded by a Tsinghua University team of faculty and students, has rapidly become a significant player in China's AI infrastructure sector, focusing on high-quality AI token production. Over the past six months, the startup has secured over 1 billion RMB in funding. The company specializes in AI inference—the efficient use of AI models—positioning itself as a "high-quality AI token factory." Unlike many competitors initially focused on model training, Qijing Tech believes inference is where real economic value is generated. Its core technology optimizes the entire AI token production chain through innovations like "full-system heterogeneous collaboration," aiming for stable, efficient, and low-cost output suitable for enterprise use. This strategy has attracted significant investor interest. Major funding rounds have been led by institutions such as Henan Investment Group Huirong Fund, with continued backing from existing investors. The company's "less models, deeper optimization" approach, concentrating resources on key models and high-value scenarios, is resonating in a market where a few top models dominate token usage. The results are promising. Since early 2026, Qijing Tech reports a threefold increase in token production efficiency per unit of computing power and a thirtyfold increase in total high-quality token output. Monthly revenue for June 2026 alone surpassed its entire 2025 revenue. Operating on a "Token as a Service" (TaaS) model, Qijing Tech engages in both direct token sales and collaborative operations, helping partners like state-owned enterprises transition from traditional computing power leasing to high-value token production. As AI token usage in China surges, Qijing Tech aims to be a key enabler in the emerging AI token economy, building the essential infrastructure for the AI era.

marsbit1h ago

AI Token Factory Explosion: Tsinghua University Team Raises 10 Billion in Half a Year

marsbit1h ago

Financing Weekly Report | SBI Makes Consecutive Moves, Bets $125 Million on Gauntlet; Crypto Capital Continues to Flow to Trading and Infrastructure

Weekly crypto financing highlights show capital continues to flow into trading, compliance, and digital asset infrastructure, with traditional financial institutions like Japan's SBI Holdings playing a larger role. SBI made two major investments: a $125M exclusive investment in DeFi risk management and asset allocation platform Gauntlet, and leading a $76M Series C round for crypto exchange EDX Markets. Other notable crypto deals included: QIZ Security ($17M seed) for post-quantum cryptography management; TrueDAO ($10M strategic) for AI-powered DeFi infrastructure; KOR Protocol ($7.5M Series A) for an on-chain creative asset clearing platform; Tether's $20M strategic investment in Brazil's Mercado Bitcoin; and M1X Global ($5.5M seed) for sovereign financial infrastructure. The AI sector saw larger individual rounds. Prime Intellect raised $130M Series A for its decentralized AI protocol stack. AI legal services firm Norm raised $120M, reaching a $1.2B valuation. Voice AI company Gradium's total funding surpassed $100M. The report also notes a shift towards business models focused on specific enterprise-level AI infrastructure and application scenarios. Overall, the crypto primary market remains subdued, with nine deals totaling over $261M last week, centered on centralized finance, DeFi, and infrastructure.

marsbit1h ago

Financing Weekly Report | SBI Makes Consecutive Moves, Bets $125 Million on Gauntlet; Crypto Capital Continues to Flow to Trading and Infrastructure

marsbit1h ago

Trading

Spot

Hot Articles

What is $BITCOIN

DIGITAL GOLD ($BITCOIN): A Comprehensive Analysis Introduction to DIGITAL GOLD ($BITCOIN) DIGITAL GOLD ($BITCOIN) is a blockchain-based project operating on the Solana network, which aims to combine the characteristics of traditional precious metals with the innovation of decentralized technologies. While it shares a name with Bitcoin, often referred to as “digital gold” due to its perception as a store of value, DIGITAL GOLD is a separate token designed to create a unique ecosystem within the Web3 landscape. Its goal is to position itself as a viable alternative digital asset, although specifics regarding its applications and functionalities are still developing. What is DIGITAL GOLD ($BITCOIN)? DIGITAL GOLD ($BITCOIN) is a cryptocurrency token explicitly designed for use on the Solana blockchain. In contrast to Bitcoin, which provides a widely recognized value storage role, this token appears to focus on broader applications and characteristics. Notable aspects include: Blockchain Infrastructure: The token is built on the Solana blockchain, known for its capacity to handle high-speed and low-cost transactions. Supply Dynamics: DIGITAL GOLD has a maximum supply capped at 100 quadrillion tokens (100P $BITCOIN), although details regarding its circulating supply are currently undisclosed. Utility: While precise functionalities are not explicitly outlined, there are indications that the token could be utilized for various applications, potentially involving decentralized applications (dApps) or asset tokenization strategies. Who is the Creator of DIGITAL GOLD ($BITCOIN)? At present, the identity of the creators and development team behind DIGITAL GOLD ($BITCOIN) remains unknown. This situation is typical among many innovative projects within the blockchain space, particularly those aligning with decentralized finance and meme coin phenomena. While such anonymity may foster a community-driven culture, it intensifies concerns about governance and accountability. Who are the Investors of DIGITAL GOLD ($BITCOIN)? The available information indicates that DIGITAL GOLD ($BITCOIN) does not have any known institutional backers or prominent venture capital investments. The project seems to operate on a peer-to-peer model focused on community support and adoption rather than traditional funding routes. Its activity and liquidity are primarily situated on decentralized exchanges (DEXs), such as PumpSwap, rather than established centralized trading platforms, further highlighting its grassroots approach. How DIGITAL GOLD ($BITCOIN) Works The operational mechanics of DIGITAL GOLD ($BITCOIN) can be elaborated on based on its blockchain design and network attributes: Consensus Mechanism: By leveraging Solana’s unique proof-of-history (PoH) combined with a proof-of-stake (PoS) model, the project ensures efficient transaction validation contributing to the network's high performance. Tokenomics: While specific deflationary mechanisms have not been extensively detailed, the vast maximum token supply implies that it may cater to microtransactions or niche use cases that are still to be defined. Interoperability: There exists the potential for integration with Solana’s broader ecosystem, including various decentralized finance (DeFi) platforms. However, the details regarding specific integrations remain unspecified. Timeline of Key Events Here is a timeline that highlights significant milestones concerning DIGITAL GOLD ($BITCOIN): 2023: The initial deployment of the token occurs on the Solana blockchain, marked by its contract address. 2024: DIGITAL GOLD gains visibility as it becomes available for trading on decentralized exchanges like PumpSwap, allowing users to trade it against SOL. 2025: The project witnesses sporadic trading activity and potential interest in community-led engagements, although no noteworthy partnerships or technical advancements have been documented as of yet. Critical Analysis Strengths Scalability: The underlying Solana infrastructure supports high transaction volumes, which could enhance the utility of $BITCOIN in various transaction scenarios. Accessibility: The potential low trading price per token could attract retail investors, facilitating wider participation due to fractional ownership opportunities. Risks Lack of Transparency: The absence of publicly known backers, developers, or an audit process may yield skepticism regarding the project's sustainability and trustworthiness. Market Volatility: The trading activity is heavily reliant on speculative behavior, which can result in significant price volatility and uncertainty for investors. Conclusion DIGITAL GOLD ($BITCOIN) emerges as an intriguing yet ambiguous project within the rapidly evolving Solana ecosystem. While it attempts to leverage the “digital gold” narrative, its departure from Bitcoin's established role as a store of value underscores the need for a clearer differentiation of its intended utility and governance structure. Future acceptance and adoption will likely depend on addressing the current opacity and defining its operational and economic strategies more explicitly. Note: This report encompasses synthesised information available as of October 2023, and developments may have transpired beyond the research period.

762 Total ViewsPublished 2025.05.13Updated 2025.05.13

What is $BITCOIN

Discussions

Welcome to the HTX Community. Here, you can stay informed about the latest platform developments and gain access to professional market insights. Users' opinions on the price of BTC (BTC) are presented below.

活动图片