Macro Insight
Oil Breaks Away, Risk Recoils
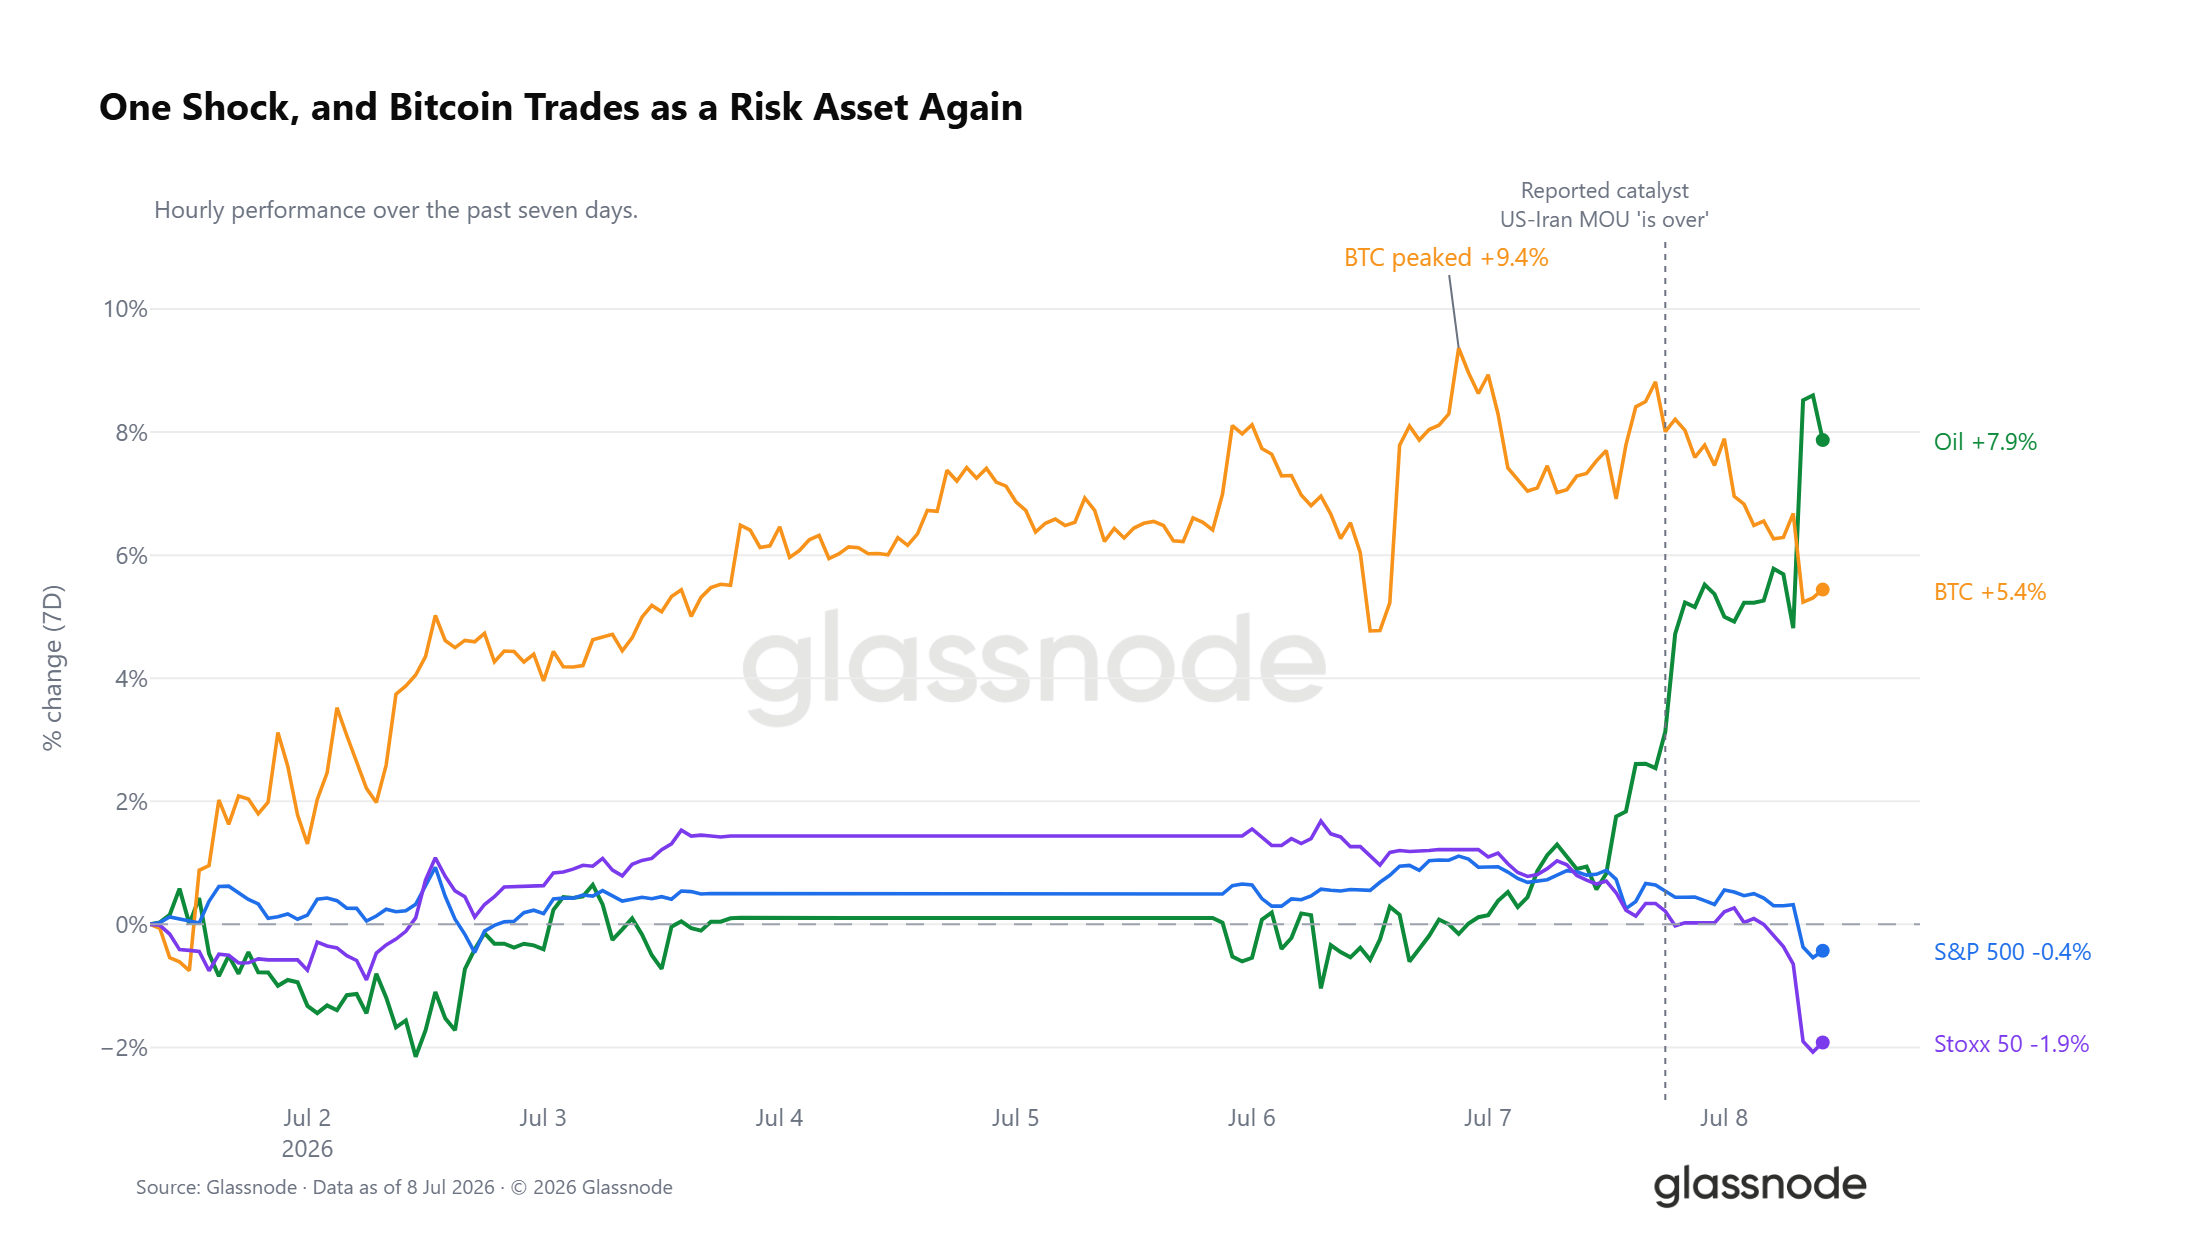
WTI crude has run to up 7.9% over the past seven days, with most of that leg happening in the last few hours after reports that the US-Iran memorandum of understanding had lapsed. The shock flipped the cross-asset tape. Bitcoin, up as much as 9.4% on the week, has rolled back to only a 5% weekly gain, while the S&P and Euro Stoxx both turned negative, the European index leading the move lower. For now, Bitcoin is trading strongly in line with risk assets.
Liquidity Backdrop Conflicted
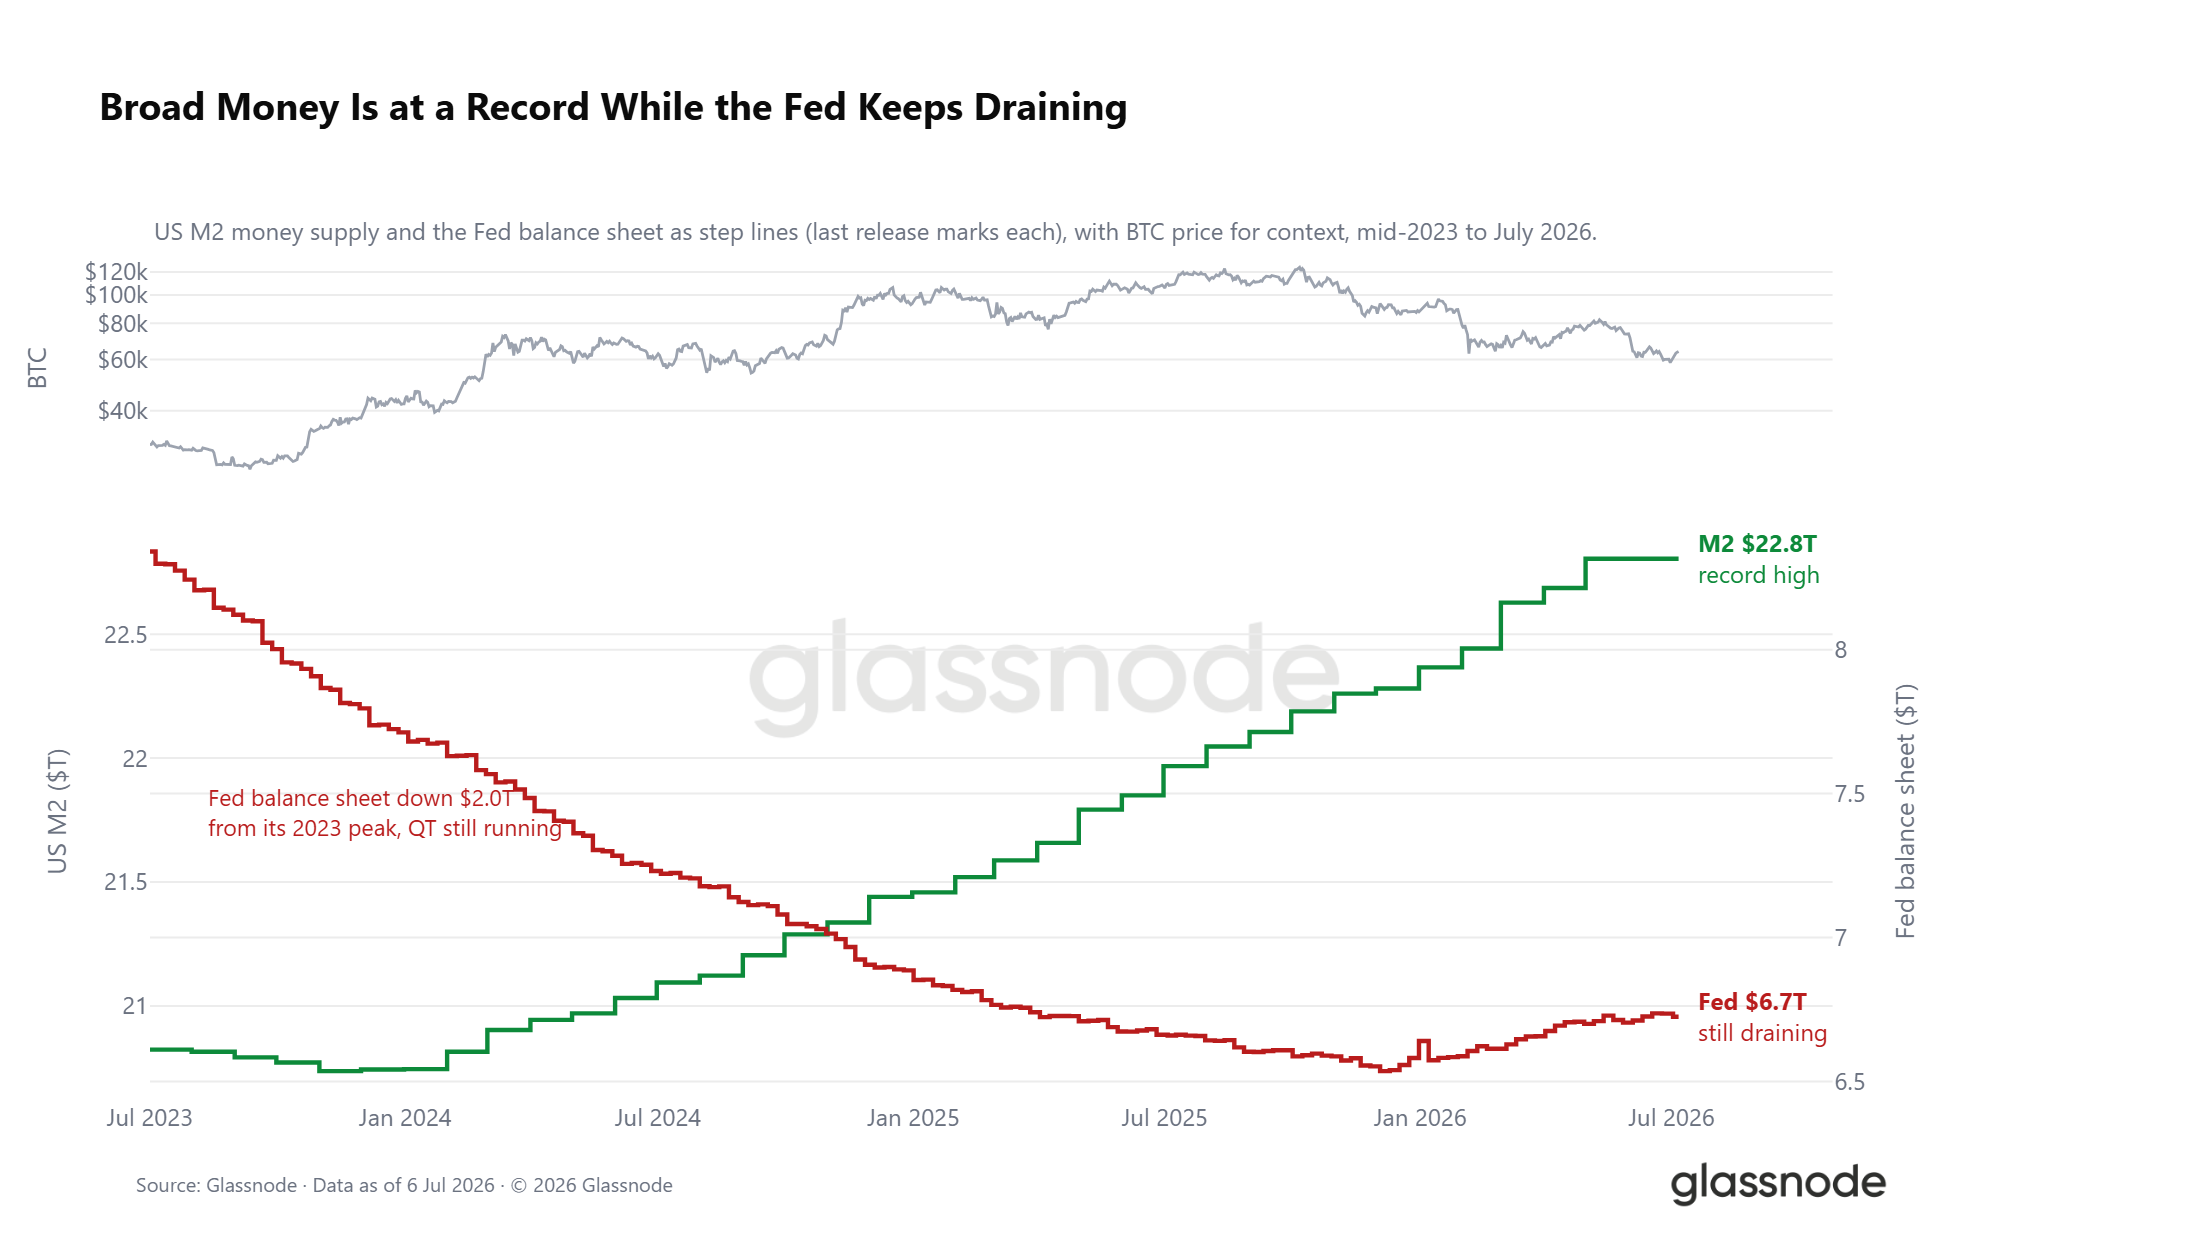
Underneath the shock, the liquidity backdrop is split. US M2 has pushed to a record $22.8 trillion, the slow tide that has historically led risk appetite, yet the Federal Reserve's balance sheet keeps draining, now $2.0 trillion below its 2023 peak. The tension is a rising broad-money base set against an ongoing quantitative drain, with real yields still near 1% keeping the cost of holding a non-yielding asset high. The macro door is not shut, but it is not yet firmly open.
On-chain Insight
Five Months in Deep Value
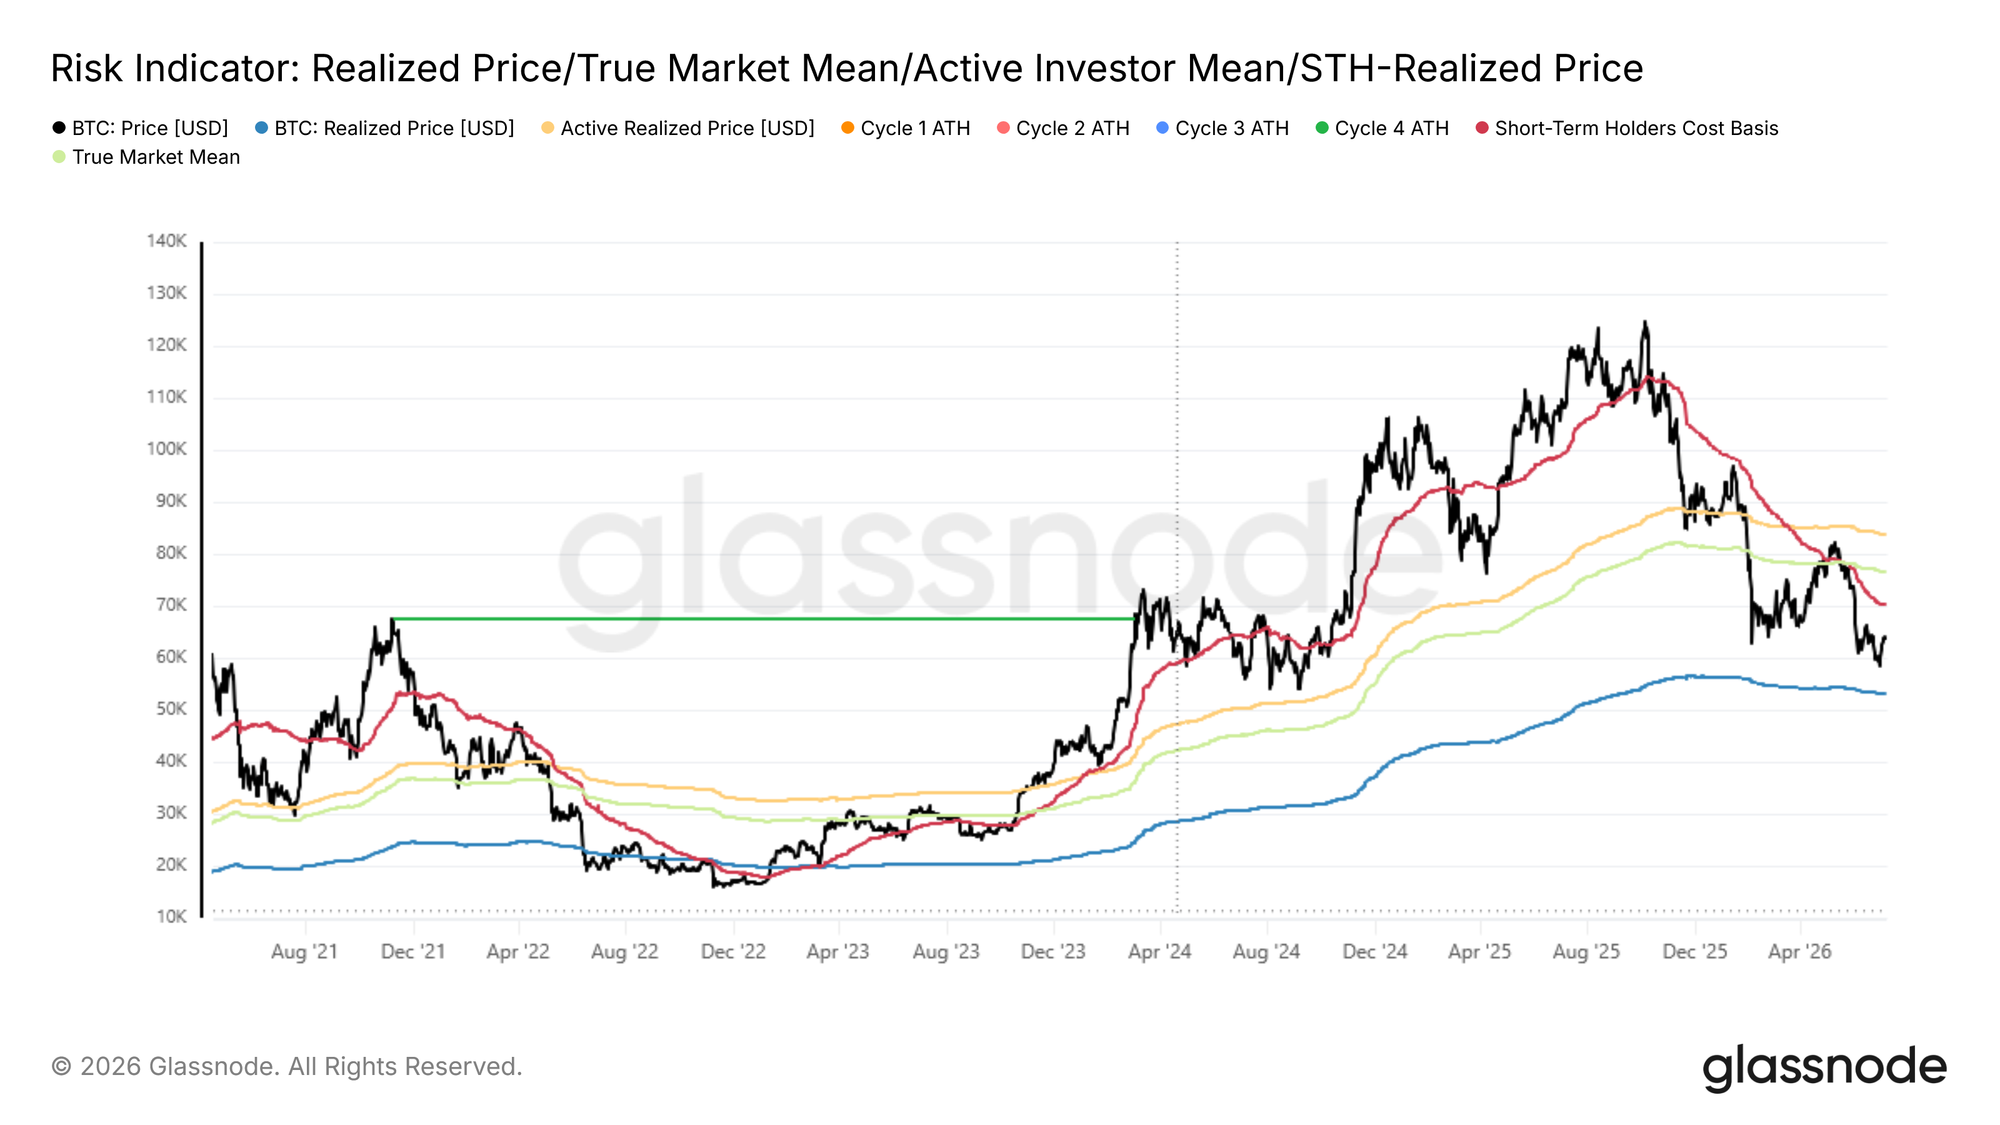
Bitcoin has bounced from $58.3k to $64.4k over the past week, a constructive near-term development but one that leaves price firmly below both the True Market Mean at $76.6k and the Short-Term Holder Cost Basis at $72.2k. Until these levels are reclaimed, the market remains in deep value territory and structurally vulnerable to any external negative catalyst. However, the duration of this discount phase deserves attention.
Since early February 2026, price has traded below both the active investor cost basis and the recent buyer breakeven level for approximately five months, making this one of the more extended deep value episodes in Bitcoin's history. Prolonged accumulation at such a discount, where new capital is consistently deployed below the cost basis of both recent buyers and the broader active market, has conventionally served as the foundation for cyclical bottoms and represents an attractive zone for value-oriented investors. While the evidence suggests this process is approaching its later stages, the lower band of the bear market range near the Realized Price at $53k remains a possibility that cannot be dismissed.
Top Buyers Driving the Sell Pressure
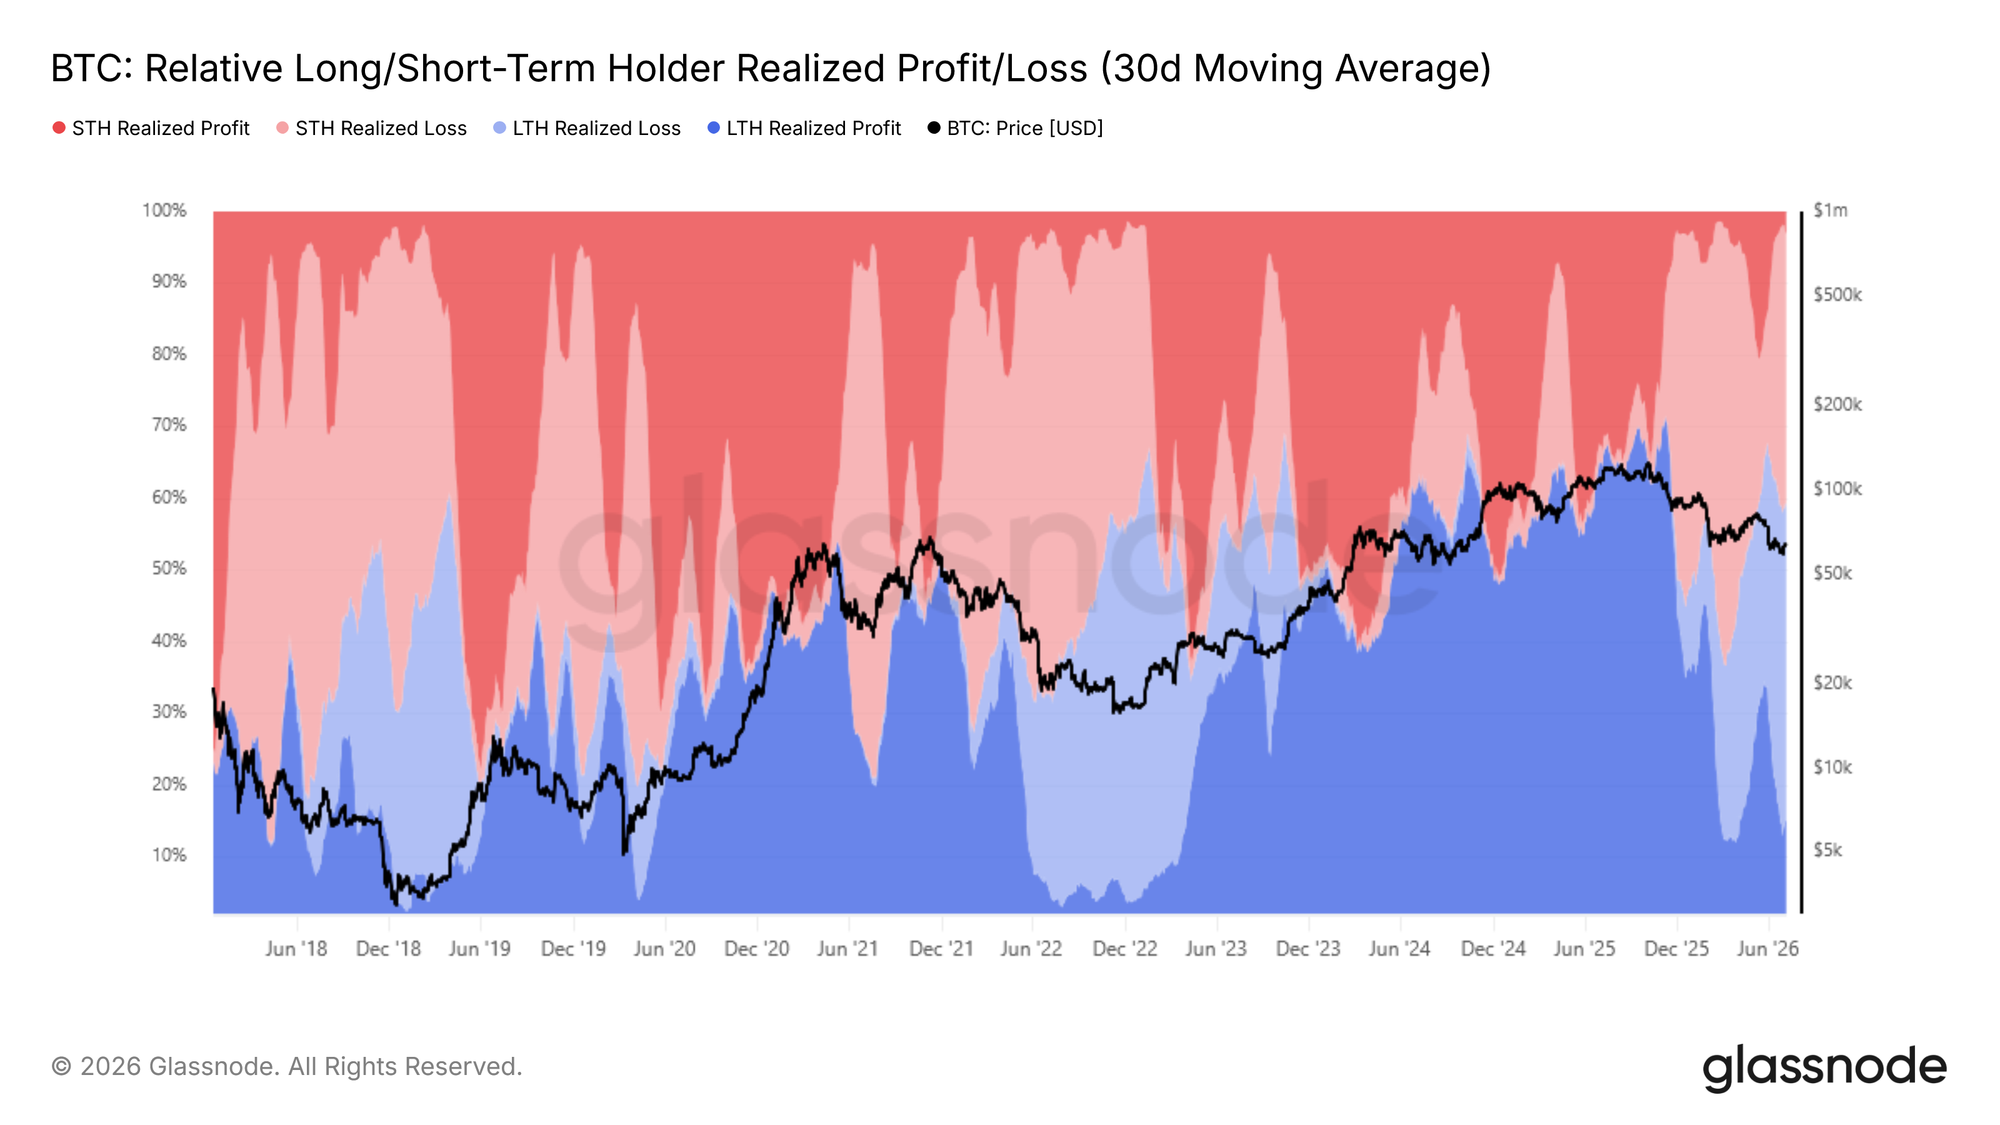
With the market potentially hammering a cyclical bottom, identifying the dominant source of downward pressure becomes the central question. The Relative Long/Short-Term Holder Realized Profit and Loss tracks the distribution of total realized value across long and short-term holder cohorts, capturing each group's share of aggregate profit and loss crystallized on-chain.
As price slipped below the True Market Mean, the share of total realized value attributed to long-term holder loss realization (30D-SMA) has grown from 15% in early February 2026 to 43% currently, making this cohort's frustration-driven capitulation the single largest force weighing on price. These are investors who acquired near the cycle top and have now held through months of drawdown, increasingly choosing to exit as the bear market stretches beyond their conviction threshold. This dynamic directly explains why price has struggled to reclaim the upper band of the current range, as each attempted recovery is met with a fresh wave of distribution from this underwater cohort.
Capitulation Not Yet Cooling
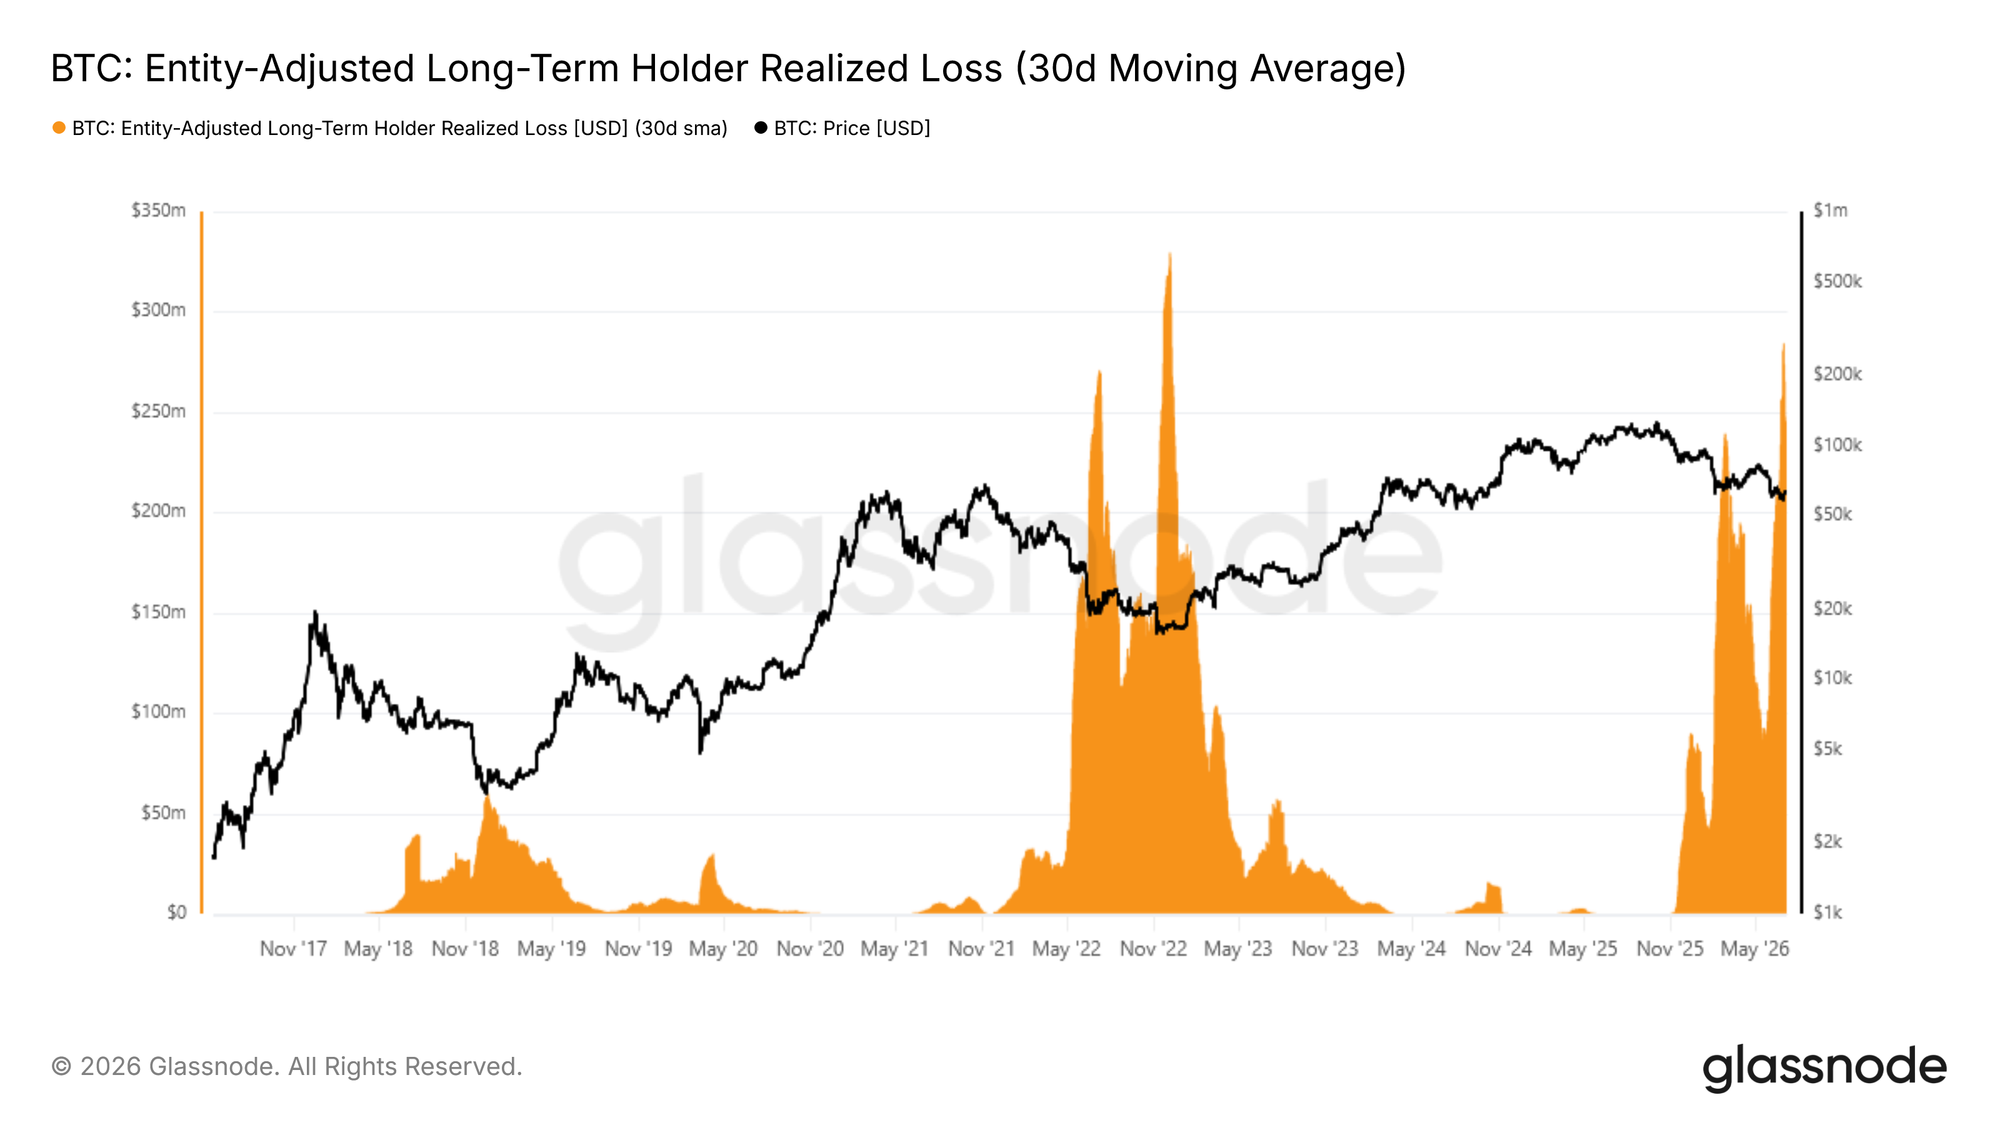
With long-term holder loss realization now the dominant downward force in the market, the next step is to gauge whether this pressure is beginning to subside. The Entity-Adjusted Long-Term Holder Realized Loss, smoothed by a 30-day SMA, measures the dollar value of losses crystallized by holders who acquired their coins more than 155 days ago, filtering out internal transfers to capture genuine capitulation activity.
This indicator recently printed a new peak at approximately $280M per day, the highest reading since December 2022, marking the second major spike in long-term holder sell pressure during this bear cycle. Critically, unlike the first spike which was followed by a partial cooldown, the current wave has not yet contracted to lower levels. Until this metric compresses meaningfully, the path toward a credible transition back to bull market conditions remains obstructed. In the coming weeks to months, the trajectory of this indicator will be among the most important signals for determining whether the market is approaching genuine sell-side exhaustion.
Off-chain Insight
ETF Outflows Easing, Not Resolved
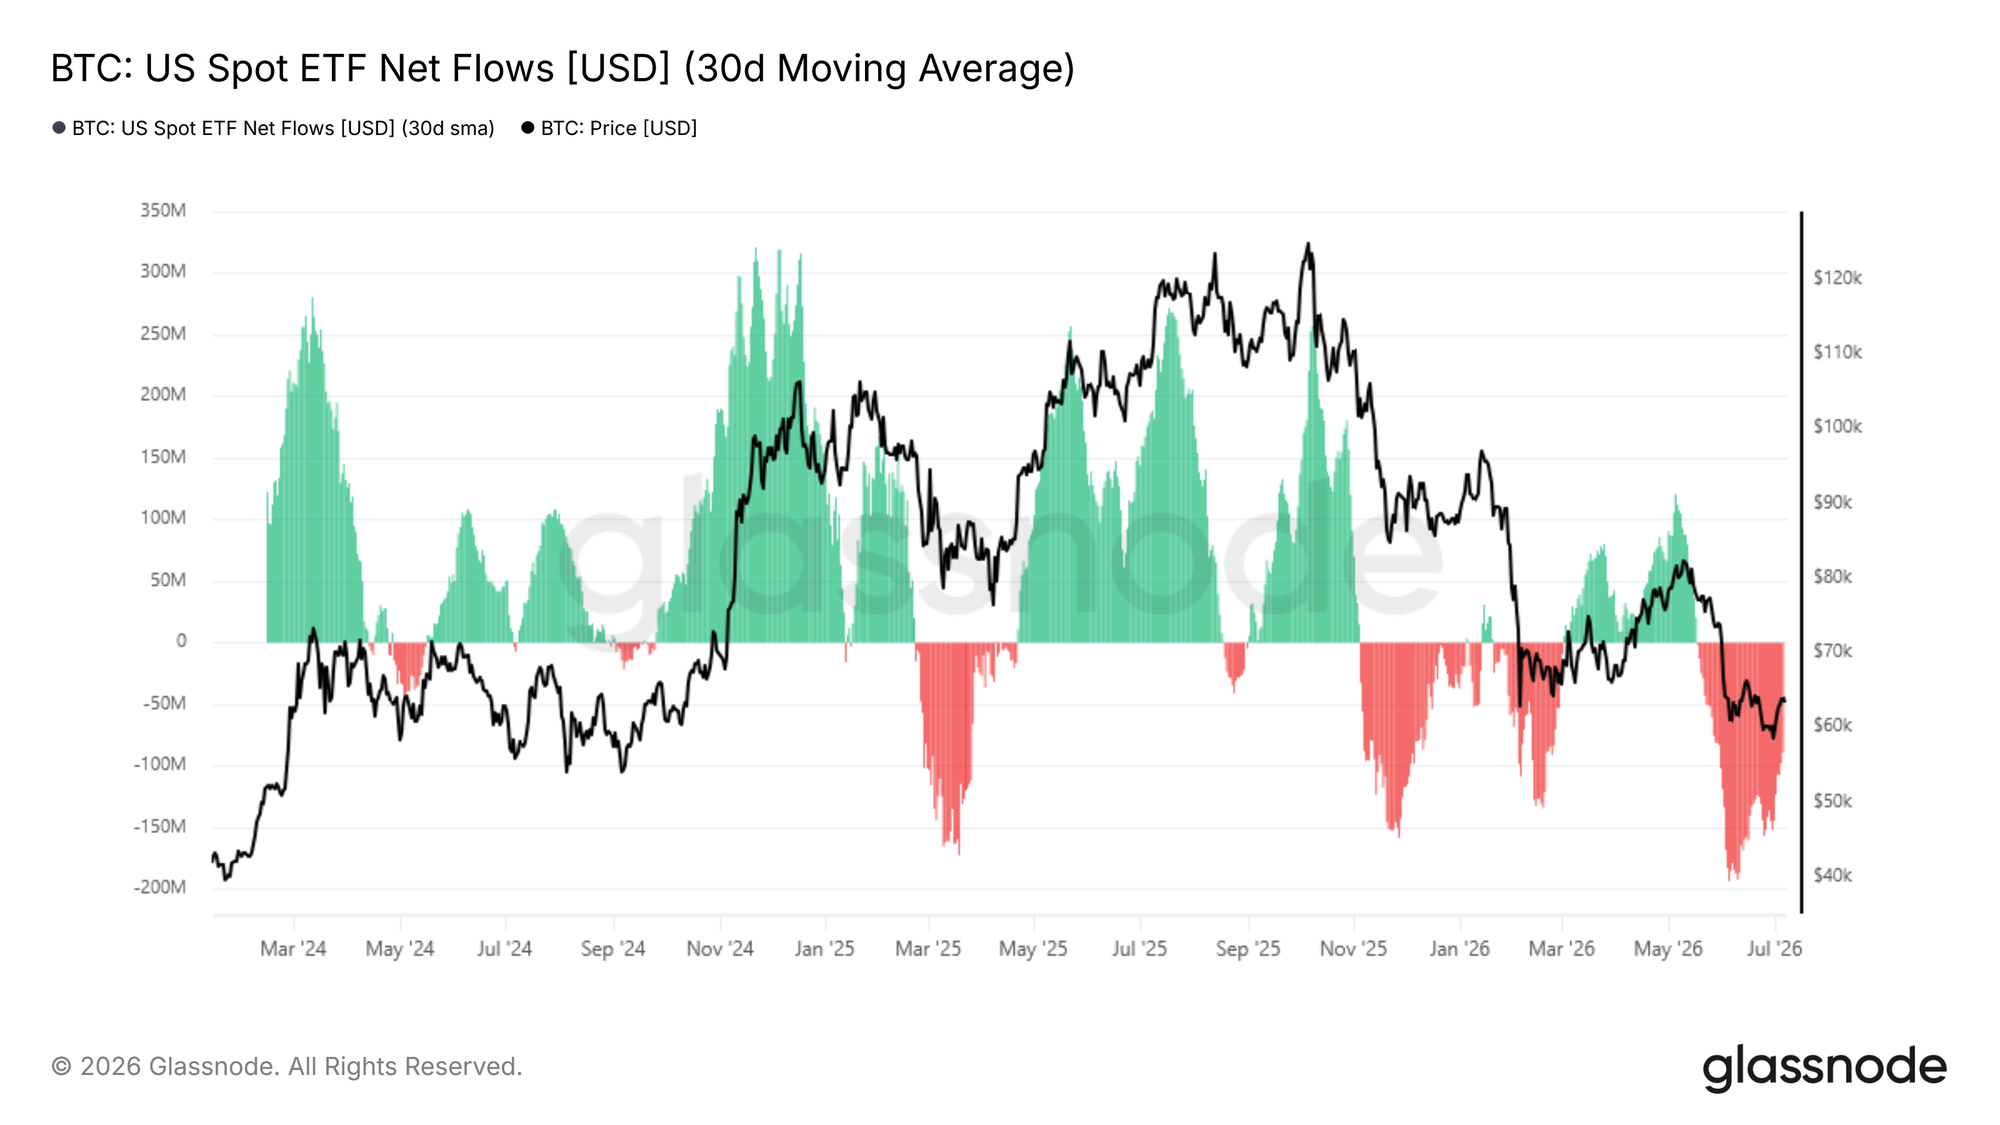
Shifting from the on-chain dimension to off-chain market dynamics, the behavior of ETF investors provides a complementary lens on institutional demand. The 30-day SMA of ETF Netflow captures the smoothed daily net capital entering or leaving US spot Bitcoin ETFs, filtering out single-day volatility to reveal the underlying trend in institutional positioning.
Since mid-May 2026, this indicator shifted into a net monthly outflow regime, peaking at -$193M per day in early June before cooling to -$88.9M per day currently. While the deceleration in outflow pace is a tentative positive, the market remains in a net bleeding state on a monthly basis, confirming that institutional demand has not yet stabilized. Further compression toward neutral levels would be a necessary precondition before any speculation about a potential expansion in the near term can be supported by this data layer.
Institutional Volume Still Muted
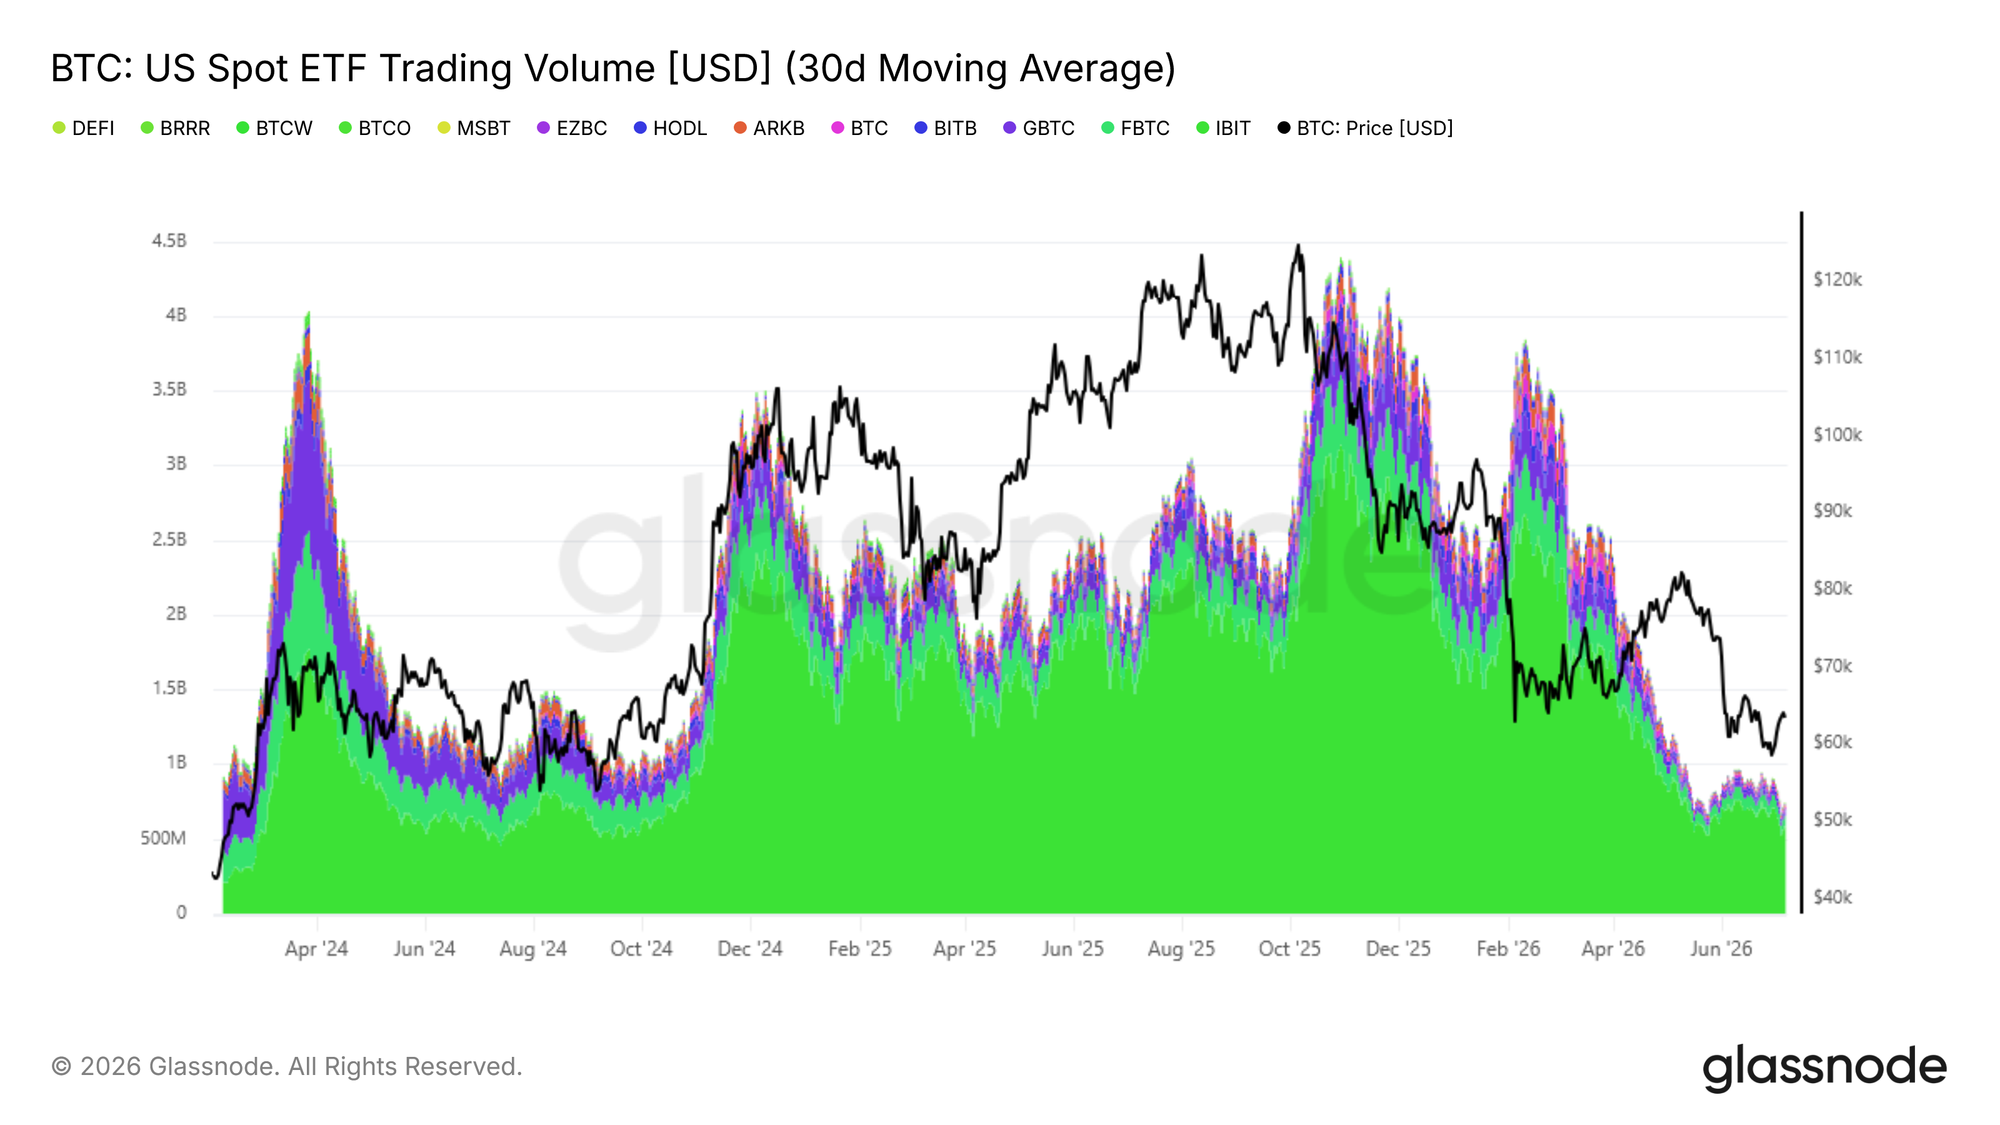
Alongside net flows, the US Spot ETF Trading Volume provides a complementary read on whether institutional confidence is recovering. The 30-day SMA of daily ETF trading volume has been ranging between $650M and $950M per day, a level comparable to the Q4 2024 environment and the same time ~80% below the $4.4B per day peak recorded in October 2025.
While the current volume range reflects baseline institutional participation, it remains deeply muted relative to bull market peaks, indicating that conviction among ETF investors has not meaningfully returned. A sustained expansion in daily trading volume alongside a compression of net outflows would together constitute the minimum conditions for confirming a revival in institutional demand. Until both signals emerge in tandem, the off-chain data continues to reinforce the broader bearish regime identified through on-chain metrics.
Derivatives Short Appetite Satiated
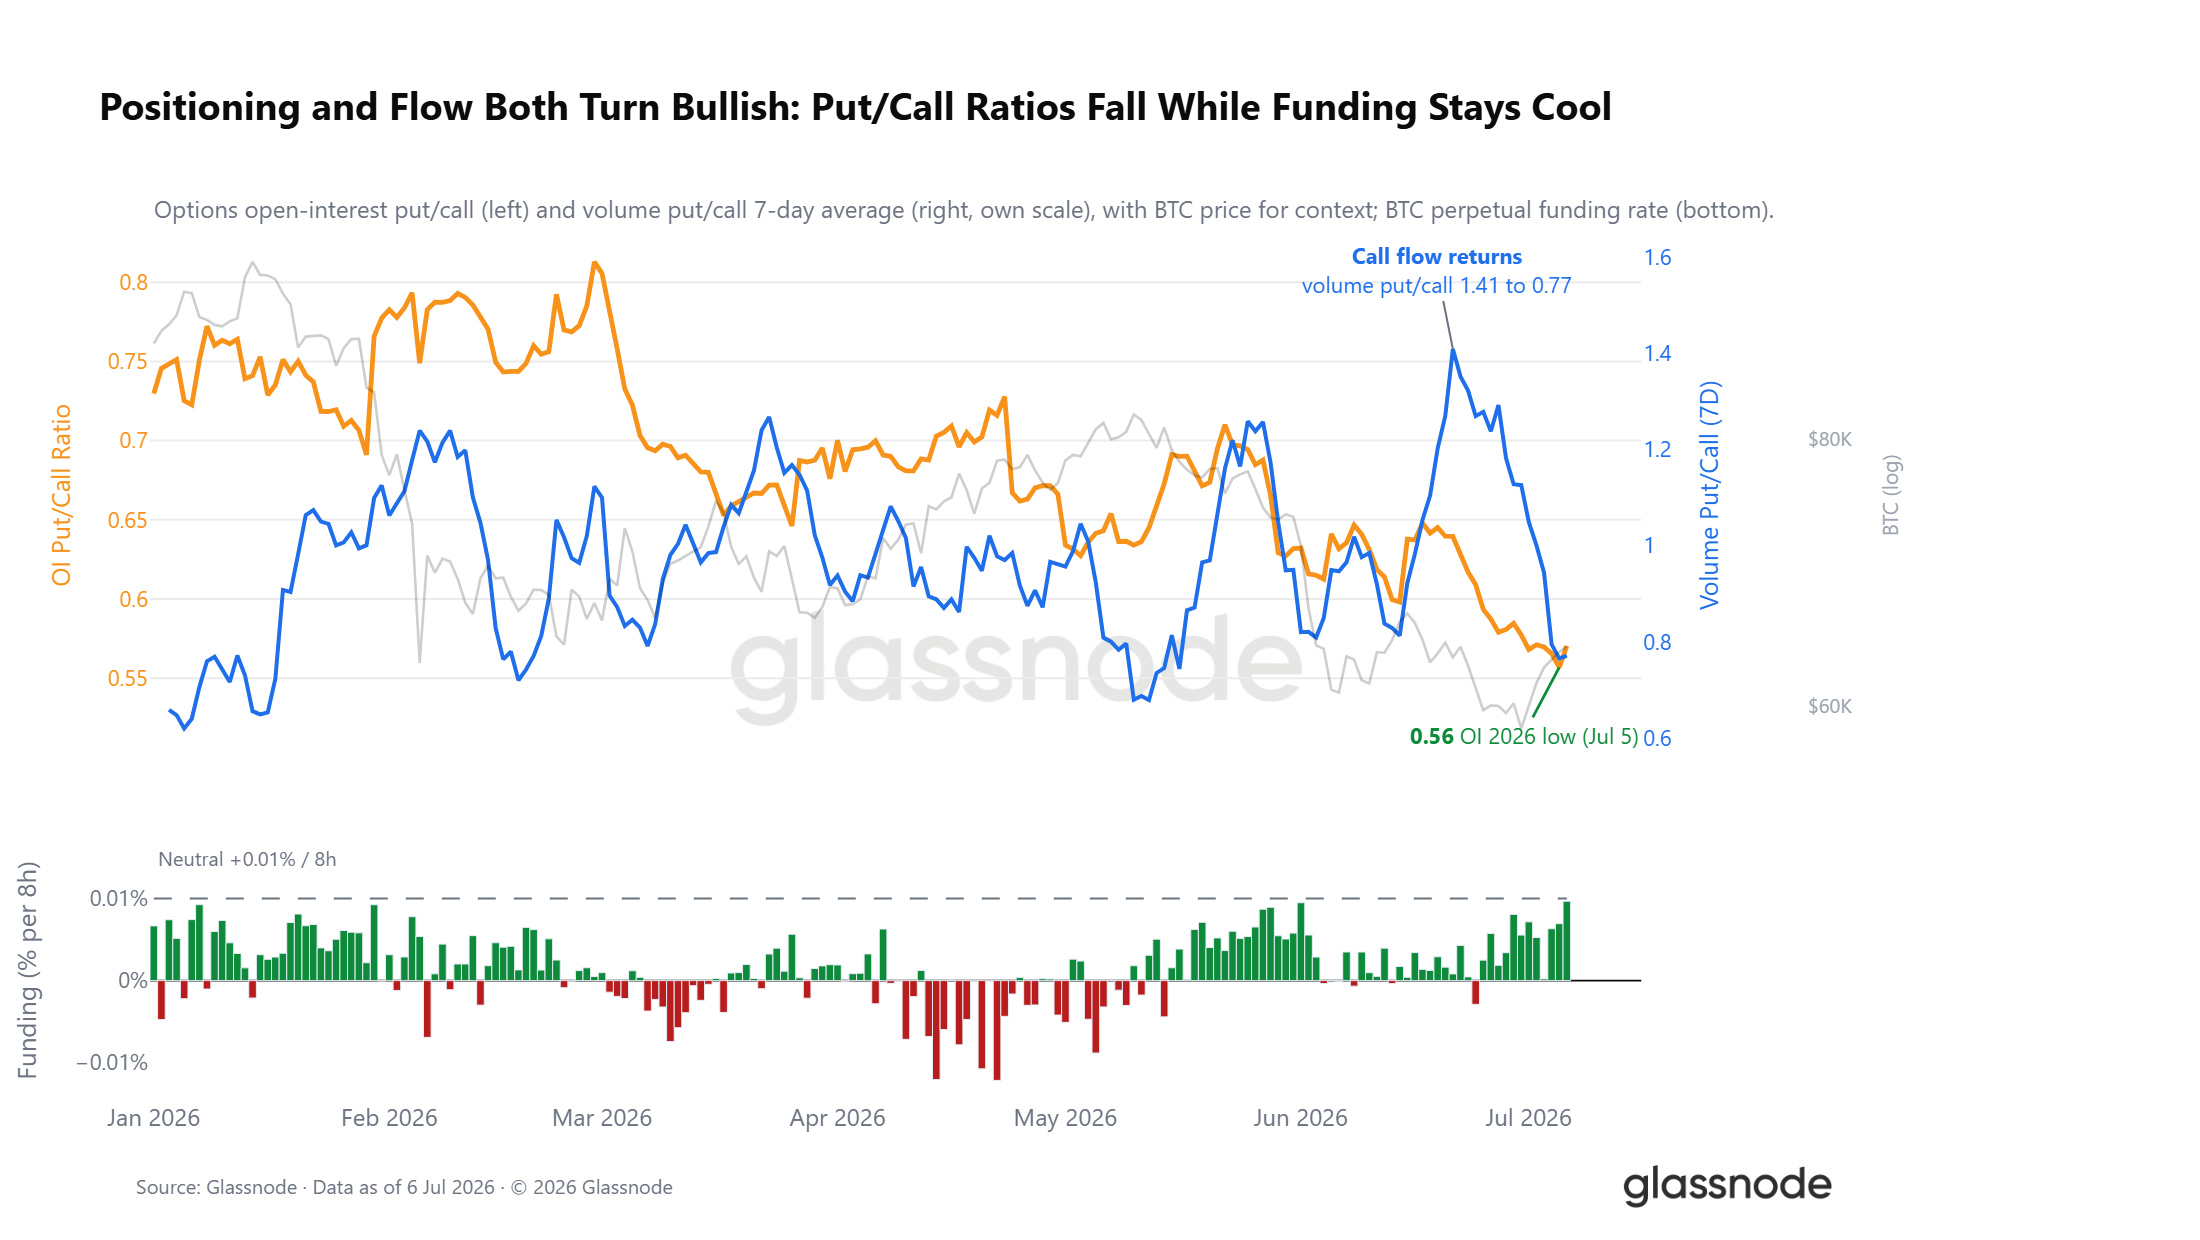
Beneath the risk-off tape, the derivatives book is beginning to position the other way. The options open-interest put/call ratio has fallen to 0.56, its lowest reading of 2026, leaving the market holding roughly two calls for every put. The flow tells the same story faster. As Bitcoin retested its lows two weeks ago, the volume put/call ratio spiked heavily as traders paid up for downside, and it has since collapsed as call flow returned, even as spot has clawed back only part of its selloff.
Perps confirm the tilt. Perpetual funding has averaged well below the 0.01% exchange-neutral line and a fraction of the levels that mark crowded longs. This is a book that has de-risked and leaned cautiously long into the shock, the opposite of the positioning that usually precedes a flush.
The Surface Still Prices Downside
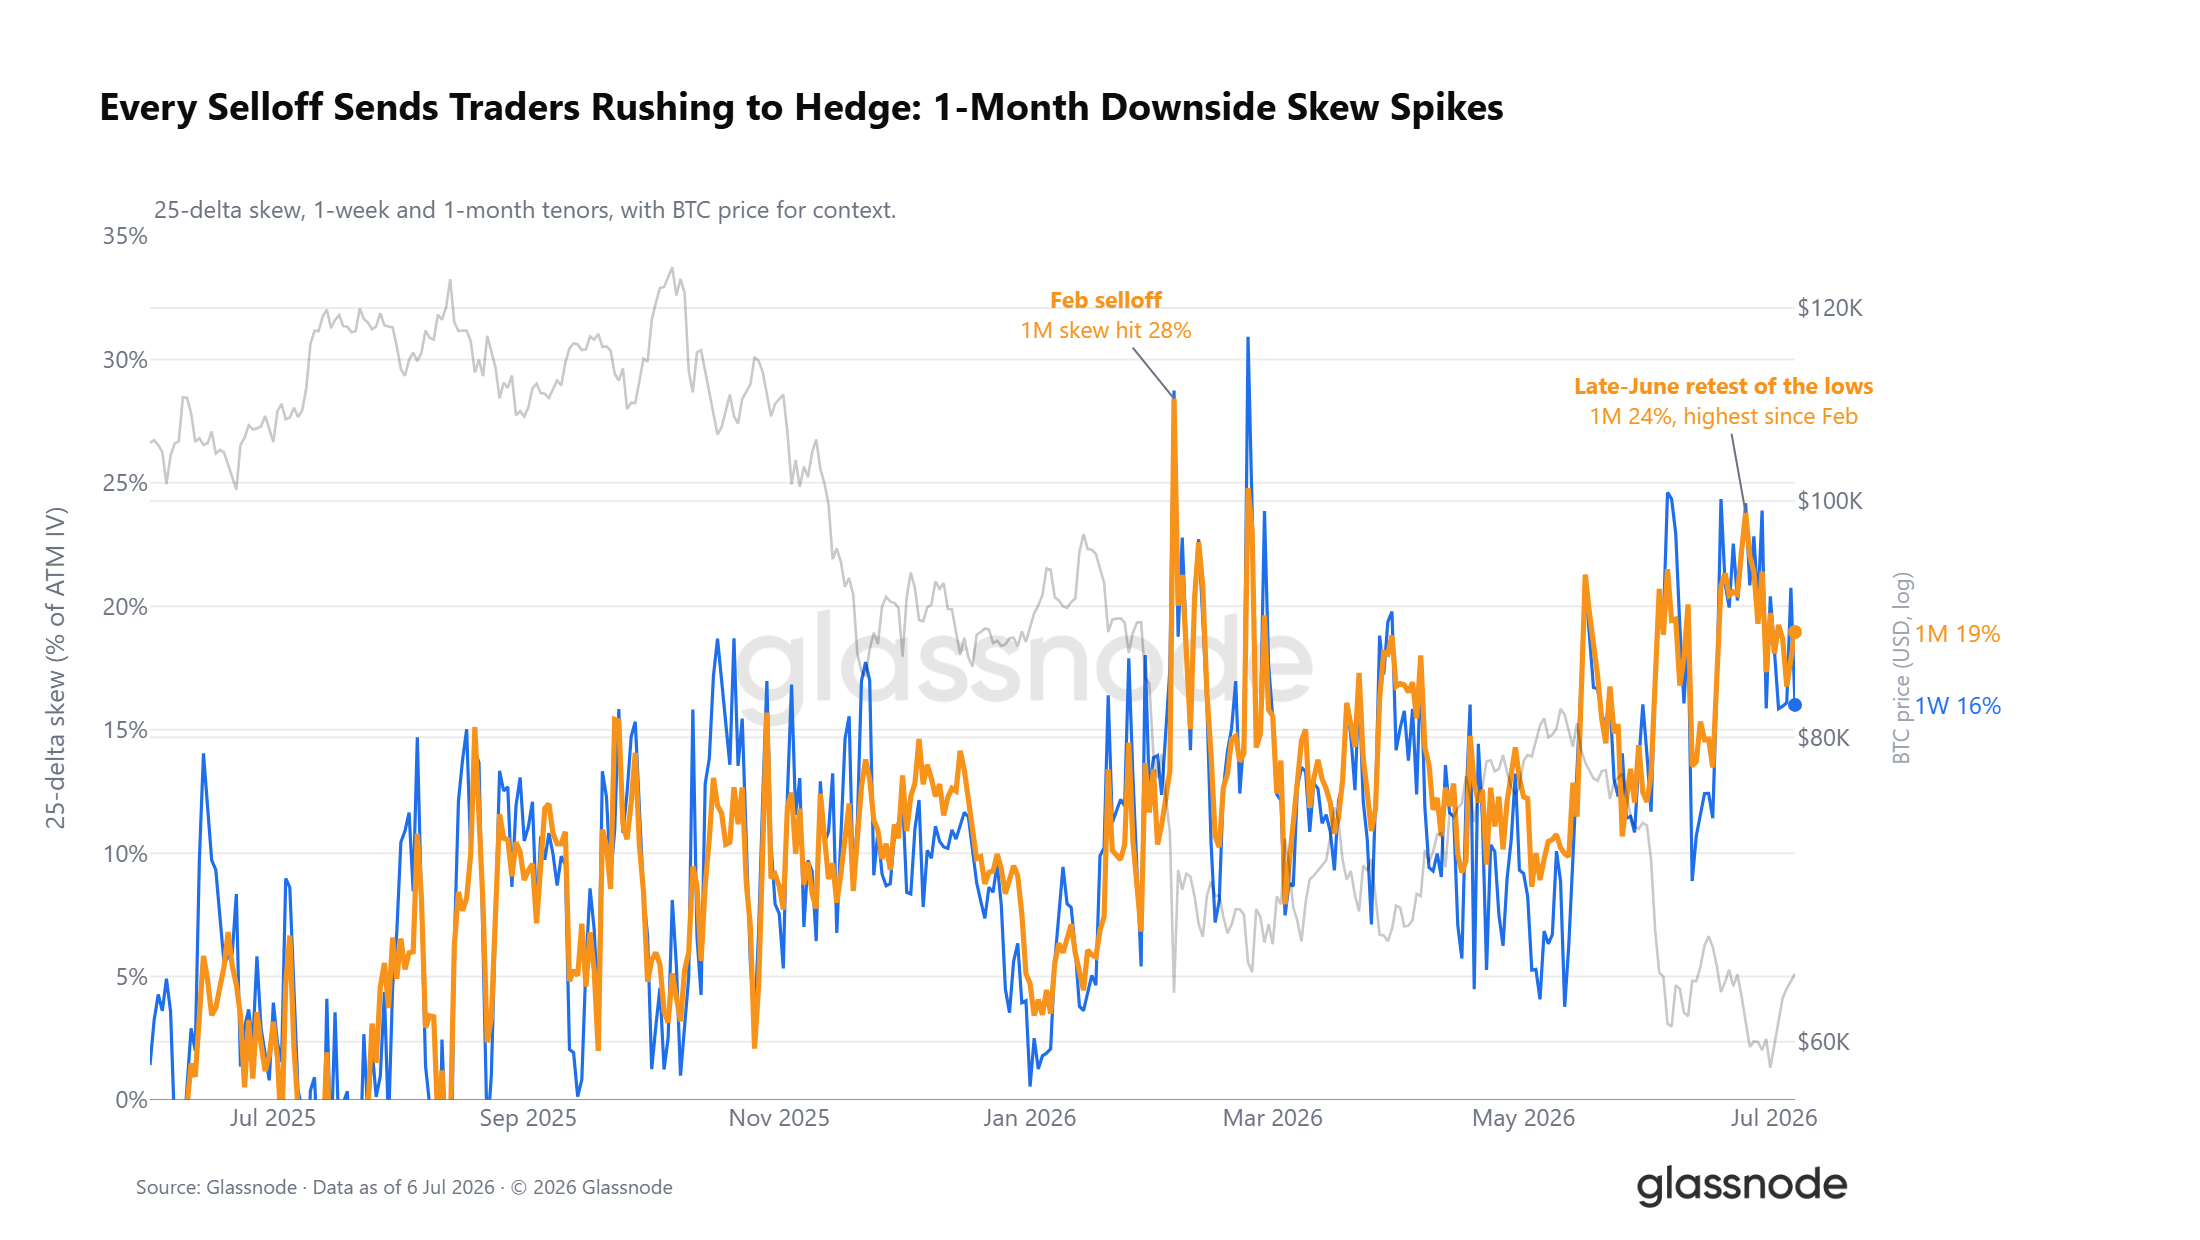
The options surface somewhat disagrees with the positioning. The 25-delta skew, the premium of downside protection over upside, is bid across every tenor. Every selloff since the winter has re-bid it, and late June's spike to 24% was the most defensive the front end has been since the February selloff. Traders are still paying up to hedge each dip, even as the book leans long.
Below the Pin
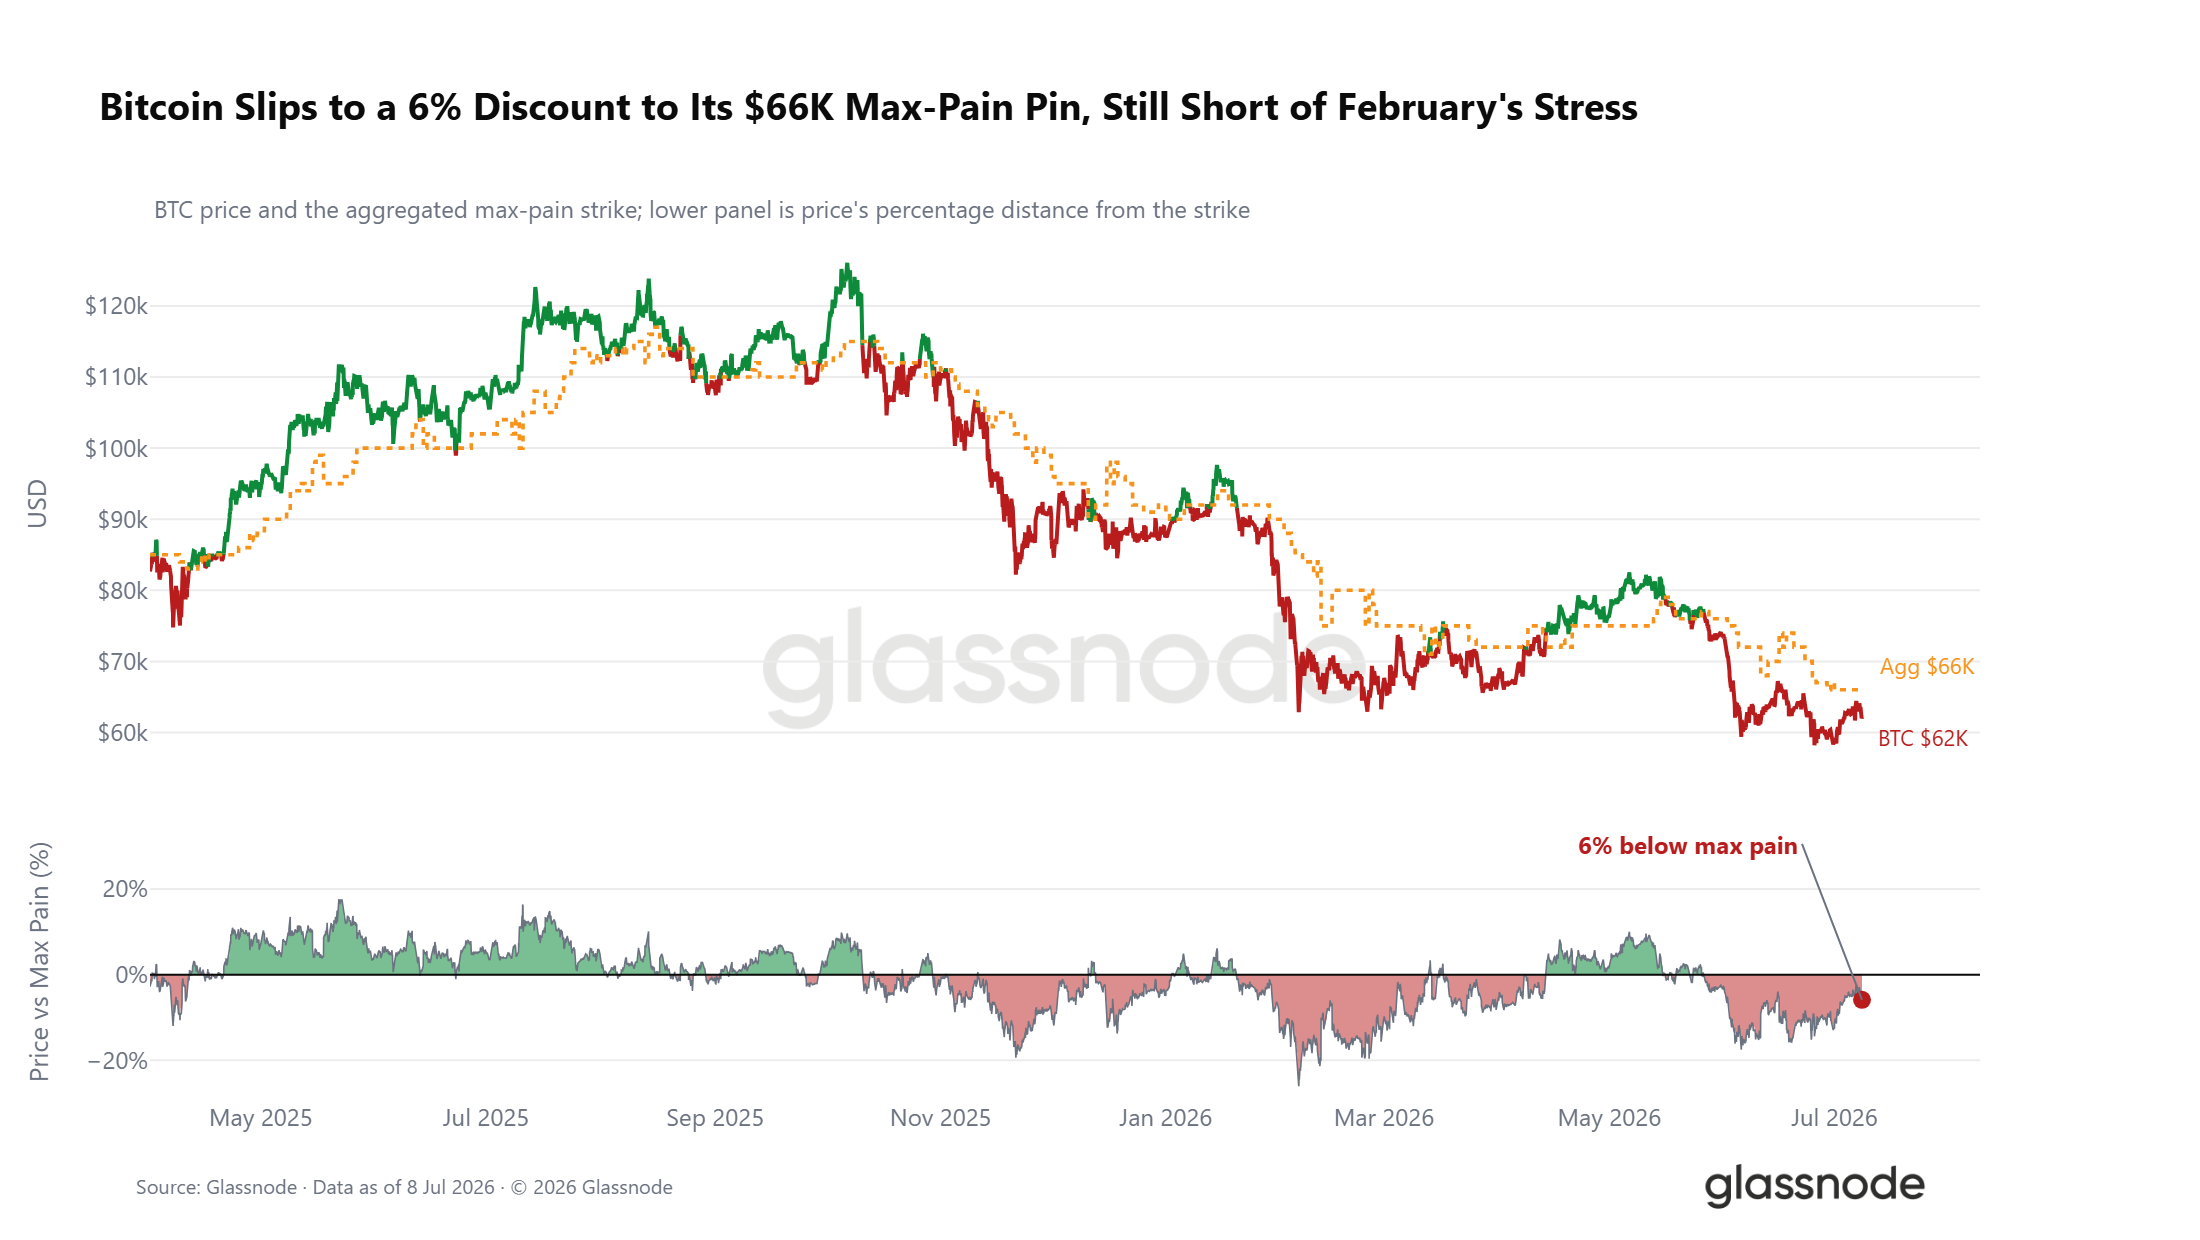
Beyond positioning and skew, the relationship between spot and options market structure adds further context. Bitcoin trades about 6% below its aggregated max pain of $66k, the strike where the most open interest expires worthless and toward which price often gravitates into expiry. The discount has widened with this week's drop, but it remains far from the deep stress observed during February's selloff, sitting nearer the middle of a range that has characterized most of 2026. Max pain has functioned as a loose gravitational anchor throughout the year, with spot oscillating around it rather than sustaining prolonged deviations. A sustained reclaim of $66k would shift the near-term read constructive, while a further widening would reinforce the defensive positioning evident across the options surface.
Crash Premium Is Falling
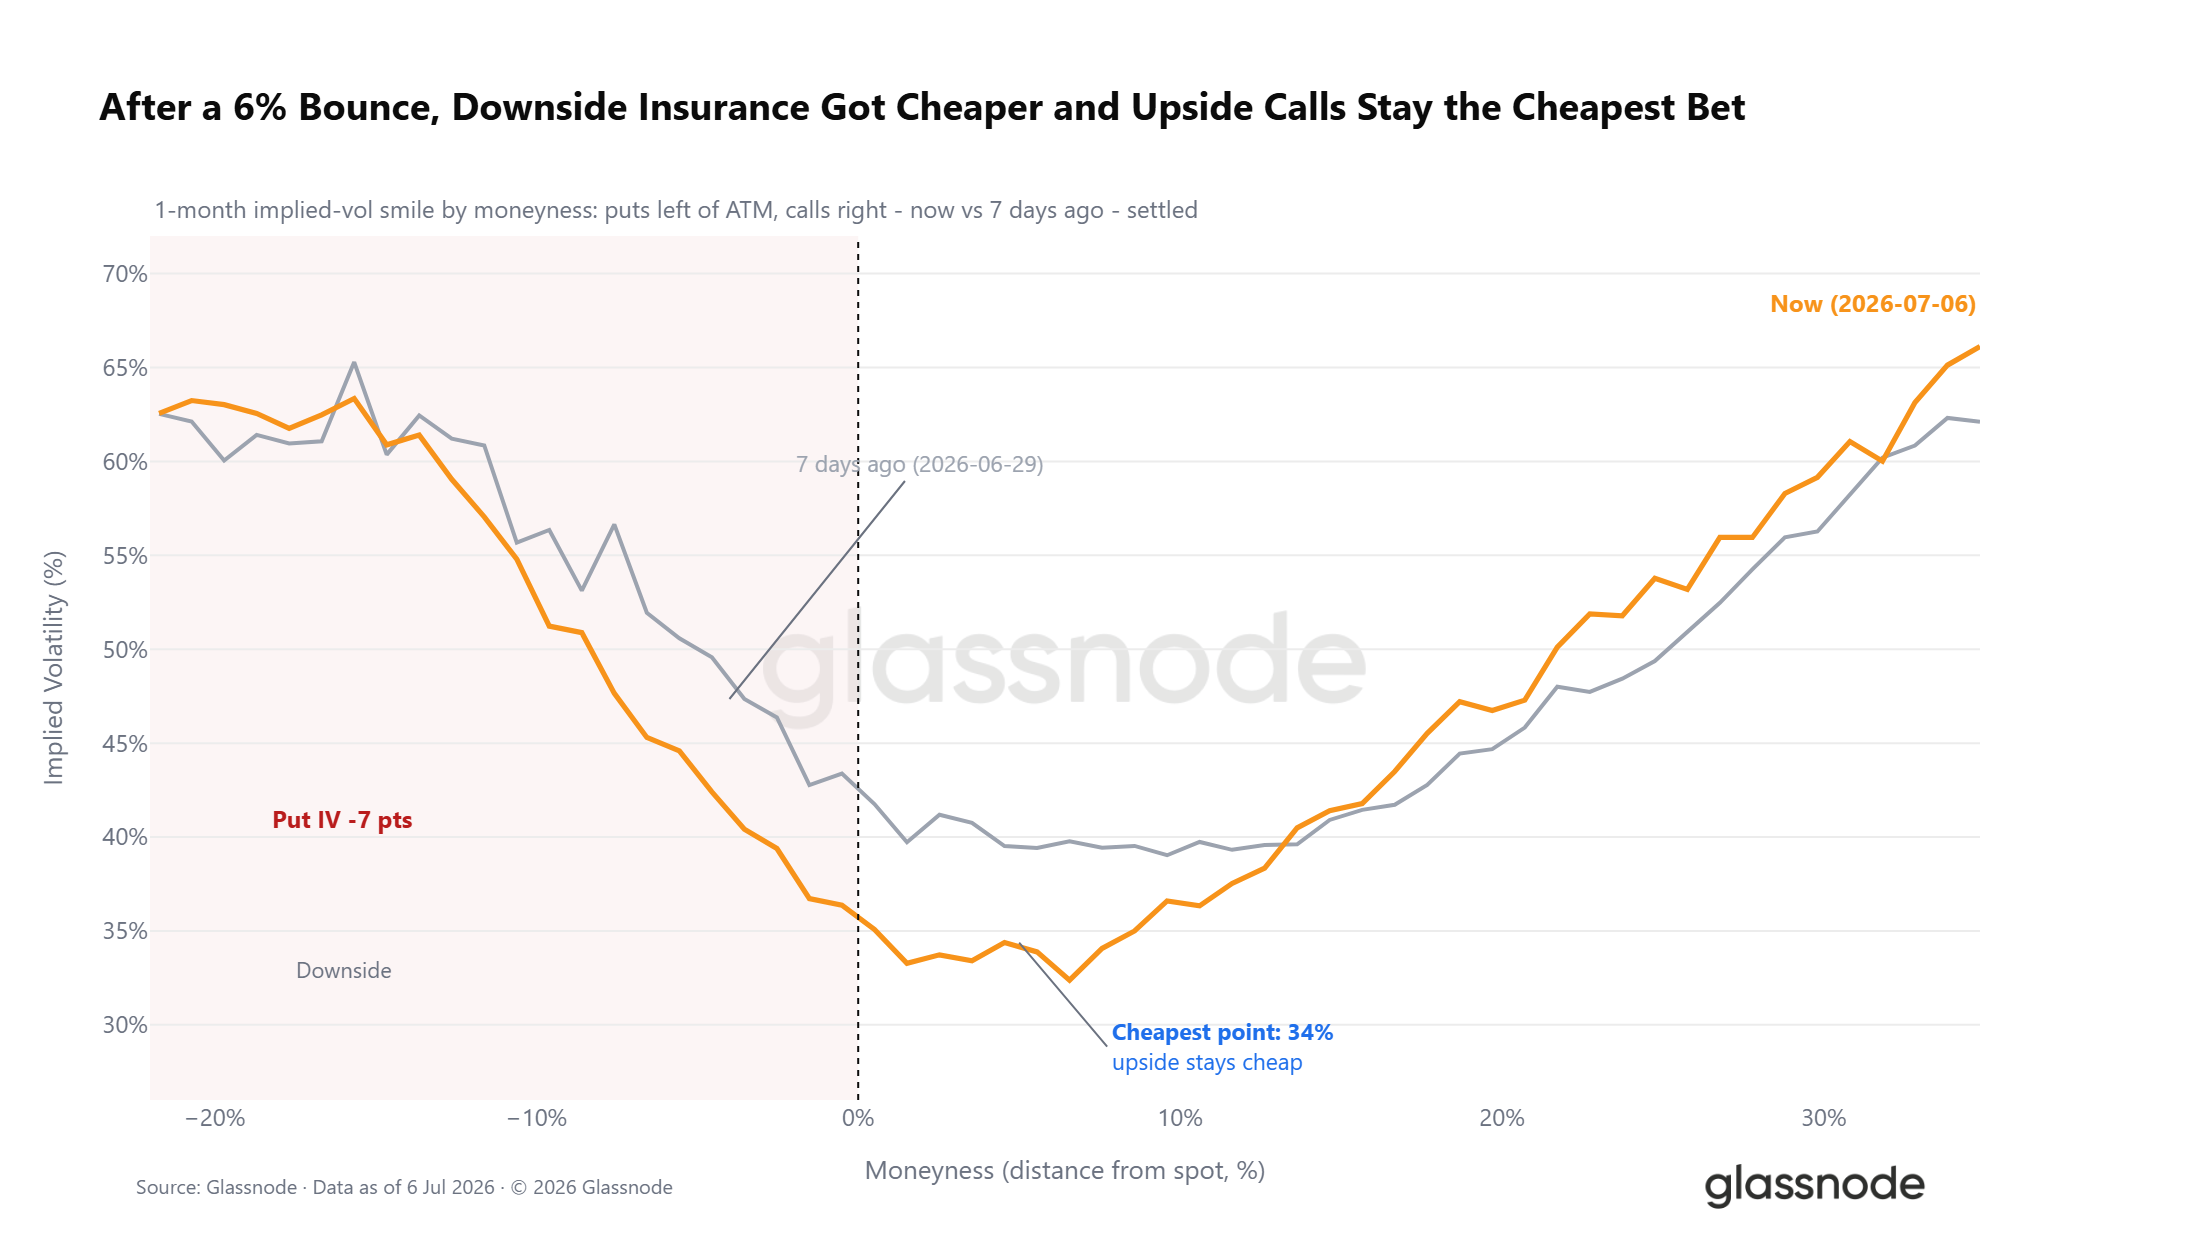
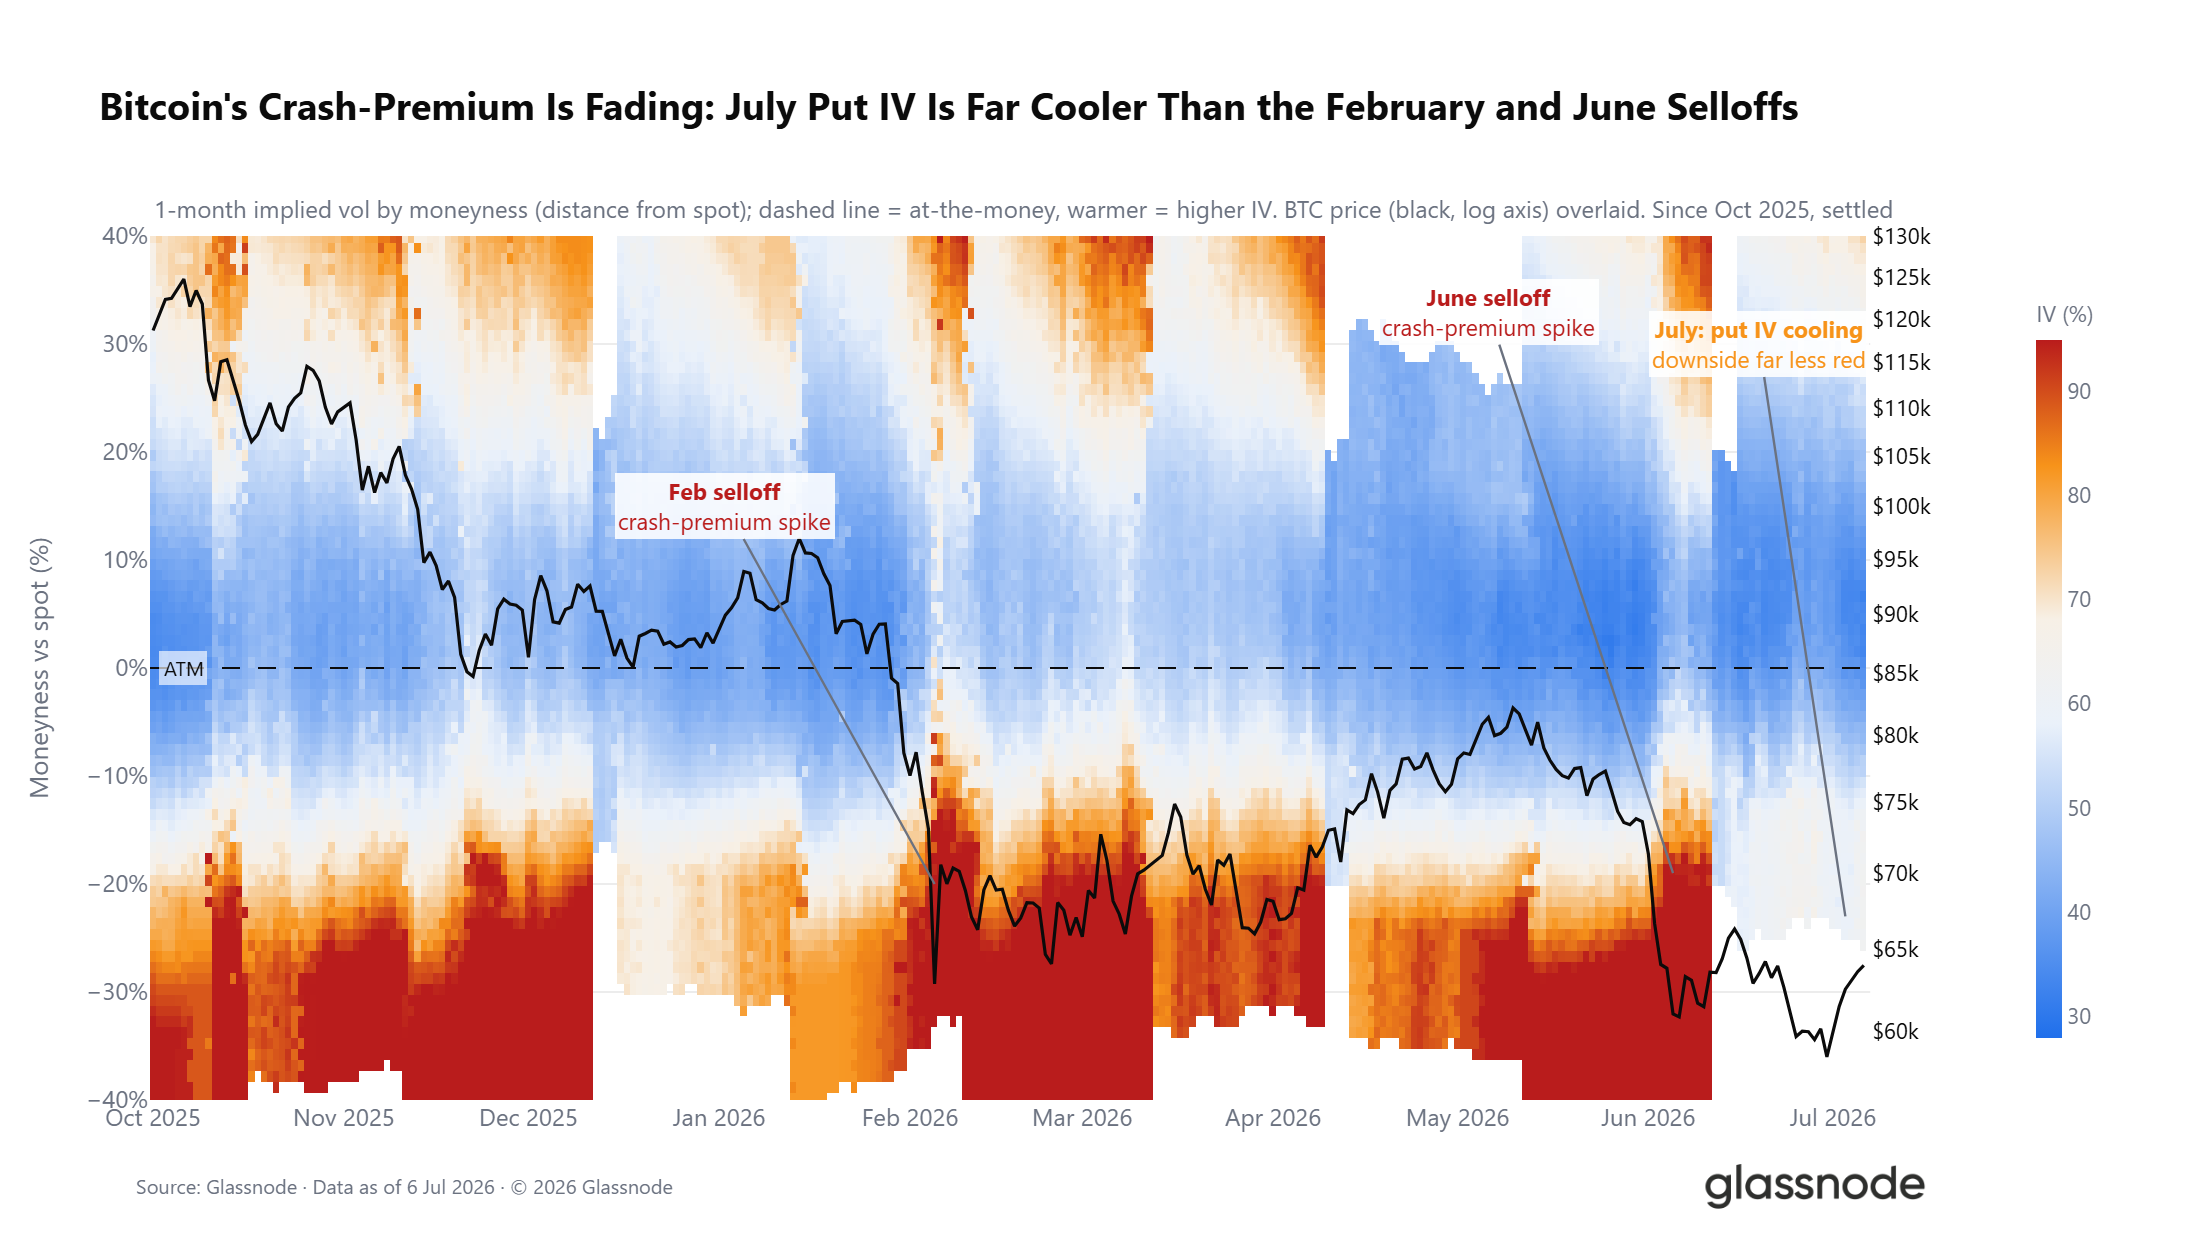
While the skew and positioning signals paint a mixed picture, the absolute cost of protection tells a clearer story. The cost of downside protection is declining as hedging demand subsides. Through the recent recovery, the whole put wing of the 1-month volatility smile repriced lower, with implied volatility 5% below spot falling significantly, while the cheapest point on the curve stayed out on the upside calls. The market still skews defensive, but it is paying materially less in absolute terms to be there.
The longer view reinforces this point. The deep put-side stress that flared bright red during the February and June selloff and has persisted for most of the year has faded into July. With DVOL near a 12-month low, this is a muted-volatility regime where caution has dominated, but is slowly rolling back.
Conclusion
Across all three layers of analysis, the market presents a consistent picture of a bear market in its later stages. On-chain, the five-month deep value regime and rising long-term holder capitulation at $280M per day confirm that supply redistribution is underway, though a sustained cooldown in this metric remains the prerequisite for a credible transition.
Off-chain, ETF outflows have eased from their June peak but continue to bleed on a monthly basis, while trading volume at roughly 80% below October 2025 levels reflects muted institutional conviction. In derivatives, positioning has leaned cautiously long with the put/call ratio at its 2026 low, yet the skew and vol surface still price meaningful downside risk.
Taken together, the conditions for a bottoming process are in place, but the confirmation signals have not yet arrived. The market requires further cooling in capitulation pressure, stabilization in institutional flows, and ideally a sustained reclaim of the True Market Mean before the probability of a regime transition can be weighted constructively.