Bitcoin Shifts to Building a Bottom, with Selling Pressure from Long-Term Holders Significantly Easing

Foresight NewsPublished on 2026-07-16Last updated on 2026-07-16

Abstract

Bitcoin is transitioning into a basing phase, with significant selling pressure from long-term holders showing signs of easing. The market is testing overhead resistance, with Bitcoin responding more positively to favorable macro data like soft inflation reports than major equity indices. Its correlation with stocks is weakening while its inverse relationship with the US dollar strengthens, indicating a shift in primary drivers towards liquidity factors rather than risk sentiment. On-chain analysis reveals that long-term holder profit-taking has largely dried up, and the wave of capitulation selling from this cohort has peaked and begun to recede. Buyers successfully absorbed selling pressure at the June lows. Bitcoin currently trades between the network's average realized price (a support floor) and the short-term holder cost basis near $69k, which will be a key resistance level. A breakout above this level is needed to signal a more sustained recovery. In derivatives markets, traders are unwinding bearish bets, with put/call ratios falling and crash protection premiums declining. However, this futures and options positioning adjustment has not been accompanied by significant spot buying. US spot ETF outflows have slowed but not reversed. Volatility has compressed to low levels. In summary, the foundations for a bottom are forming: long-term holder selling is subsiding, demand absorbed the recent low, and the market is reacting to positive catalysts. However, confirmation...


By: Glassnode

Compiled by: AididiaoJP, Foresight News


The bottom for Bitcoin is still under construction, but its characteristics are quietly changing. The capitulation selling by long-term holders is starting to cool, buy orders successfully absorbed the June lows, and the price is gradually recovering, challenging the area that previously suppressed it.


Executive Summary


  • The market has begun testing the resistance above.
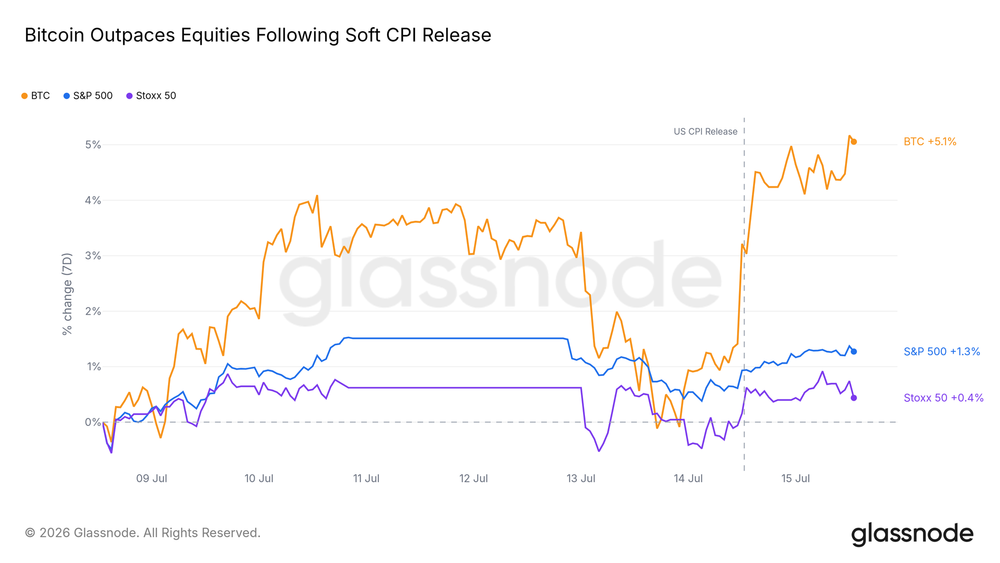
  • Bitcoin's reaction to weak inflation data was much stronger than any major stock index, the most positive response to good news in weeks.
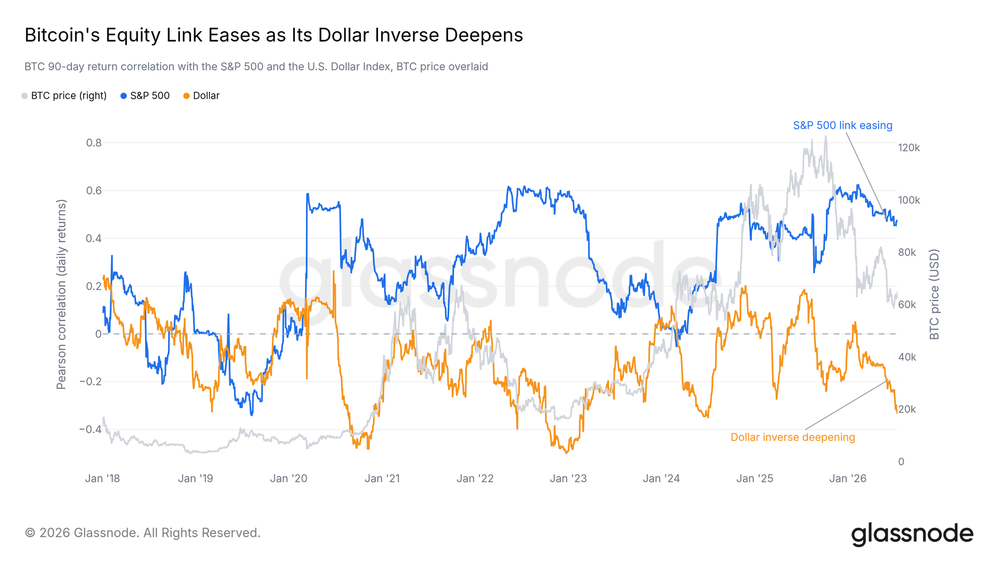
  • Correlation with equities is loosening, while the inverse link with the dollar is deepening – the current driver is liquidity, not risk appetite.
  • Selling by long-term holders – the primary source of selling pressure this year – has retreated from its peak.
  • Profit-taking behavior has decreased significantly. Buy orders have completely absorbed the selling at the June lows, reducing the supply pressure faced by each rally.
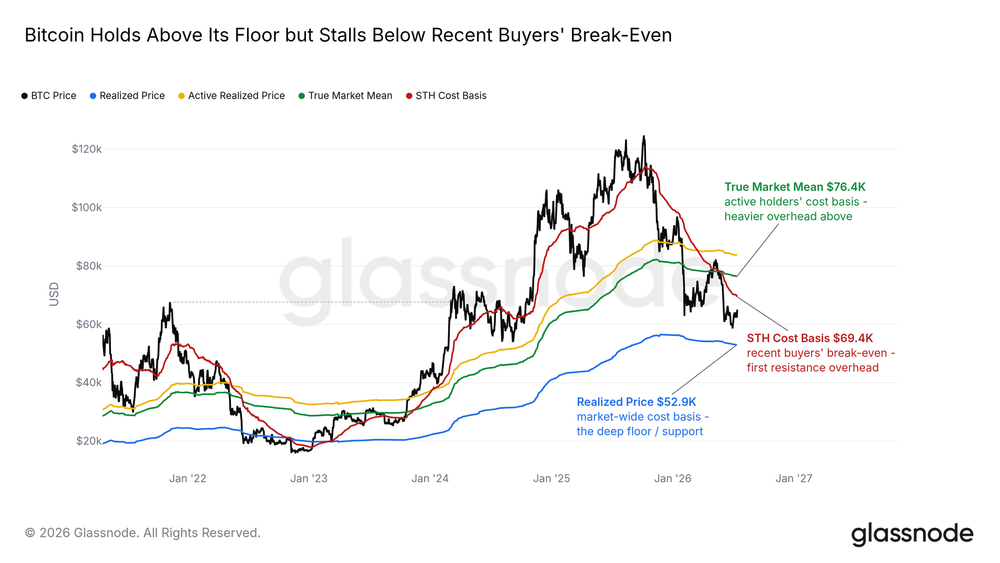
  • The cost basis of short-term holders is near $69,000, the breakeven line for recent buyers, which will be the next significant resistance; a strong reaction is expected there.
  • Derivative traders are unwinding bearish positions, but spot buying has not yet followed, which is the missing link in the current recovery.


Macro Insights


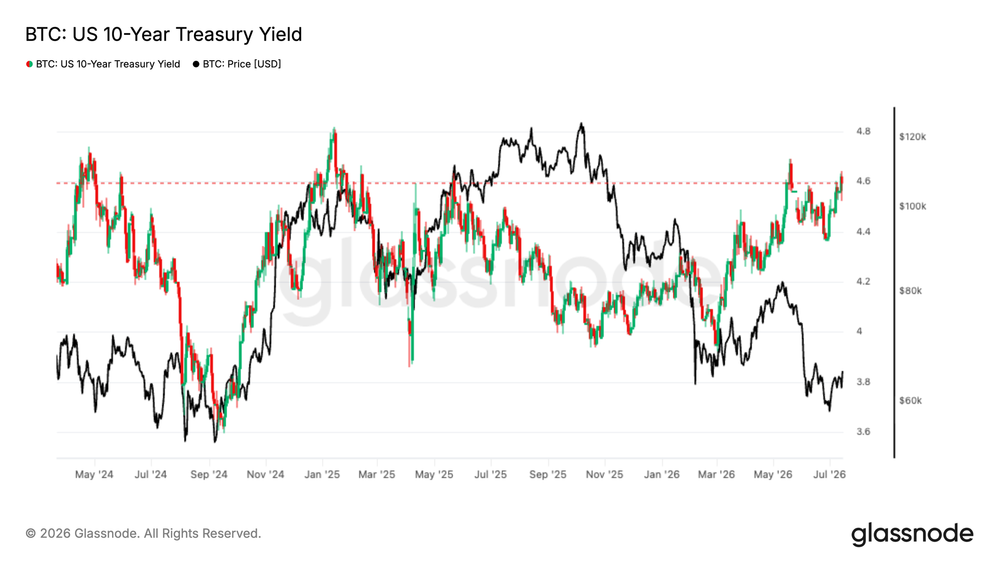
The pressure on Bitcoin this quarter has been essentially a real rate story, not risk-off. The 10-year real yield has risen near its 2026 high of around 2.4%, and the dollar has stayed above its 200-day moving average since May. However, broader risk assets show no stress: equities are near highs, credit spreads are low, and volatility remains modest.


Bitcoin Leads the Rebound


Following Tuesday's soft inflation data, Bitcoin rallied more than any other major asset. It jumped immediately after the data release, significantly outperforming US and European stocks for the week. After a month of sideways movement at lower levels, the market is once again responding positively to good news.


This sensitivity is itself a signal: a market eager to rise on just one inflation report often indicates that sellers are exhausted and buyers are just waiting for a reason.


A Shift in Macro Drivers


Underneath the rebound, Bitcoin's drivers are changing. Since winter, its correlation with US stocks has been weakening, while its inverse relationship with the dollar has been deepening. Bitcoin is acting less like an equity proxy and more like an asset that strengthens when the dollar weakens.


It hasn't detached from the risk asset universe, but the dollar and liquidity channels now exert more influence than stock market sentiment. If the macro environment loosens from here, this channel is most likely to be the first to transmit it.


On-Chain Insights


Between Floor and Ceiling


The cost basis map accurately depicts the current position. The Bitcoin price is above the network-wide average Realized Price – the natural floor support in bear markets; and below the Short-Term Holder cost basis (near $69,000) – the average entry price of buyers over the past five months. The current recovery is climbing towards this breakeven resistance level, with many trapped buyers waiting above.


The first touch of this level is likely to trigger a strong reaction, as the group most inclined to sell is precisely those about to break even. Successfully reclaiming it would open space for the recovery; rejection would confirm the continuation of the range-bound pattern.


Sellers Stop Taking Profits


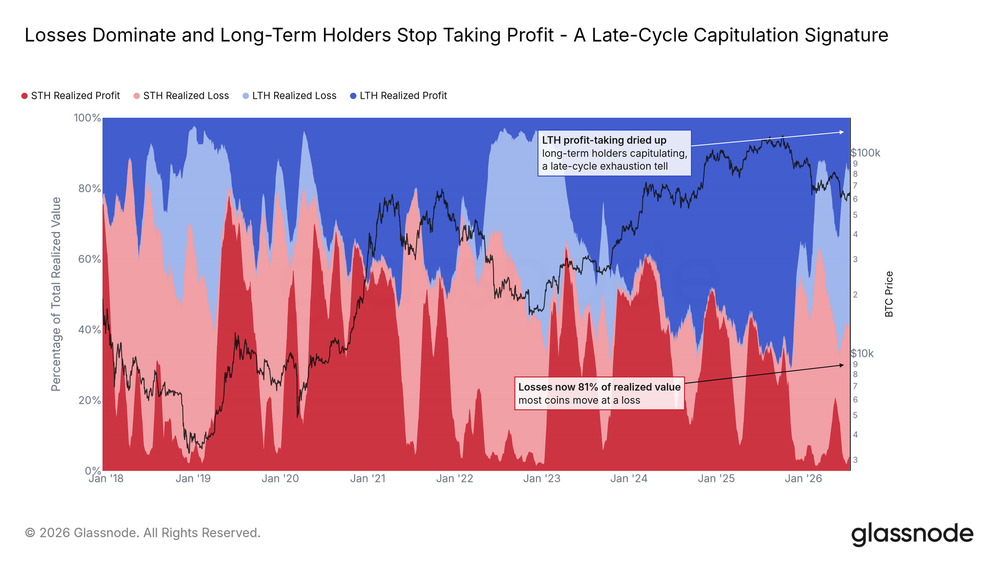
The Long-Term / Short-Term Holder Realized Profit/Loss Relative metric categorizes all on-chain selling into four types: veterans and newcomers, each selling while in profit or loss. For most of this cycle, profit-taking by long-term holders dominated selling. Now this flow has almost completely dried up; the old hands are now selling mostly loss-making positions.


Loss-making sales from both groups constitute the main on-chain transaction characteristic, a typical late-bear-market signal. The key change is that the proportion of selling by long-term holders has stopped growing. The wave of selling pressure that met every rally this year is no longer expanding.


Capitulation Selling Begins to Cool


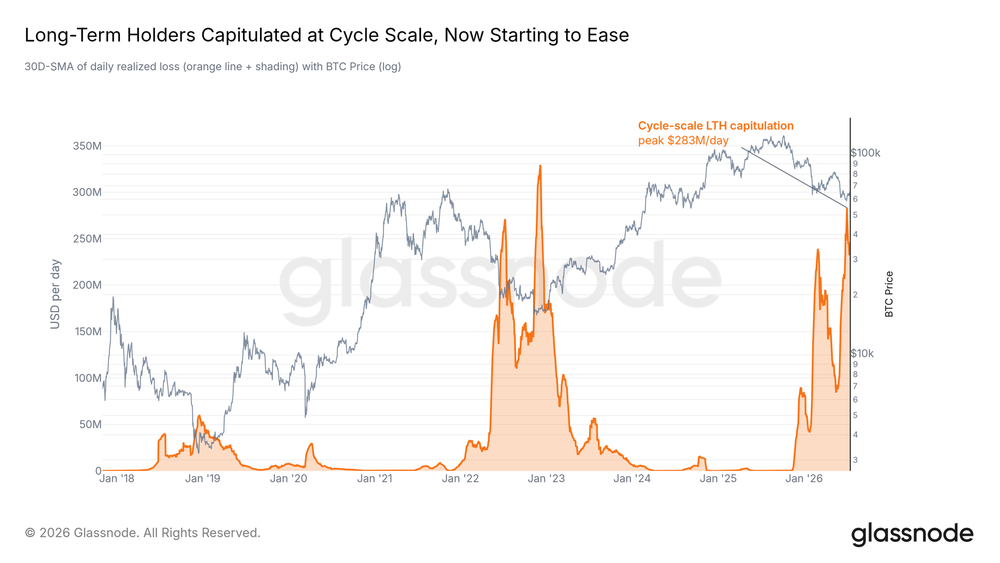
This capitulation pace is the most important current indicator. The Entity-Adjusted Long-Term Holder Realized Loss metric filters out internal transfers, truly reflecting the amount old hands actually give up each day. This metric hit its cycle peak two weeks ago. In last week's report, we clearly stated that the cooling of this indicator is a prerequisite for any lasting recovery.


It has now begun to decline. One pullback doesn't prove complete exhaustion, and new shocks could restart selling. But in this cycle, it's the first time the core indicator defining the bottoming process has turned from rising to falling. The main sellers driving this bear market are drying up at the margin.


Demand Absorbs Low-Point Selling


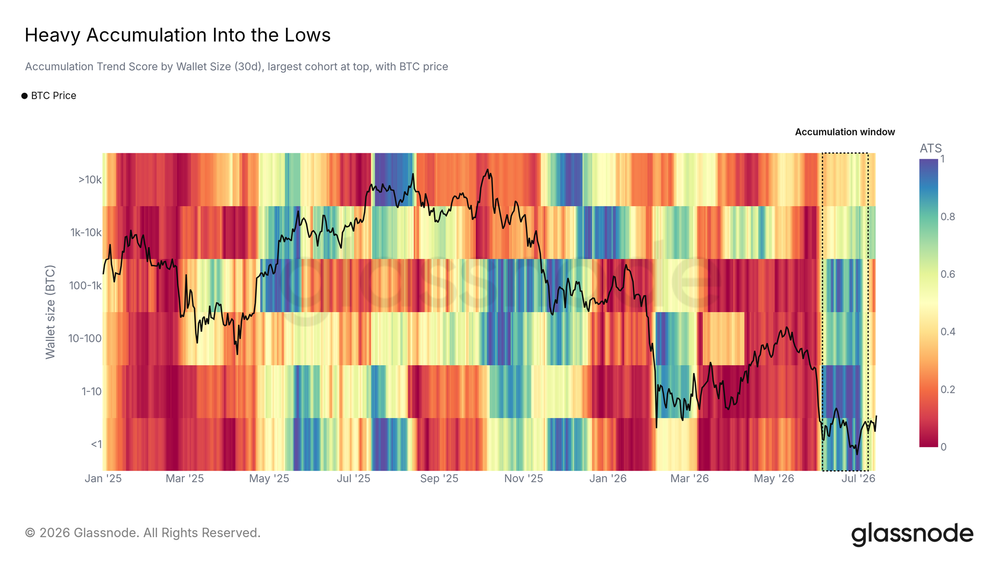
As the old hands capitulated, buyers stepped in promptly. The Accumulation Trend Score by wallet size shows a broad and strong wave of buying during the June lows, covering wallets from small to large. After price stabilization, this intensity weakened, and the market entered a wait-and-see mode.


The coins sold at the lows found takers. Whether these buyers return with equal force in the next move will determine if this bottom can hold.


Off-Chain / Derivatives Insights


ETF Outflows Slow


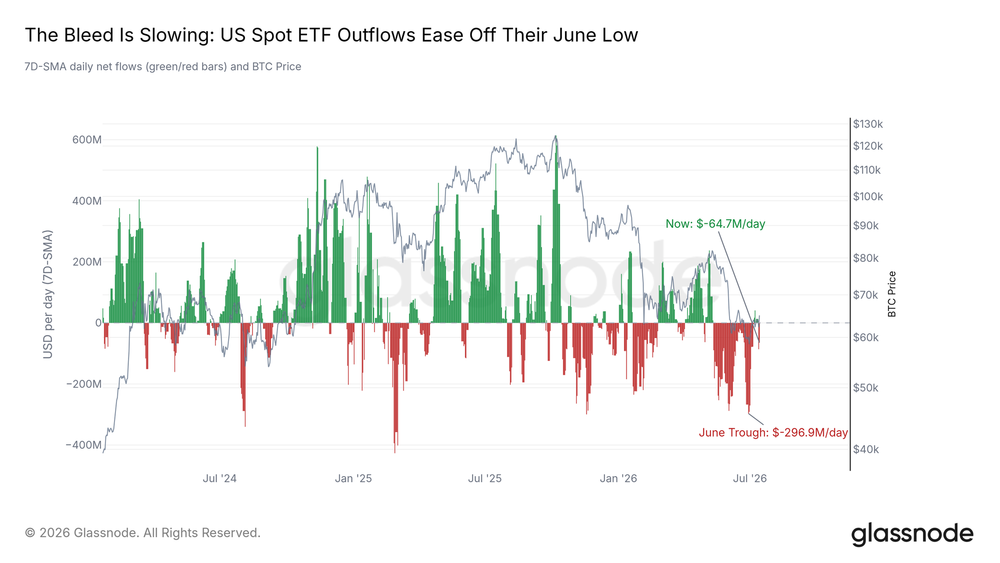
US spot ETFs tell the same story of easing but unresolved pressure. Redemption pressure has retreated significantly from June's extreme levels, trending towards stabilization. However, the channel is not fully repaired: a day this week still saw the largest single-day outflow in weeks, followed by partial recovery the next day.


Until inflows truly return and stabilize, this remains a market where institutions have stopped fleeing but not yet started buying.


Bears Abandon Resistance


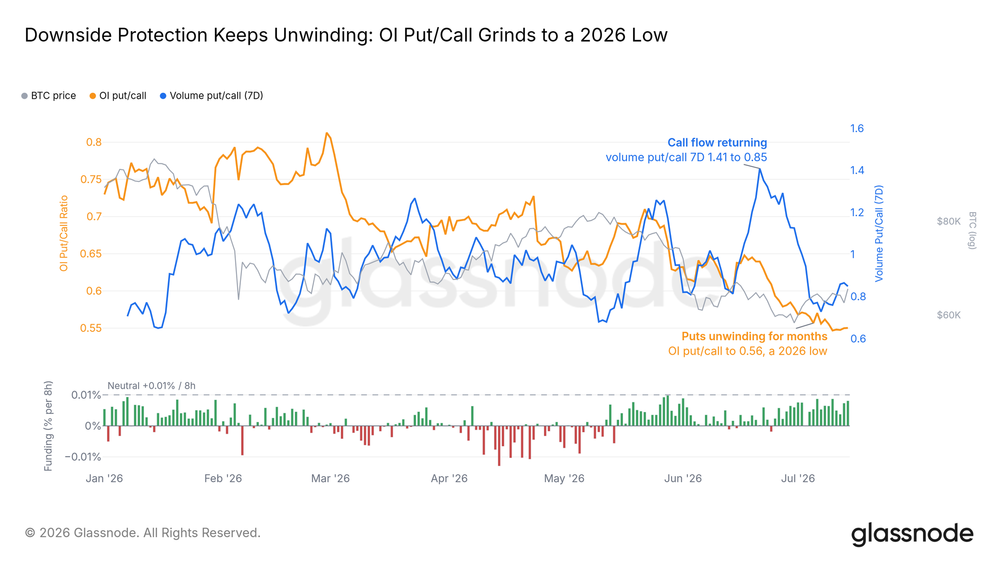
Derivatives markets have been moving in the opposite direction for weeks. The options put/call ratio has dropped to its yearly low, with traders letting bearish protection expire; perpetual funding rates are only slightly above neutral, far from crowded long levels. Bearish bets are quietly and steadily exiting.


But this unwinding hasn't brought actual buying. Position adjustments by futures and options traders are not equivalent to capital entering the spot market, which is the clearest caveat in the current recovery.


Panic Premium Eases


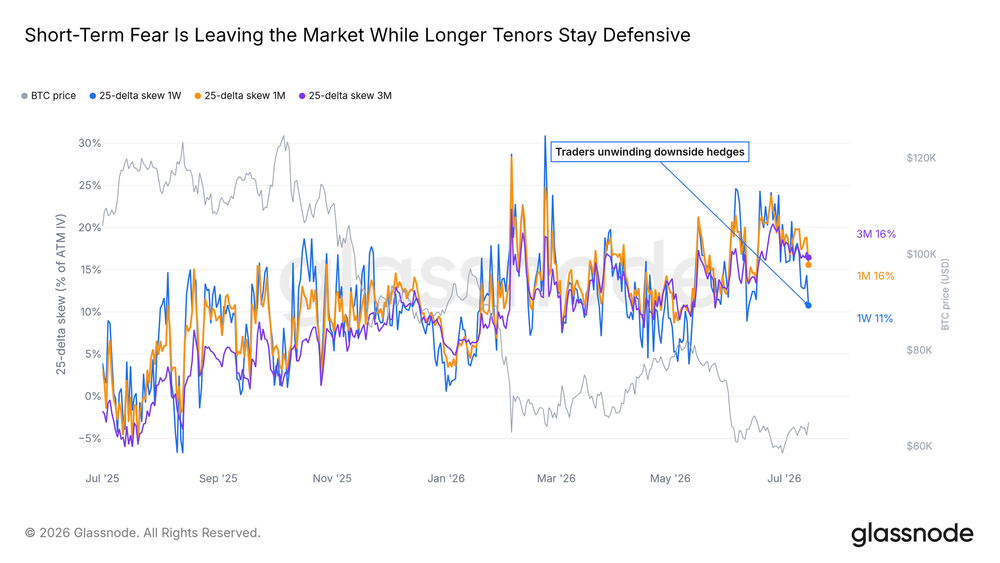
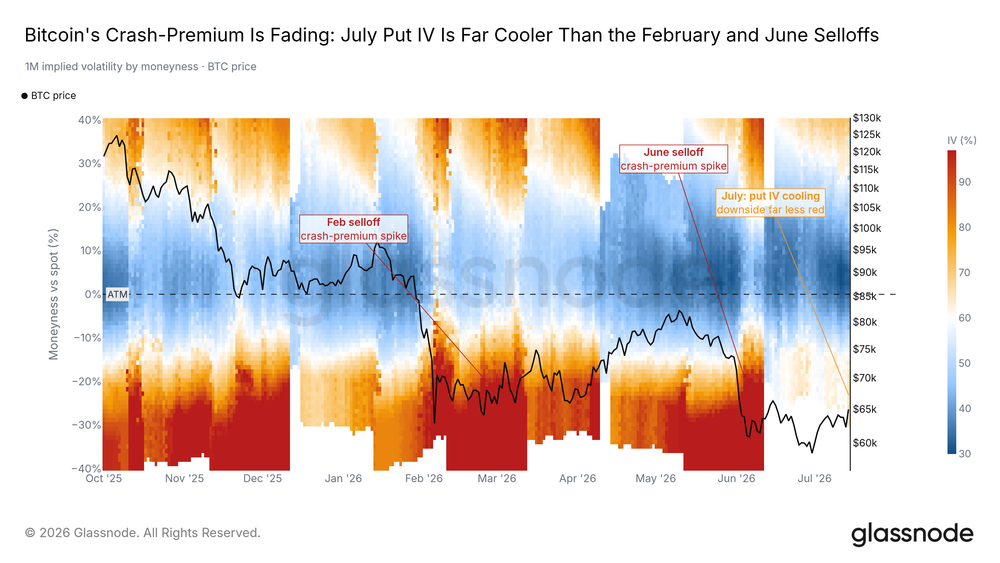
The premium for crash protection in the options market (measured by 25-Delta Skew) surged during the June sell-off and has been declining since, now well below February's extreme levels. The cost of hedging each pullback is significantly lower than a month ago.


Protection demand still exists – as it should when lows are unconfirmed – but the overall direction is normalizing.


Approaching Max Pain


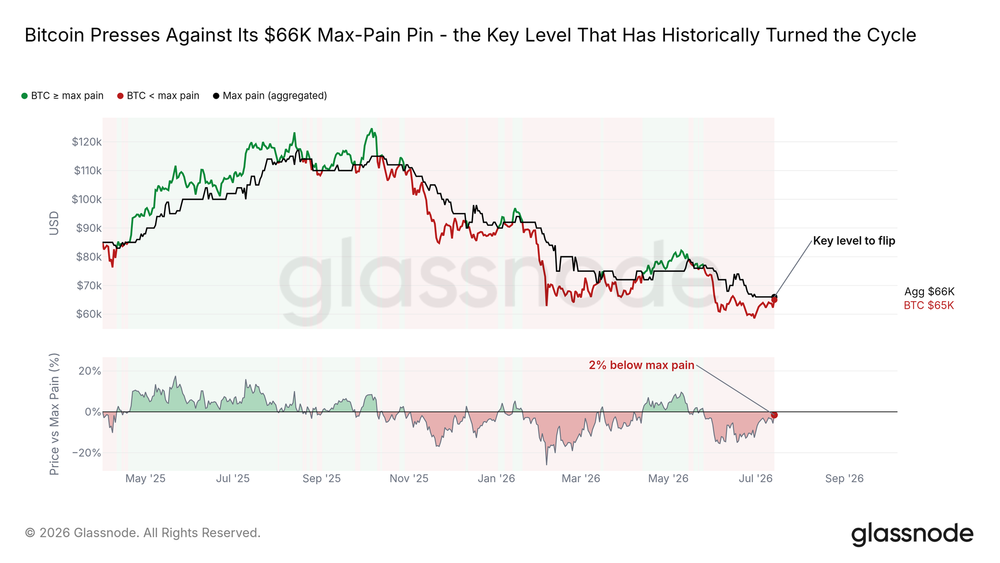
Max Pain is the price at which the largest share of open options expire worthless. The spot price has oscillated around it all year. Bitcoin is currently just below it, challenging it for the first time in weeks.


Historically, reclaiming Max Pain has often coincided with a market turn towards a friendlier environment, though the shift takes time. A clean break above this level would be the first structural signal of an upside breakout from the range; rejection would confirm the cautious sentiment still priced by options markets.


Crash Protection Costs Decline


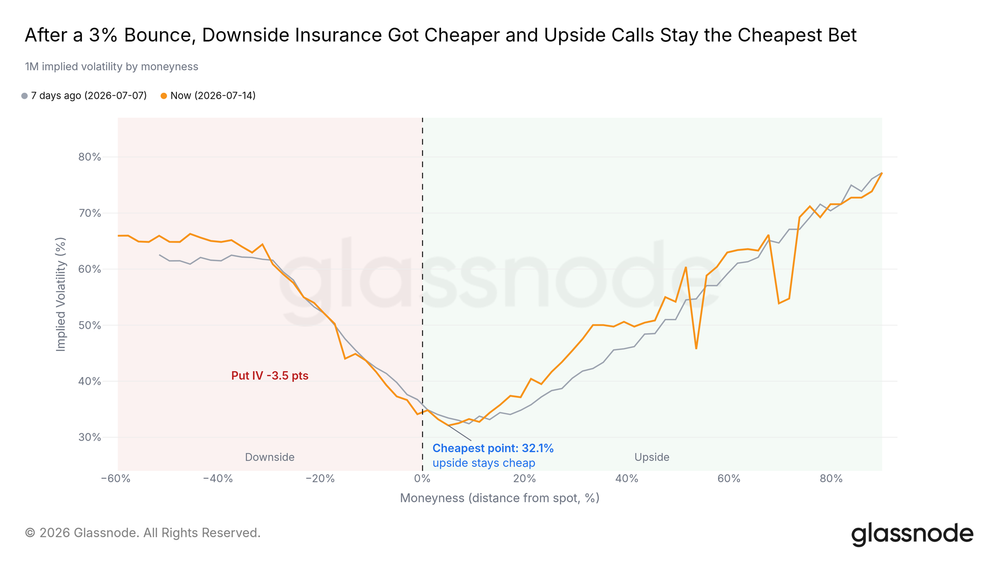
Absolute protection costs also confirm the easing trend. Throughout the recovery, the one-month crash protection price has steadily declined, with hedging demand weakening. The market still pays a premium for the downside, but far lower than at the lows.


Volatility Enters a Calm Period


A longer-term view shows how calm the market has become. The Bitcoin Volatility Index (DVOL) is near yearly lows, and the deep put pressure that erupted in February and June has faded from the volatility surface. Such compression rarely lasts; it is often the backdrop before the next decisive move begins.


Conclusion


The bottom is still under construction, and this week it started responding. Long-term holder capitulation has retreated from its peak, profit-taking has dried up, and the June lows were absorbed by broad buying. Bitcoin reacted more strongly to macro good news than other assets, is approaching Max Pain from below, and is nearing the Short-Term Holder cost base above – which will be the first real test for the recovery.


Confirmation signals are still absent: ETF outflows have slowed but not reversed, derivative unwinding lacks spot follow-through, volatility compression awaits a catalyst. The key signal for a change in judgment is spot-driven buying pushing the price to effectively break and hold above the Short-Term Holder cost basis. If long-term holder losses accelerate again, or if price is pushed back near the Realized Price, the market will return to range-bound action.


The foundation is laid; the follow-through has yet to arrive.

Trending Cryptos

Related Questions

QAccording to the Glassnode article, what are the key changes in selling behavior that signal a potential bottoming process for Bitcoin?

AKey changes include a significant reduction in profit-taking by long-term holders and a cooling-off of capitulation selling from this group. The Long-Term Holder Realized Loss metric, which measures daily amounts effectively surrendered by veteran holders, has peaked and started to decline. While loss-selling remains the dominant on-chain transaction type, the wave of selling pressure that met previous rallies is no longer expanding, indicating a potential exhaustion of the primary sellers driving this bear market.

QWhat is identified as the next major resistance level for Bitcoin's price in the article, and why is it significant?

AThe next major resistance level is the Short-Term Holder Cost Basis, which is close to $69,000. This level is significant because it represents the average entry price of buyers from the past five months, acting as their break-even line. A test of this level is expected to trigger a strong reaction, as this group of recent buyers is most likely to sell to exit their positions at breakeven. A successful reclaim of this level would open up space for further recovery, while rejection would confirm a continuation of the range-bound consolidation phase.

QHow has Bitcoin's macroeconomic driver shifted recently, as described in the text?

ABitcoin's macroeconomic driver has shifted from being primarily correlated with stock market risk sentiment to having a deepening inverse correlation with the US Dollar. The article notes that Bitcoin's correlation with equities has been weakening since winter, while its negative relationship with the Dollar has strengthened. This suggests Bitcoin is behaving less like a proxy for stocks and more like an asset that strengthens when the Dollar weakens, with liquidity channels now having more influence than equity market sentiment.

QWhat is the current state of the US spot Bitcoin ETF market, and what does it indicate about institutional activity?

AThe US spot Bitcoin ETF market shows pressure easing but not resolved. Outflow pressures have significantly decreased from the extreme levels seen in June, trending toward stabilization. However, the channel is not fully repaired, as evidenced by one of the largest single-day outflows in weeks occurring recently, followed by a partial inflow the next day. The market is currently characterized by institutions stopping their exodus but not yet beginning to buy in a sustained way. A true and steady return of inflows is needed for a clearer signal of repair.

QWhat does the article identify as the 'clearest caution flag' for the current market recovery?

AThe 'clearest caution flag' for the current recovery is the lack of actual spot buying accompanying the unwinding of bearish derivative positions. While derivatives traders have been steadily closing their short bets (evident in the lowest put/call ratio of the year and near-neutral funding rates), this positioning adjustment is not equivalent to capital entering the spot market. The recovery is missing this critical component of spot-driven buying pressure.

Related Reads

Gold Rush Handbook | Rialto Teams Up with Robinhood Crypto, Targeting Order Routing Rights

**Summary** Rialto is positioning itself as an on-chain spot exchange focused on order routing and execution quality for a range of assets, including cryptocurrencies and tokenized stocks/ETFs. It operates primarily on the Robinhood Chain network. Its core mechanism revolves around **propAMMs** – on-chain market makers that use proprietary inventory and pricing logic, referencing external markets (like underlying stock exchanges for tokenized equities) rather than relying solely on automated market maker (AMM) formulas. For each user order, Rialto's aggregator solicits real-time quotes from multiple liquidity sources, including its own propAMM (Rivo Altus) and traditional DEX pools. It then selects and atomically executes the path offering the best net output after costs, potentially splitting orders across sources. Rialto's key competitive claim is turning **order routing control into a service for better execution**. Instead of users manually finding the best liquidity, the system automatically compares and routes to the optimal source(s) for each trade. It has launched a partner program for integrations and its swap API is already used by several protocols. Challenges ahead include expanding the asset base on Robinhood Chain, ensuring Rivo Altus's price competitiveness, attracting diverse external liquidity, and consistently delivering superior net execution compared to manual routing. Success in these areas would see Rialto competing for the crucial "order routing right" in the emerging on-chain market for tokenized real-world assets.

Foresight News39m ago

Gold Rush Handbook | Rialto Teams Up with Robinhood Crypto, Targeting Order Routing Rights

Foresight News39m ago

Bitwise: RWA and Prediction Markets Continue to Gain Momentum, Crypto is Bottoming Out

Bitwise's Q2 2026 report highlights a challenging crypto market. The Bitwise 10 Crypto Index fell 15.4%, and spot Bitcoin ETFs saw a record $4.9 billion in quarterly outflows as Bitcoin dropped below $60,000. Overall sentiment is described as one of the worst in eight years. Despite the downturn, key sectors show resilience and growth. Real-World Asset (RWA) tokenization reached a record $33 billion, up 45% year-to-date. Prediction markets also hit new highs, with open interest at $1.8 billion and quarterly volume hitting $43 billion, driven partly by political events. Crypto equities outperformed, with the Bitwise Crypto Innovators 30 Index rising 30.6%, largely fueled by AI-related Bitcoin miners. These stocks exhibited low correlation with other major asset classes. Major DeFi protocols like Aave demonstrated strong revenue generation, with the top ten crypto applications collectively earning $5.9 billion over the past year. The report notes that while prices and on-chain activity are down from peaks, fundamental metrics like stablecoin supply (~$300B) and Ethereum transaction activity are significantly higher than at the 2022 bear market bottom. Key Q3 factors include the fate of the CLARITY Act, final rules for the GENIUS stablecoin act, and policy signals from the new Fed Chair. The conclusion is that the industry is building a stronger foundation—with greater adoption, institutional involvement, and real utility—even at depressed prices, setting the stage for the next cycle.

Odaily星球日报1h ago

Bitwise: RWA and Prediction Markets Continue to Gain Momentum, Crypto is Bottoming Out

Odaily星球日报1h ago

Trading

Spot

Hot Articles

What is $BITCOIN

DIGITAL GOLD ($BITCOIN): A Comprehensive Analysis Introduction to DIGITAL GOLD ($BITCOIN) DIGITAL GOLD ($BITCOIN) is a blockchain-based project operating on the Solana network, which aims to combine the characteristics of traditional precious metals with the innovation of decentralized technologies. While it shares a name with Bitcoin, often referred to as “digital gold” due to its perception as a store of value, DIGITAL GOLD is a separate token designed to create a unique ecosystem within the Web3 landscape. Its goal is to position itself as a viable alternative digital asset, although specifics regarding its applications and functionalities are still developing. What is DIGITAL GOLD ($BITCOIN)? DIGITAL GOLD ($BITCOIN) is a cryptocurrency token explicitly designed for use on the Solana blockchain. In contrast to Bitcoin, which provides a widely recognized value storage role, this token appears to focus on broader applications and characteristics. Notable aspects include: Blockchain Infrastructure: The token is built on the Solana blockchain, known for its capacity to handle high-speed and low-cost transactions. Supply Dynamics: DIGITAL GOLD has a maximum supply capped at 100 quadrillion tokens (100P $BITCOIN), although details regarding its circulating supply are currently undisclosed. Utility: While precise functionalities are not explicitly outlined, there are indications that the token could be utilized for various applications, potentially involving decentralized applications (dApps) or asset tokenization strategies. Who is the Creator of DIGITAL GOLD ($BITCOIN)? At present, the identity of the creators and development team behind DIGITAL GOLD ($BITCOIN) remains unknown. This situation is typical among many innovative projects within the blockchain space, particularly those aligning with decentralized finance and meme coin phenomena. While such anonymity may foster a community-driven culture, it intensifies concerns about governance and accountability. Who are the Investors of DIGITAL GOLD ($BITCOIN)? The available information indicates that DIGITAL GOLD ($BITCOIN) does not have any known institutional backers or prominent venture capital investments. The project seems to operate on a peer-to-peer model focused on community support and adoption rather than traditional funding routes. Its activity and liquidity are primarily situated on decentralized exchanges (DEXs), such as PumpSwap, rather than established centralized trading platforms, further highlighting its grassroots approach. How DIGITAL GOLD ($BITCOIN) Works The operational mechanics of DIGITAL GOLD ($BITCOIN) can be elaborated on based on its blockchain design and network attributes: Consensus Mechanism: By leveraging Solana’s unique proof-of-history (PoH) combined with a proof-of-stake (PoS) model, the project ensures efficient transaction validation contributing to the network's high performance. Tokenomics: While specific deflationary mechanisms have not been extensively detailed, the vast maximum token supply implies that it may cater to microtransactions or niche use cases that are still to be defined. Interoperability: There exists the potential for integration with Solana’s broader ecosystem, including various decentralized finance (DeFi) platforms. However, the details regarding specific integrations remain unspecified. Timeline of Key Events Here is a timeline that highlights significant milestones concerning DIGITAL GOLD ($BITCOIN): 2023: The initial deployment of the token occurs on the Solana blockchain, marked by its contract address. 2024: DIGITAL GOLD gains visibility as it becomes available for trading on decentralized exchanges like PumpSwap, allowing users to trade it against SOL. 2025: The project witnesses sporadic trading activity and potential interest in community-led engagements, although no noteworthy partnerships or technical advancements have been documented as of yet. Critical Analysis Strengths Scalability: The underlying Solana infrastructure supports high transaction volumes, which could enhance the utility of $BITCOIN in various transaction scenarios. Accessibility: The potential low trading price per token could attract retail investors, facilitating wider participation due to fractional ownership opportunities. Risks Lack of Transparency: The absence of publicly known backers, developers, or an audit process may yield skepticism regarding the project's sustainability and trustworthiness. Market Volatility: The trading activity is heavily reliant on speculative behavior, which can result in significant price volatility and uncertainty for investors. Conclusion DIGITAL GOLD ($BITCOIN) emerges as an intriguing yet ambiguous project within the rapidly evolving Solana ecosystem. While it attempts to leverage the “digital gold” narrative, its departure from Bitcoin's established role as a store of value underscores the need for a clearer differentiation of its intended utility and governance structure. Future acceptance and adoption will likely depend on addressing the current opacity and defining its operational and economic strategies more explicitly. Note: This report encompasses synthesised information available as of October 2023, and developments may have transpired beyond the research period.

830 Total ViewsPublished 2025.05.13Updated 2025.05.13

What is $BITCOIN

Discussions

Welcome to the HTX Community. Here, you can stay informed about the latest platform developments and gain access to professional market insights. Users' opinions on the price of BTC (BTC) are presented below.

活动图片