A year 'eats' a 1TB SSD?
OpenAI's flagship programming tool, Codex, is burning through your solid-state drive with 640TB of writes per year.
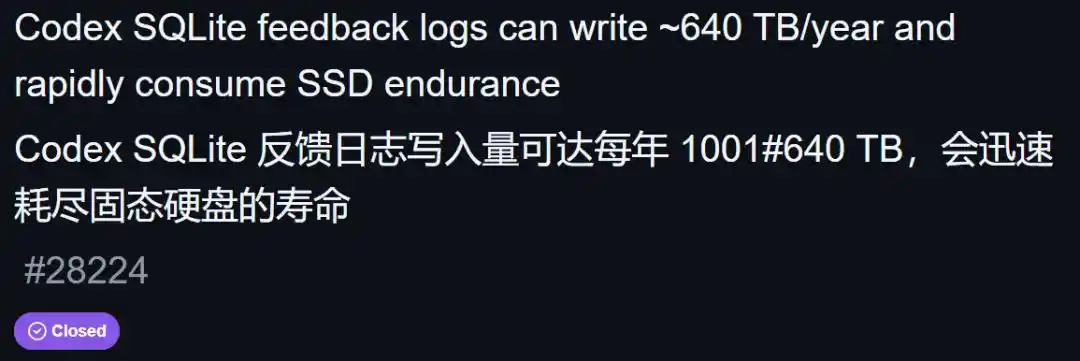
Not long ago, a developer submitted an issue on GitHub. This now-closed GitHub issue, #28224, bears the title:
Codex's SQLite feedback log writes 640TB/year, rapidly depleting SSD lifespan.
According to the reporter's actual measurements, his primary SSD lost 37TB of write endurance after 21 days of continuous operation. At this rate, it's about 640TB per year—enough to wear out a consumer-grade drive with a 600 TBW (Total Bytes Written) rating.
As evidence, he posted two tables.
In evidence 1, the log database always appears to be only 1.2GB, seemingly like nothing happened; yet its auto-incrementing row ID has surged to 5.5 billion, while the actual retained rows are just over 500,000, a difference of ten thousand times.
The key is that SSD wear counts the total amount written, not what remains now: all those 5.5 billion rows were written to disk, and deleting them doesn't undo the writes already incurred. So you only ever see those 500,000 rows when checking the file, but the drive has already endured the write load of 5.5 billion rows.
Evidence 2 reveals the distribution of these 5.5 billion rows: over 90% are debug noise that even the developers themselves wouldn't look back at. Simply copying down each entire WebSocket data packet accounted for half of it.
The culprit is a default configuration of Level::TRACE, treating your drive's write endurance as free scratch paper.
A highly upvoted comment on Hacker News directly defined the nature of this issue:
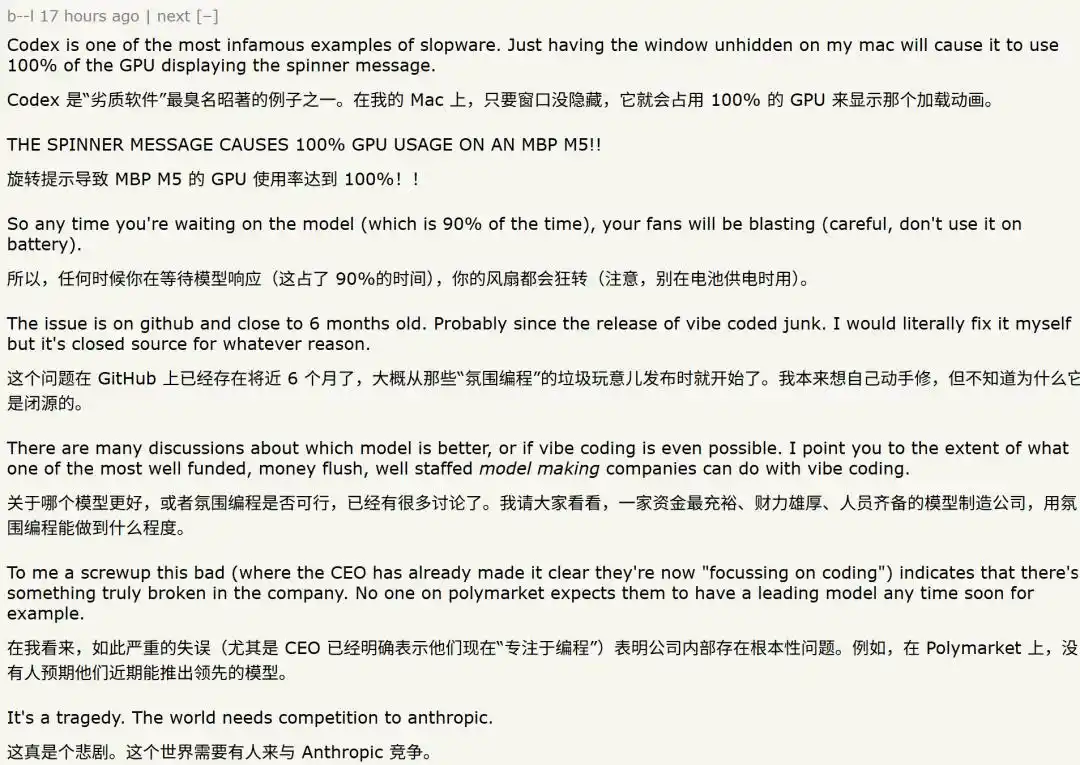
This is one of the most egregious examples of "slopware."
This netizen also helplessly added:
This is a tragedy. The world needs someone to compete with Anthropic.
What's even more awkward is that this problem wasn't unreported.
Sporadic feedback has existed since April this year, dragging on for over two months. Only after users calculated it themselves, wrote reports, and pushed it to the top of Hacker News did it receive serious attention. Even then, this round only cut about 85% of the log writes.
Some tried to fix it themselves but found they couldn't: the desktop versions of these tools are closed-source.
There was also a classic comment in the thread: How did the review process not catch such an obvious bug? Oh right... @codex, review this.
How exactly did the 640TB get written?
What does 640TB mean?
Mainstream consumer SSDs have a rated write endurance of roughly 150 to 600 TBW, enough for the average user for over a decade or two.
Yet Codex's "record what I did" logging feature can write that much in a year.
The story begins when this user checked his drive usage. His machine, running continuously for 21 days, saw his primary SSD endure 37TB of writes.
At this speed, it's about 640TB per year.
What's more absurd is the write pattern.
Codex maintains a local SQLite database, logs_2.sqlite, specifically for feedback logs. This user monitored it for 15 seconds—36,211 rows were inserted, while the total retained row count remained 681,774 from start to finish, not a single one more.
For every row inserted, one was deleted. The row count stayed constant, but the disk was being rewritten tens of thousands of times.
This mechanism has a nickname: insert-and-prune.
Even more ridiculous is what it records: a bunch of filesystem inotify events.
ld.so.cache was logged 128,764 times, locale.alias 37,982 times, passwd 23,843 times.
The same file, by the same program, logged hundreds of thousands of times repeatedly.
The auto-incrementing ID in the logs had exceeded 5.5 billion, while only about 500,000 rows were retained.
A difference of ten thousand times.
This isn't a bug; it's more like an AI programming tool chanting to its own hard drive.
The file is only 1GB, but writes amount to 640TB
If it writes and deletes simultaneously, how big can logs_2.sqlite remain? About 1GB.
This leads to the most counterintuitive point of the whole affair: SSD lifespan depends on "write amount," not "file size." A 1GB file rewritten 640 times equals 640TB of writes for the drive.
SQLite uses a WAL (Write-Ahead Logging) mechanism. Changes are first written to a -wal file, then checkpointed back to the main database in batches. Codex performs over thirty thousand inserts and deletions every 15 seconds. Each one goes through WAL, index updates, and checkpoints—the same storage area, erased over and over.
An analogy: a 1GB notebook, where you erase and rewrite it 1,750 times a day for a year. The notebook is the same, but the paper is worn through.
This is also why this bug could remain hidden for so long: it doesn't take up space, only burns through lifespan.
Checking available disk space shows nothing unusual; the file size stays quiet. Only by reading the drive's own SMART health counters can you see the write amount silently accumulating.
Root cause: an ignored RUST_LOG line
Why were so many logs recorded?
The answer lies in a single line of configuration in the Codex source code: the SQLite feedback log sink is initialized with Targets::new().with_default(Level::TRACE).
In short, the log is set to TRACE level by default—the highest, most verbose, record-everything level.
Codex's logging framework is Rust's `tracing` ecosystem. The standard practice is to read the RUST_LOG environment variable. Users certainly tried setting RUST_LOG to info, warn, or even turning it off entirely.
No use.
with_default(Level::TRACE) hard-locks the global default to TRACE. RUST_LOG simply doesn't take effect on this path. You think you turned off logging, but it writes regardless.
The most deceptive part of this bug isn't that "you forgot to configure," but that "you configured, and it pretended not to hear."
Even more glaring is a proportion.
Breaking down the retained logs by category, TRACE accounts for 70.7%, about 732.5 MB. Adding the two mirrored telemetry logs from codex_otel (log_only and trace_safe) takes up another 25.3%.

70% of writes are TRACE noise. Combined with mirrored telemetry, 96% is pure nonsense nobody would read.
Only 4% is actually meaningful content.
This isn't the first one; at least the ninth
The reporter checked the Codex repository and found at least 9 issues of this "unbounded log growth" type.
#17320: WAL writes wildly during streaming responses, root cause identical to this one—TRACE ignoring RUST_LOG.
#24275: Desktop version logs_2.sqlite explodes.
#22444: WAL grows infinitely and doesn't free up space.
#26374: Writes 0.75GB per day, no rotation.
#27911: A 4KB goals_1.sqlite gets written at 11MB/s.
#20563: Disk writes wildly even when process is idle.
#27020: Disk at 100% activity on Windows.
The earliest trace leads back to #12969, the very PR that connected the SQLite feedback log sink at the TRACE level.
A 4KB database being written at 11MB/s is enough for a standalone article. Yet, both it and the 640TB issue are symptoms of the same product, the same telemetry system.
This shows that from the beginning, Codex's logging and telemetry systems lacked the concept of a "resource budget."
The entire field is competing over token budgets, context lengths, and model capabilities.
But almost no one asks: who manages the disk, memory, and CPU budget for an Agent that resides on a user's machine, running 24/7?
Fixed, but in a very OpenAI way
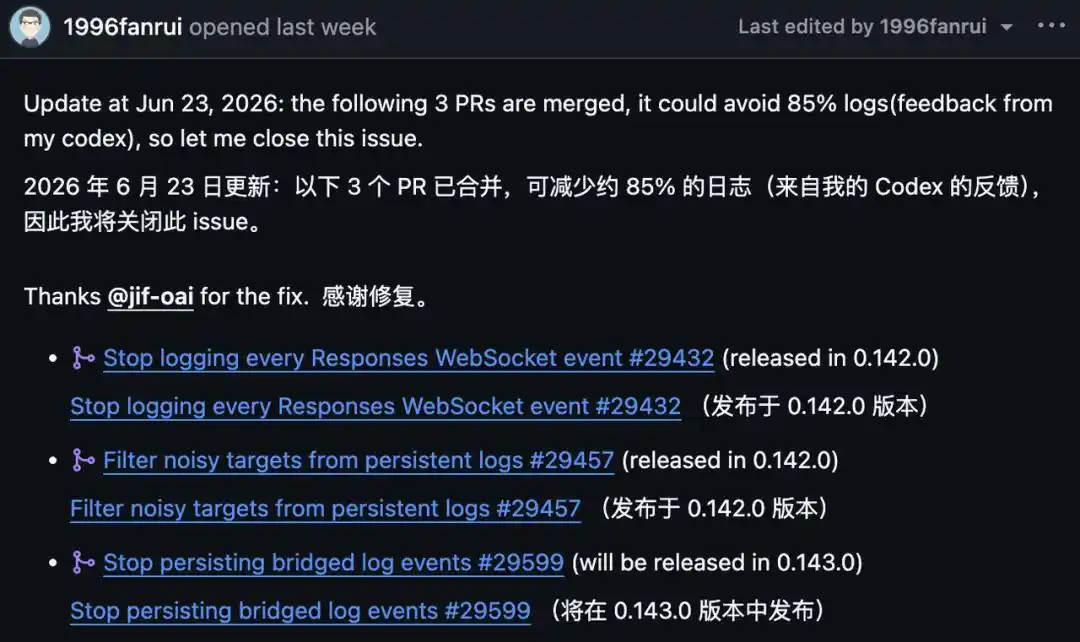
Reported on GitHub on June 14th. On June 23rd, the reporter updated: three PRs merged. According to his own Codex feedback, they reduced logs by about 85%, so he closed the issue.
First, about that 85%—it's not 100%, and it's not fully deployed yet.
Of the three fixes, #29432 and #29457 were released with version 0.142.0, cutting out per-WebSocket logging and noisy targets. The third, #29599, stops another type of bridged redundant log and will be in version 0.143.0.
Even with all three in place, the remaining ~15% still amounts to ~96TB of writes per year, merely reducing it from "burning out a drive in a year" to "burning it out in six years."
Some defended it: trace logs are stored by design for debugging, not a bug, and indeed help OpenAI track down edge cases.
But that's precisely the issue: using paying users' SSD endurance as free storage for the vendor's debugging—did the users ever agree to this?
In the programming battlefield, more than just SSDs are being burned through
Interestingly, Codex wasn't the only one singled out.
Comments quickly added: Claude Code also writes debug logs heavily to local storage. Some had to symlink the log directory to a RAM disk (tmpfs) to extend their SSD's life.
Both flagship products suffer from the same type of flaw.
Community discussion soon expanded from one bug to the broader quality issues of AI programming tools.
Some complained these agents keep the GPU maxed out and memory usage at 70GB+. Others simply coined a name for this generation of software: slopware.
The original developer's suggestion was simple: set a limit for the app, don't exceed 3GB. Just this one line took Codex 9 issues and several months to finally consider drawing.
The question is: why would a company that constantly talks about "AGI" stumble on a problem even an intern could spot?
Why could this flaw hide for so long? One comment also hit the nail on the head.
A decade ago, setting logs to TRACE would cause the program to freeze instantly, fixed the same day. Today, CPUs are fast enough, memory large enough, disks robust enough that such flaws are quietly absorbed by hardware performance. The program runs, the interface works, users feel nothing—until the SSD dies prematurely one day.
In recent years, software has been stuffed with AI-generated code. Features pile up, abstraction layers thicken, and resource consumption skyrockets, all barely propped up by hardware makers releasing faster chips every year.
Thus, an absurd cycle emerged: software gets worse, hardware gets more powerful. Users pay for new machines under the illusion that "it doesn't seem slower," when in reality, the new hardware is just barely supporting worse software.
A single small bug can't crush OpenAI, of course. But competition between Codex and Claude Code has already spread from model capabilities to the entry point of developers' workflows.
On this front, making quick changes and responding to developer needs was never a bonus—it's just the entry ticket.
References:
https://github.com/openai/codex/issues/28224
https://news.ycombinator.com/item?id=48626930
This article is from the WeChat public account "New Zhiyuan," author: ASI Revelation