BTC Market Pulse: Week 23

insights.glassnode发布于2026-06-02更新于2026-06-02

文章摘要

Bitcoin is sending cautionary signals across all market layers this week. On-chain, transfer volume and fees increased, but capital inflows have nearly stopped with realized cap growth collapsing to near-zero, indicating no fresh money is entering. Active addresses remain flat. Spot markets show sellers in control, with the CVD flipping deeply negative and momentum declining. Volume is being used for selling, not accumulation. Derivatives reflect unease: futures open interest is flat but the cost to hold longs jumped, and perpetual CVD deepened negative. Options open interest dropped and skew decreased, though volatility expectations remain elevated. ETF flows turned strongly bearish, with net outflows nearly doubling to $1.3B as institutions reduced exposure urgently. Profitability metrics deteriorated: only 59.8% of supply is in profit, realized losses dominate on-chain activity, and net unrealized losses deepened. In summary, Bitcoin is in a distribution/consolidation phase. On-chain activity is structurally healthy, but capital inflows have stalled, spot selling pressure is building, and institutional money is exiting via ETFs at an accelerating pace. The path of least resistance remains sideways-to-lower until realized cap growth resumes and spot CVD turns positive.

Bitcoin is sending a clear cautionary signal across every major market layer this week.

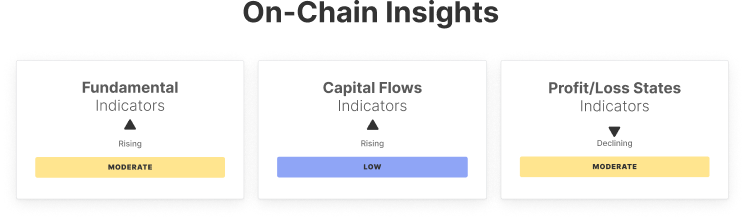
On-chain, the network is quietly busy. Transfer volume surged 31% to $4.6B and fee revenue climbed 17%, but the capital doing that work is rotating, not accumulating. The monthly realized cap change has collapsed 57% to near-zero, meaning fresh money has almost stopped entering the ecosystem. Active addresses are flat at ~607K. The machine is running, but nobody's refuelling it.

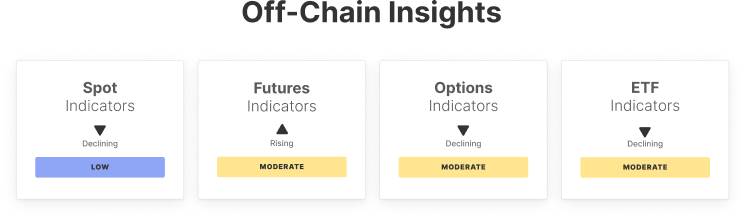
Spot markets confirm the mood shift. The CVD flipped deeply negative, swinging 143% from +$16M to $6.9M. Buyers have stepped back and sellers are in control of price discovery. Momentum dropped to 29.9 and is trending lower. Volume rose 8%, but that volume is being used to sell, not accumulate.

Derivatives are pricing in the unease. Futures open interest is essentially flat at $36.7B, but the cost of holding longs jumped 26%, meaning bulls are paying a premium to stay in a market that's moving against them. Perpetual CVD deepened another 26% negative. In options, total open interest dropped $2.3B and the 25-delta skew fell from ~15% to ~12%. Put demand is easing but the volatility spread remains elevated at 24%, suggesting traders expect price swings even as they hedge less aggressively.

ETF flows are the most bearish data point of the week. Net outflows nearly doubled to $1.3B while trading volume surged 78% to $10.9B. Institutions aren't just reducing exposure, they're doing it urgently and at scale. ETF MVRV sits at 1.25, meaning the average ETF holder is barely above water.

Profitability metrics tell the story plainly: only 59.8% of supply is in profit (down from 61.5%), the realized profit/loss ratio hit -0.9 (losses dominating realized on-chain activity), and net unrealized losses deepened to -4.1%. The market is not in panic, but the majority of recent buyers are underwater and capitulating slowly.

Bottom line: Bitcoin is in a distribution/consolidation phase with deteriorating breadth. On-chain activity is healthy structurally, but capital inflows have stalled, spot selling pressure is building, and institutional money is leaving via ETFs at an accelerating pace. Until realized cap growth resumes and spot CVD turns positive, the path of least resistance is sideways-to-lower.


🔗 Access the full report in PDF

Don't miss it!

Smart market intelligence, straight to your inbox.

Subscribe now
  • Follow us and reach out on X
  • Join our Telegram channel
  • For on-chain metrics, dashboards, and alerts, visit Glassnode Studio

Disclaimer: This report does not provide any investment advice. All data is provided for information and educational purposes only. No investment decision shall be based on the information provided here and you are solely responsible for your own investment decisions.

Exchange balances presented are derived from Glassnode’s comprehensive database of address labels, which are amassed through both officially published exchange information and proprietary clustering algorithms. While we strive to ensure the utmost accuracy in representing exchange balances, it is important to note that these figures might not always encapsulate the entirety of an exchange’s reserves, particularly when exchanges refrain from disclosing their official addresses. We urge users to exercise caution and discretion when utilizing these metrics. Glassnode shall not be held responsible for any discrepancies or potential inaccuracies.

Please read our Transparency Notice when using exchange data.

相关问答

QWhat is the overall signal Bitcoin is sending across market layers this week according to the report?

ABitcoin is sending a clear cautionary signal across every major market layer. The market is in a distribution/consolidation phase with deteriorating breadth, characterized by stalled capital inflows, building spot selling pressure, and accelerating institutional outflows via ETFs.

QWhat does the collapse of the monthly realized cap change to near-zero indicate about the Bitcoin ecosystem?

AThe collapse of the monthly realized cap change by 57% to near-zero indicates that fresh money has almost completely stopped entering the Bitcoin ecosystem. The network's capital is rotating, not accumulating.

QHow did ETF flows perform, and what does this signify for institutional sentiment?

AETF flows were the most bearish data point of the week. Net outflows nearly doubled to $1.3B while trading volume surged 78% to $10.9B. This signifies that institutions aren't just reducing exposure; they are doing so urgently and at scale.

QWhat is the current state of profitability for Bitcoin holders based on the report's metrics?

AProfitability metrics show a deterioration. Only 59.8% of the supply is in profit, the realized profit/loss ratio is negative at -0.9 (losses dominate), and net unrealized losses deepened to -4.1%. This means the majority of recent buyers are underwater and capitulating slowly.

QWhat condition does the report suggest is necessary for the market's path of least resistance to change from sideways-to-lower?

AThe report suggests that for the market's path of least resistance to change from sideways-to-lower, realized cap growth must resume and the spot Cumulative Volume Delta (CVD) must turn positive.

你可能也喜欢

SaaS 大逃杀:活下来的赢家,都有一个共同点

微软Build大会宣告AI进入“员工时代”,与此同时,SaaS行业正经历一场“大逃杀”。市场担忧AI将取代人力,从而冲击按人头收费的传统SaaS模式。近期,部分公司股价强势反弹,揭示了市场的分化逻辑。 **核心分化点在于收费模式:** * **“消耗型”平台成赢家:** Snowflake(按数据处理量收费)、Datadog(按监控用量收费)等公司因AI创造更多工作负载而直接受益,用量驱动收入增长,股价表现亮眼。 * **“席位型”公司承压分化:** 以Salesforce、Intuit为代表,传统按人头/按任务收费的模式面临直接压力。尽管Salesforce积极向“按用量”模式(Flex Credits)转型且AI收入快速增长,但市场仍担忧其传统业务拖累转型速度。Intuit等公司则因产品易被AI替代而面临更大挑战。 **微软Build大会传递关键信号:** AI智能体正深度集成进操作系统(如Office Copilot默认Agent模式),微软也在加强自研AI能力以降低对OpenAI的依赖。同时,其获得的大额政府合同表明,在大型客户中,其平台席位模式依然稳固。 **未来观察重点:** 1. 市场反弹会否从“消耗型”平台扩散至能证明“AI提升单席位价值”的传统SaaS公司。 2. Salesforce的Flex Credits与AI平台Agentforce的增长能否持续加速,这是转型成功与否的关键样本。 3. 微软Copilot等AI智能体在企业中的实际采用数据,将验证其究竟是创造了新收入,还是替代了原有席位。 总结:SaaS行业的恐慌顶点已过,市场进入精细甄别阶段。能否从“按人头收费”成功转向“按AI创造的价值/用量收费”,或本身成为AI workload的承载平台,是决定公司能否在“AI时代”生存并胜出的分界线。

marsbit23分钟前

SaaS 大逃杀:活下来的赢家,都有一个共同点

marsbit23分钟前

交易

现货
合约

热门文章

加密市场宏观研报:《GENIUS Act》法案取得重大进展,BTC突破历史新高,后市全新展望

2025年5月22日,比特币价格正式突破11万美元大关,创下历史新高。在政策面、宏观经济、资金面与投资者结构共同作用下,一场结构性牛市浪潮正在展开。而此轮上涨背后的核心驱动,是美国《GENIUS稳定币法案》的实质性进展以及多项利好的叠加。本文将从政策端突破、宏观环境转向、链上与ETF资金结构、交易行为演化,以及重点受益赛道五大维度,全面解析此轮BTC再创新高的深层逻辑,并前瞻下半年市场的潜在趋势。

1.6k人学过发布于 2025.05.22更新于 2025.05.22

加密市场宏观研报:《GENIUS Act》法案取得重大进展,BTC突破历史新高,后市全新展望

相关讨论

欢迎来到HTX社区。在这里,您可以了解最新的平台发展动态并获得专业的市场意见。以下是用户对BTC(BTC)币价的意见。

活动图片