This Week's Core: Has Bitcoin's daily structure weakened? Can the short-term rebound effectively break through the upper boundary of the descending channel? Has the HYPE's seven-segment rise reached its end? The following sections analyze the current market structure from multiple timeframes, systematically sort out the current market pattern, and formulate this week's medium- and short-term trading strategies for reference.
Summary of This Week's Core Trading Views:
• Analysis of BTC's multi-timeframe trend structure. (Detailed in Part 1)
• BTC's market outlook and medium/short-term trading strategies for this week. (Detailed in Part 2)
• Analysis of HYPE's hourly chart structure. (Detailed in Part 3)
• HYPE's market outlook and short-term trading strategies for this week. (Detailed in Part 4)
Market Validation of Last Week's Trading Strategies and Core Views:
• Effectiveness of BTC short-term trades: Bitcoin completed one short-term short trade last week (1x leverage), achieving a profit of approximately 5.07%. (Detailed in Table 1)
• Market validation of BTC trend forecast: Last week's article pointed out that Bitcoin was continuing its adjustment pattern with a volatile downtrend, with the short-term strategy focusing on "selling on rallies." The current market movement has validated our previous forecast.
一、Analysis of Bitcoin's Multi-Timeframe Trend Structure
1、BTC Daily Chart Structure Analysis
Bitcoin _ Daily Candlestick Chart:
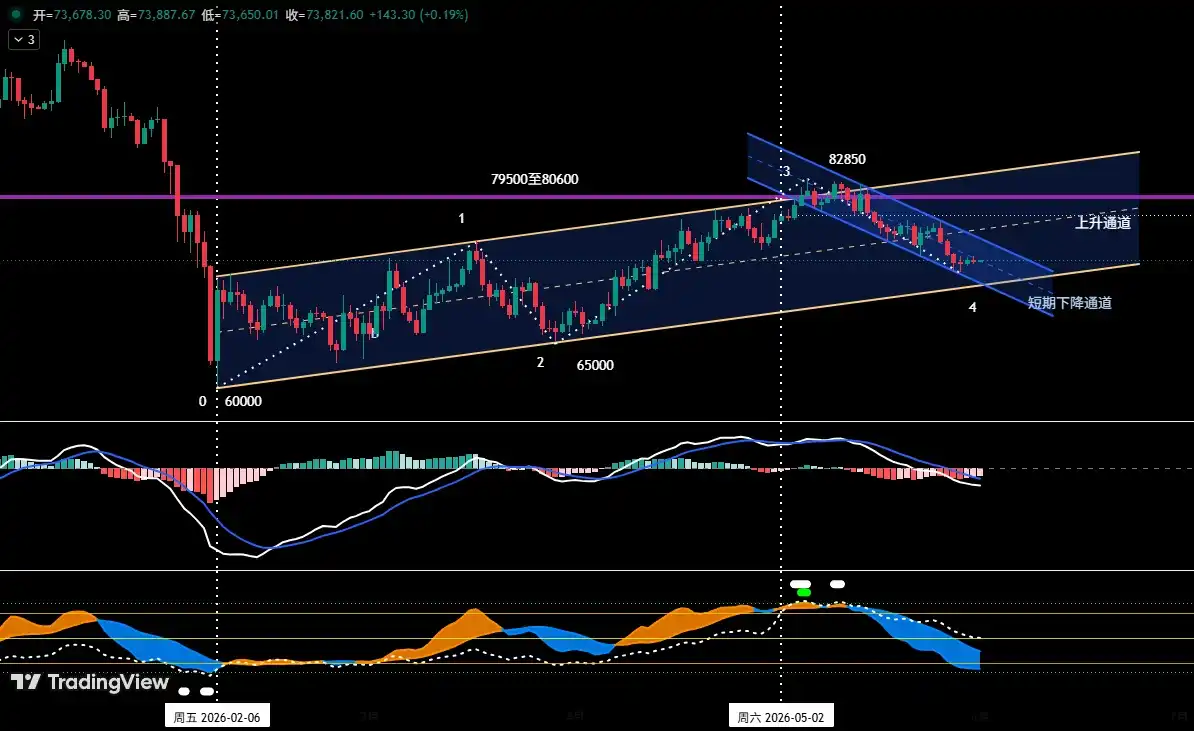
Figure 1
• Ascending Channel (Yellow): As shown in (Figure 1), since the low on February 6, 2026, Bitcoin has maintained a volatile uptrend within an ascending channel. (Lower boundary: connecting the lows of Feb 6 and Mar 29; Upper boundary: a line drawn parallel to the lower boundary through the high of Mar 17)
• Short-Term Descending Channel (Blue): After touching the high of $82,850 on May 6, Bitcoin has been operating within a short-term descending channel. (Upper boundary: connecting the two rebound highs on May 14 and May 26; Lower boundary: connecting the two adjustment lows on May 7 and May 23)
• Based on the Ascending Channel (Yellow), the price has broken below the channel's median line and is seeking stronger support near the lower boundary.
• Based on the Short-Term Descending Channel (Blue), the price found brief support after falling to the channel's lower boundary (around $72,500) and is currently in a period of weak rebound towards the channel's upper boundary.
Comprehensive Judgment: Technically, Bitcoin is facing dual influences from both long-term and short-term channels. The current rebound is mainly a correction for short-term oversold conditions, targeting the upper boundary of the short-term descending channel (Blue). However, as the price has broken below the median line of the ascending channel (Yellow), the overall technical structure has weakened. It is expected that after the rebound ends, the price will likely resume the previous downtrend and further test the support strength of the ascending channel's lower boundary.
2、In-Depth Analysis of BTC's Hourly Chart Structure: (Using the 4-hour chart as the analysis period)
Bitcoin _ 4-Hour Candlestick Chart
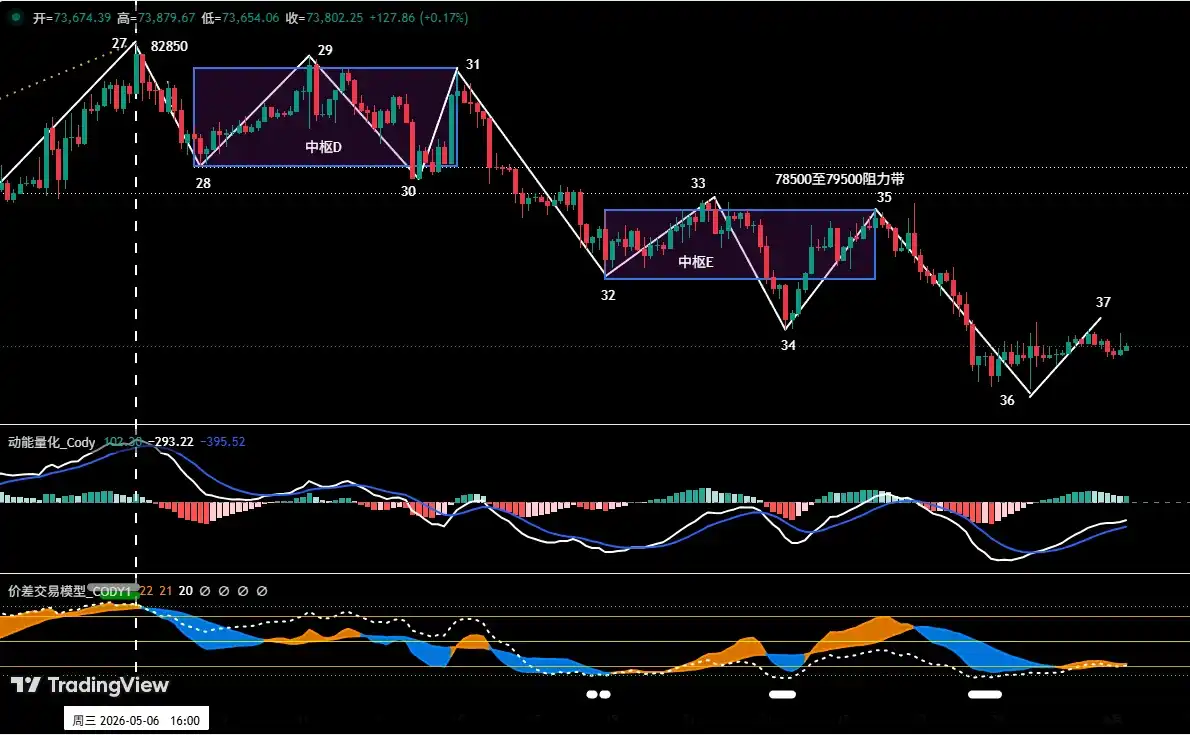
Figure 2
1、As shown in (Figure 2), from the high of $82,850 on May 6 to the present adjustment, the 4-hour chart reveals a detailed structure that can be subdivided into a 10-segment adjustment pattern from "Segment 27-28" to "Segment 36-37." This includes two descending pivot zones:
• Pivot Zone D: Formed by the overlapping of segments 28-29, 29-30, and 30-31.
• Pivot Zone E: Formed by the overlapping of segments 32-33, 33-34, and 34-35.
2、From the 4-hour structure, the current rebound is segment 36-37. If the price rebounds to the $75,000~$76,000 area and faces resistance, unable to form an effective breakout, the market is likely to continue its previous volatile downtrend and test the support level around $69,500~$70,500.
二、Bitcoin Market Outlook and Trading Strategy for This Week
1、BTC Market Outlook for This Week:
Core view for this week: Monitor the results of the test by both bulls and bears on the resistance zone of $75,000~$76,000 and the support zone of $69,500~$70,500.
2、Key Resistance Levels:
• First Resistance Zone: $75,000~$76,000 area (near the lower boundary of Pivot Zone E)
• Second Resistance Zone: $78,500~$79,500 area (near the boundaries of the two pivot zones)
3、Key Support Levels:
• First Support Level: $69,500~$70,500 area (previous important support level)
• Second Support Level: Around $65,000 (previous important support level)
4、This Week's Trading Strategy (Excluding the impact of sudden news)
1、Medium-Term Strategy:
Bitcoin _ Daily Candlestick Chart: (Position Monitoring Model)
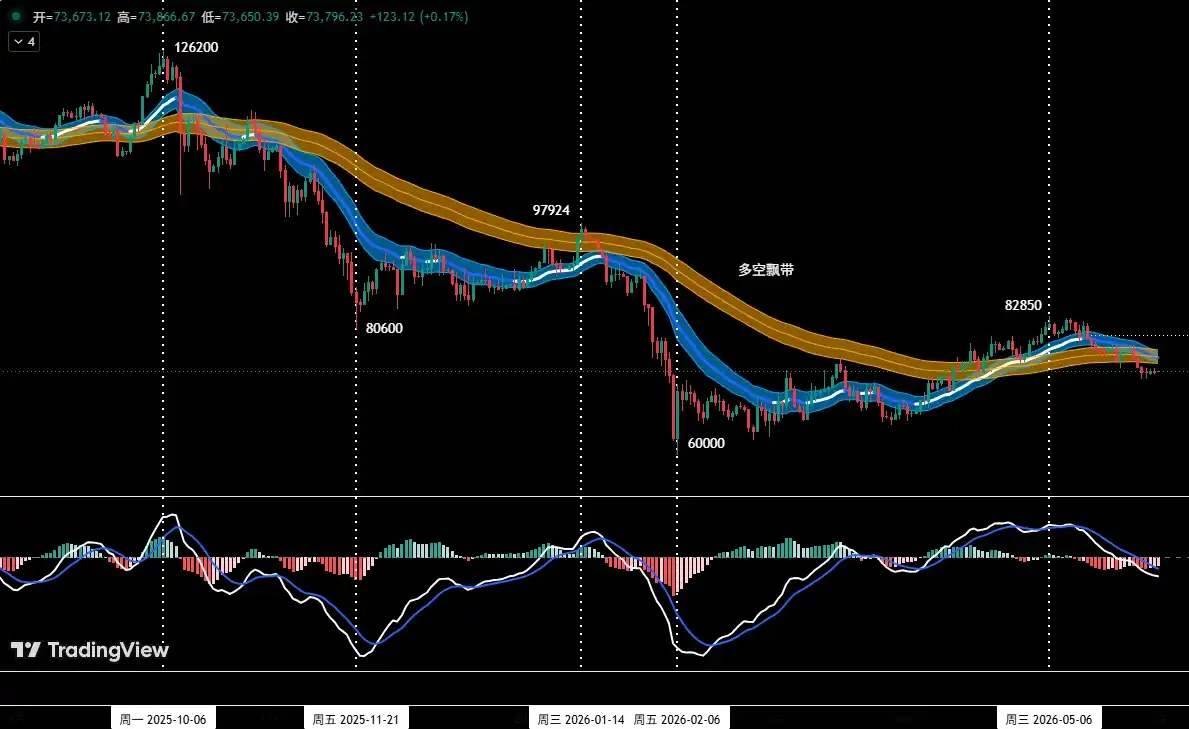
Figure 3
Position Monitoring Model: As shown in (Figure 3), the price has fallen below the "Bull-Bear Channel," entering a technically weak area. This week, monitor its retest result of the Bull-Bear Channel (around $75,000~$76,000). If the price rebounds to this level and shows signs of stagnation, resistance, or a pullback, it will signal the start of medium-term short position allocation. To control risk, the initial position can be kept below 30% of total capital; subsequently, if the price breaks below the lower boundary of the ascending channel (Yellow), increase the medium-term position to around 60%.
2、Short-Term Strategy: Utilize 30% of the position, set stop-loss points, and look for "spread" trading opportunities based on support and resistance levels. (Use the 30-minute/60-minute chart as the operation cycle).
3、To dynamically respond to the complex evolution of the market during short-term operations, we have prepared two specific operational plans in advance: A/B.
• Plan A:Rebound Meets Resistance, Sell on Rallies.
• Entry: When the price rebounds and meets resistance in the $75,000~$76,000 area, combined with a top signal from the quantitative model, a short position below 30% can be established.
• Risk Control: Initial stop-loss set above $77,000.
• Exit: Gradually close the position to take profits when the price adjusts near important support levels combined with model signals.
• Plan B: Effectively Breaks Support, Follow the Trend Short.
• Entry: When the price effectively breaks below the support zone of $69,500~$70,500 combined with a model top signal, a short position below 30% can be established.
• Risk Control: Initial stop-loss set above $72,000.
• Exit: Gradually close the position to take profits when the price falls to important support levels combined with model signals.
三、Analysis of HYPE's Hourly Chart Structure:
HYPE_4-Hour Candlestick Chart
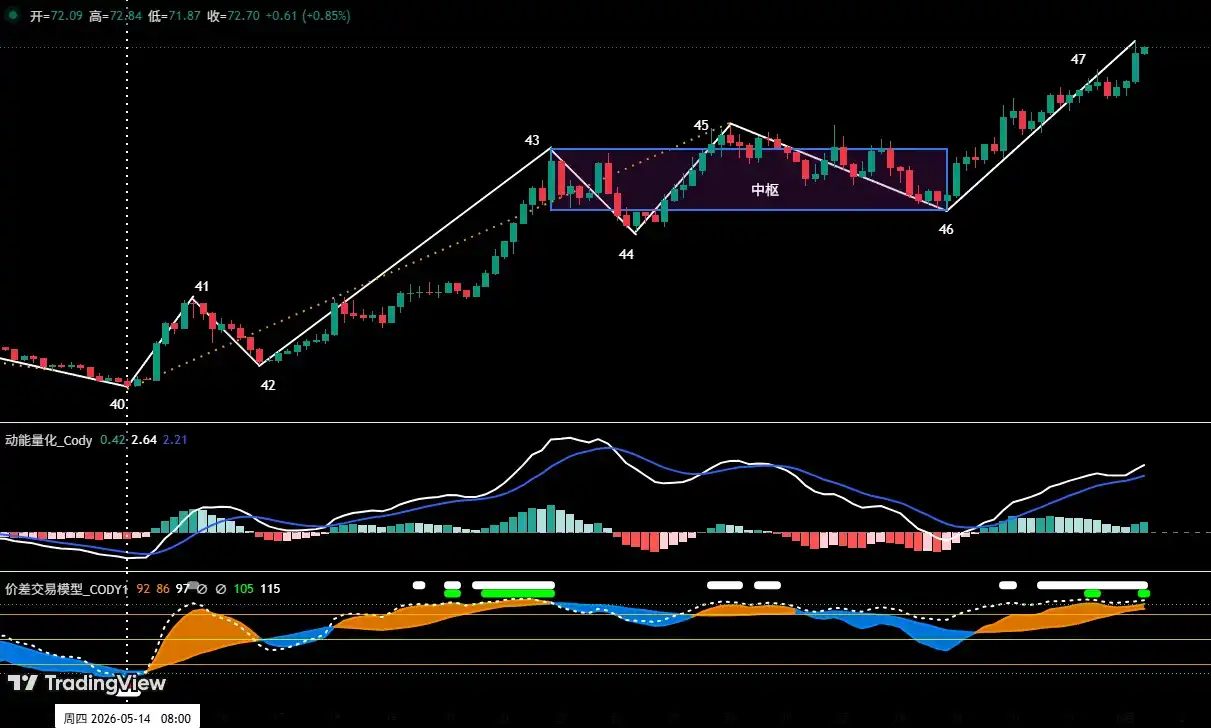
Figure 4
1、As shown in (Figure 4), on the 4-hour chart, since the low of $38.14 on May 14, HYPE has clearly constructed a seven-segment structure (segments 40-41 to 46-47) including a "rising pivot zone." Segments 43-44, 44-45, and 45-46 overlap, forming the "rising pivot zone."
2、The previous weekly review warned: Due to a momentum top divergence state at "Endpoint 45," combined with a top warning signal from the "Spread Trading Model," the two resonated. Therefore, the probability of forming a short-term high here was significant. Market movements confirmed this judgment: the price adjusted from "Endpoint 45" ($64.75) to "Endpoint 46" ($56.30), with a maximum decline of 13.05%.
3、Currently, comparing the pivot exit segment (46-47) with the entry segment (42-43), its upward momentum appears weak, forming a potential "momentum divergence."
4、Analysis from our self-built "Spread Trading Model" shows that "Endpoint 47" has triggered a strong top warning signal (red dot + white dot).
5、In summary, if the price forms a topping signal at "Endpoint 47" and the "momentum divergence" signal remains valid, the probability of this point becoming the terminal point of the rise since "Endpoint 40" will significantly increase. Subsequent price movements require close attention to the test results of the key area between $62.5 and $64.57.
四、HYPE Market Outlook and Short-Term Trading Strategy for This Week
1、HYPE Market Outlook for This Week:
Core view for HYPE this week:
• Observe whether "momentum divergence" is established when "Endpoint 47" issues a clear topping signal.
• If this phenomenon occurs, and the price subsequently effectively breaks below the support zone of $62.5 to $64.57, it can be considered that "Endpoint 47" has become the terminal point of the rally since the May 14 low.
2、HYPE Short-Term Trading Strategy for This Week: (Buy on Support)
This week's HYPE short-term trading should follow the strategy of "buying on dips, avoiding chasing rallies." The core is to observe the test results of the price pullback to the $62.5 to $64.75 area:
Strategy One:Test Long on Support Zone Stabilization
If the price pulls back to this zone, shows signs of stopping the decline and stabilizing, and combines with bottom signals triggered by the two major models, consider a light long position trial. The position must be controlled below 30%, strictly adhering to stop-loss discipline.
Strategy Two: Support Fails, Transitioning to a Larger Correction
If the price effectively breaks below this zone, the short-term correction will escalate into a larger-scale (e.g., daily level) adjustment, prolonging its duration and extending the downside target to the $54 to $56.3 area first.
五、Bitcoin Trade Review
1、Short-Term Trade Review:(See Table 1)
Strictly following the operational plan and based on trading signals issued by our self-built "Spread Trading Model" and "Momentum Quantification Model," we completed one short-term (short) trade last week, achieving a profit of 5.07%.
1、Bitcoin Short-Term Trade Details Summary:(Leverage *1)
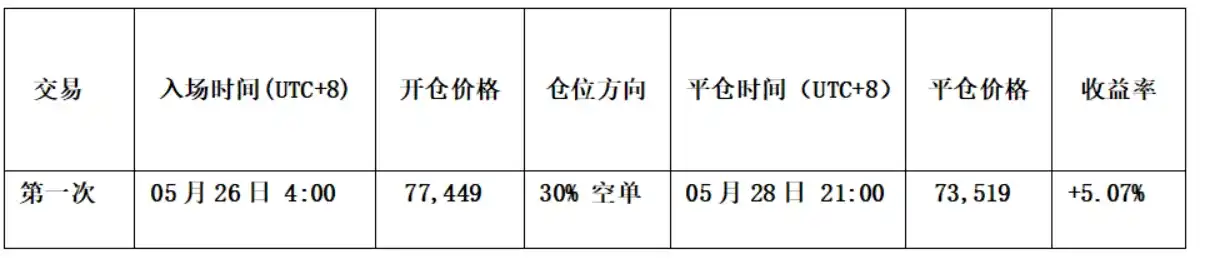
Table 1
2、Short-Term Trade Review:(See Figure 5)
• Entry Strategy:
a、When the price rebounded near $78,000, it showed resistance signals, and the candlestick formed a "top reversal" bearish pattern;
b、The "Spread Trading Model" triggered a top warning signal (white dot);
c、The "Momentum Quantification Model" issued a momentum top divergence signal.
Therefore, we established a 30% short position at $77,449.
• Exit Strategy:
a、When the price fell near $73,000, it showed signs of stopping the decline, and the candlestick formed a "bottom reversal";
b、The "Spread Trading Model" triggered a strong bottom warning signal (red dot + white dot), forming a bottom resonance signal with the "Momentum Quantification Model."
Therefore, we closed all positions near $73,519.
• Summary: This trade successfully achieved a profit of approximately 5.07%.
BTC_60-Minute Candlestick Chart: (Momentum Quantification Model + Spread Trading Model)
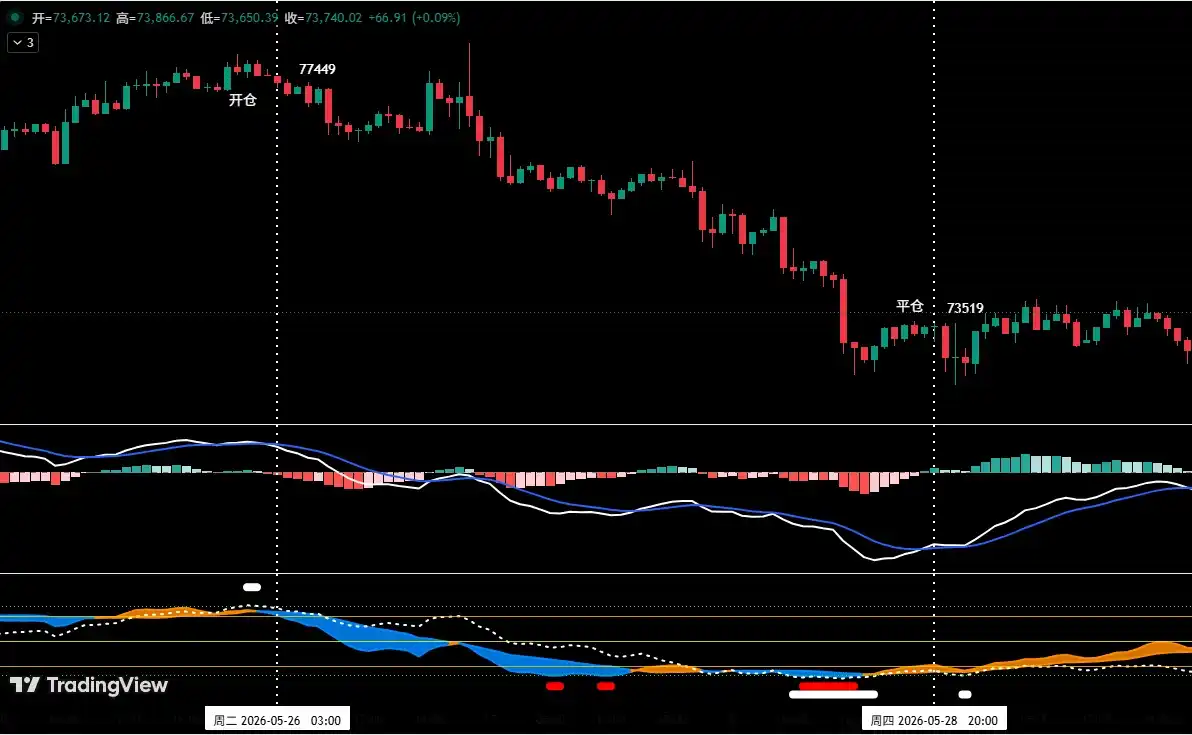
Figure 5 (Short-Term Trade Illustration)
六、Special Reminders:
1. Upon Entry: Immediately set the initial stop-loss.
2. When Profit Reaches 1%: Move the stop-loss to the entry price (breakeven point) to ensure capital safety.
3. When Profit Reaches 2%: Move the stop-loss to the 1% profit level.
4. Continuous Tracking: Thereafter, for every additional 1% profit, move the stop-loss up by 1% accordingly to dynamically protect and lock in profits.
Financial markets are constantly changing. All market analysis and trading strategies require dynamic adjustments. All views, analytical models, and operational strategies mentioned in this article are derived from personal technical analysis, intended solely for personal trading log purposes, and do not constitute any investment advice or basis for operation. The market carries risks; investing requires caution. Please do not make decisions based on this.