Bitcoin nears $72K – But here’s why BTC’s setup looks extremely fragile

Ambcrypto发布于2026-03-26更新于2026-08-02

文章摘要

Structural weakness remains intact, with no confirmed emergence of a momentum-backed rally.

Bitcoin’s [BTC] recent push toward $72,000 may therefore reflect a temporary move higher, one that risks trapping overly aggressive long traders.

In derivatives markets, positioning has turned notably bullish. The OI-Weighted Funding Rate has climbed to 0.0054%, marking its most optimistic level since the 23rd of February.

This suggests that a significant share of Bitcoin’s $50.64 billion in Open Interest is concentrated in long positions.

Under typical market conditions, such positioning would reinforce a bullish outlook. In the current context, however, it raises the risk of overcrowding, where excessive long exposure leaves the market vulnerable to a reversal.

A familiar setup pointing to a trap

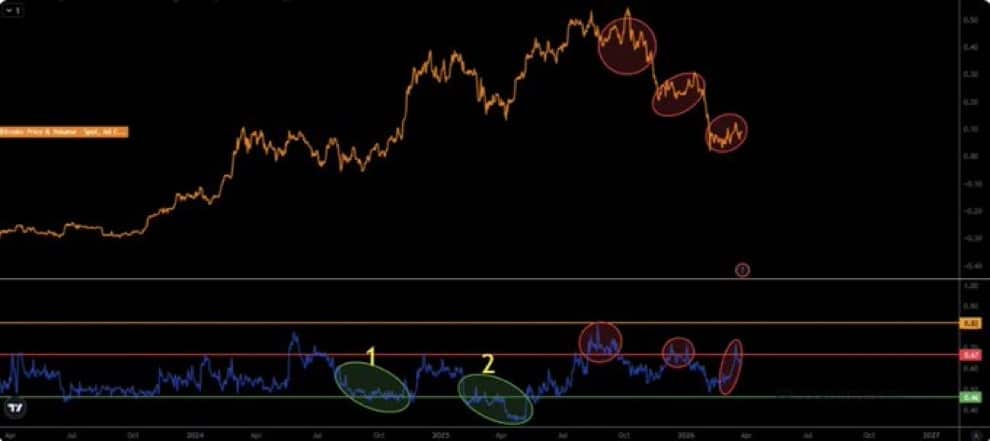
Data from a CryptoQuant chart, published by a pseudonymous analyst tracking Bitcoin’s supply-demand dynamics using price and volume indicators, points to a recurring imbalance.

Similar structures appeared ahead of the October 2024 rally to $109,588 and the April 2026 rally to $126,199, identified as Zone 1 and Zone 2. In both cases, the imbalance temporarily eased before price continuation.
Source: CryptoQuant

However, the current formation near $72,000 more closely resembles the imbalance zones that preceded sharp declines to $90,000 and later $80,000. In those instances, the imbalance signaled exhaustion rather than continuation.

With this pattern now repeating, the implication is clear: the ongoing rally may not be structurally sound. Instead, it may represent a short-lived advance before a broader downside move, likely driven by long liquidations.

Weak fundamentals limit upside

Beyond technical structure, Bitcoin’s macro and on-chain backdrop does not support a sustained rally.

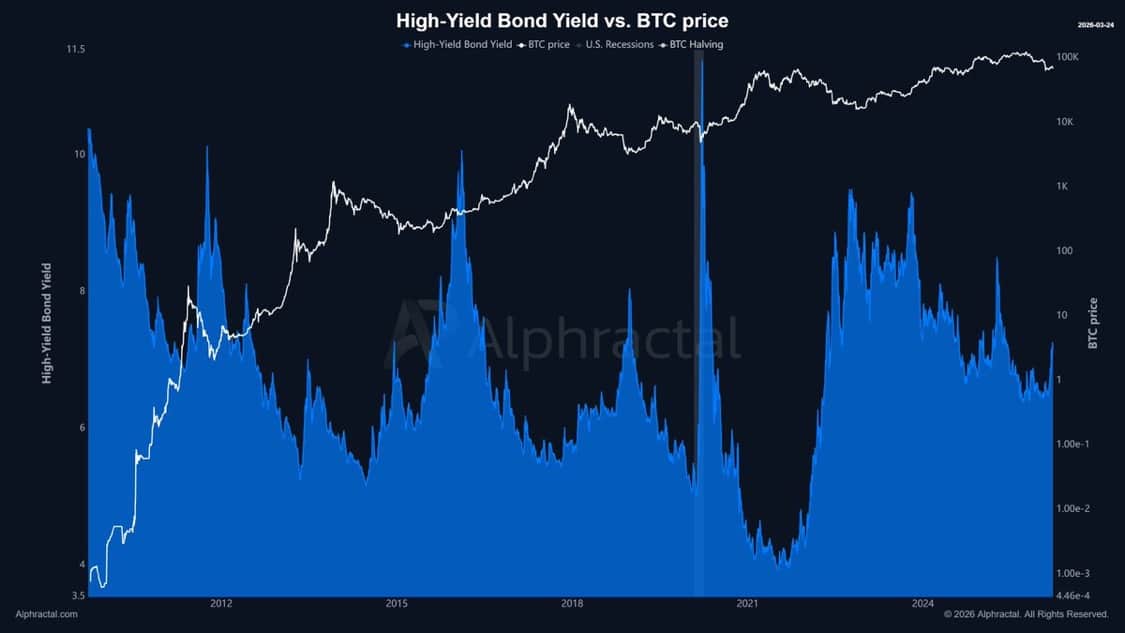
High-yield bond yields continue to rise, reflecting increasing caution among investors. These bonds, issued by lower-rated companies, must offer higher returns to compensate for elevated risk.

When yields climb, it often signals tightening financial conditions and reduced risk appetite.

Historically, such environments have aligned with periods of weakness in Bitcoin, often preceding notable drawdowns. The current rise in yields suggests that broader market conditions remain unfavorable for sustained crypto upside.
Source: Alphractal

At the same time, Spot market activity shows limited participation from retail traders. Trading frequency remains largely neutral, extending a multi-month trend of subdued engagement.

In a strong bullish phase, expanding retail activity typically acts as a key driver of momentum. Its absence indicates that the current move lacks the depth and breadth needed to sustain higher prices.

Accumulation lacks confirmation

While some accumulation is visible in the Spot market, it remains insufficient to confirm a trend reversal.

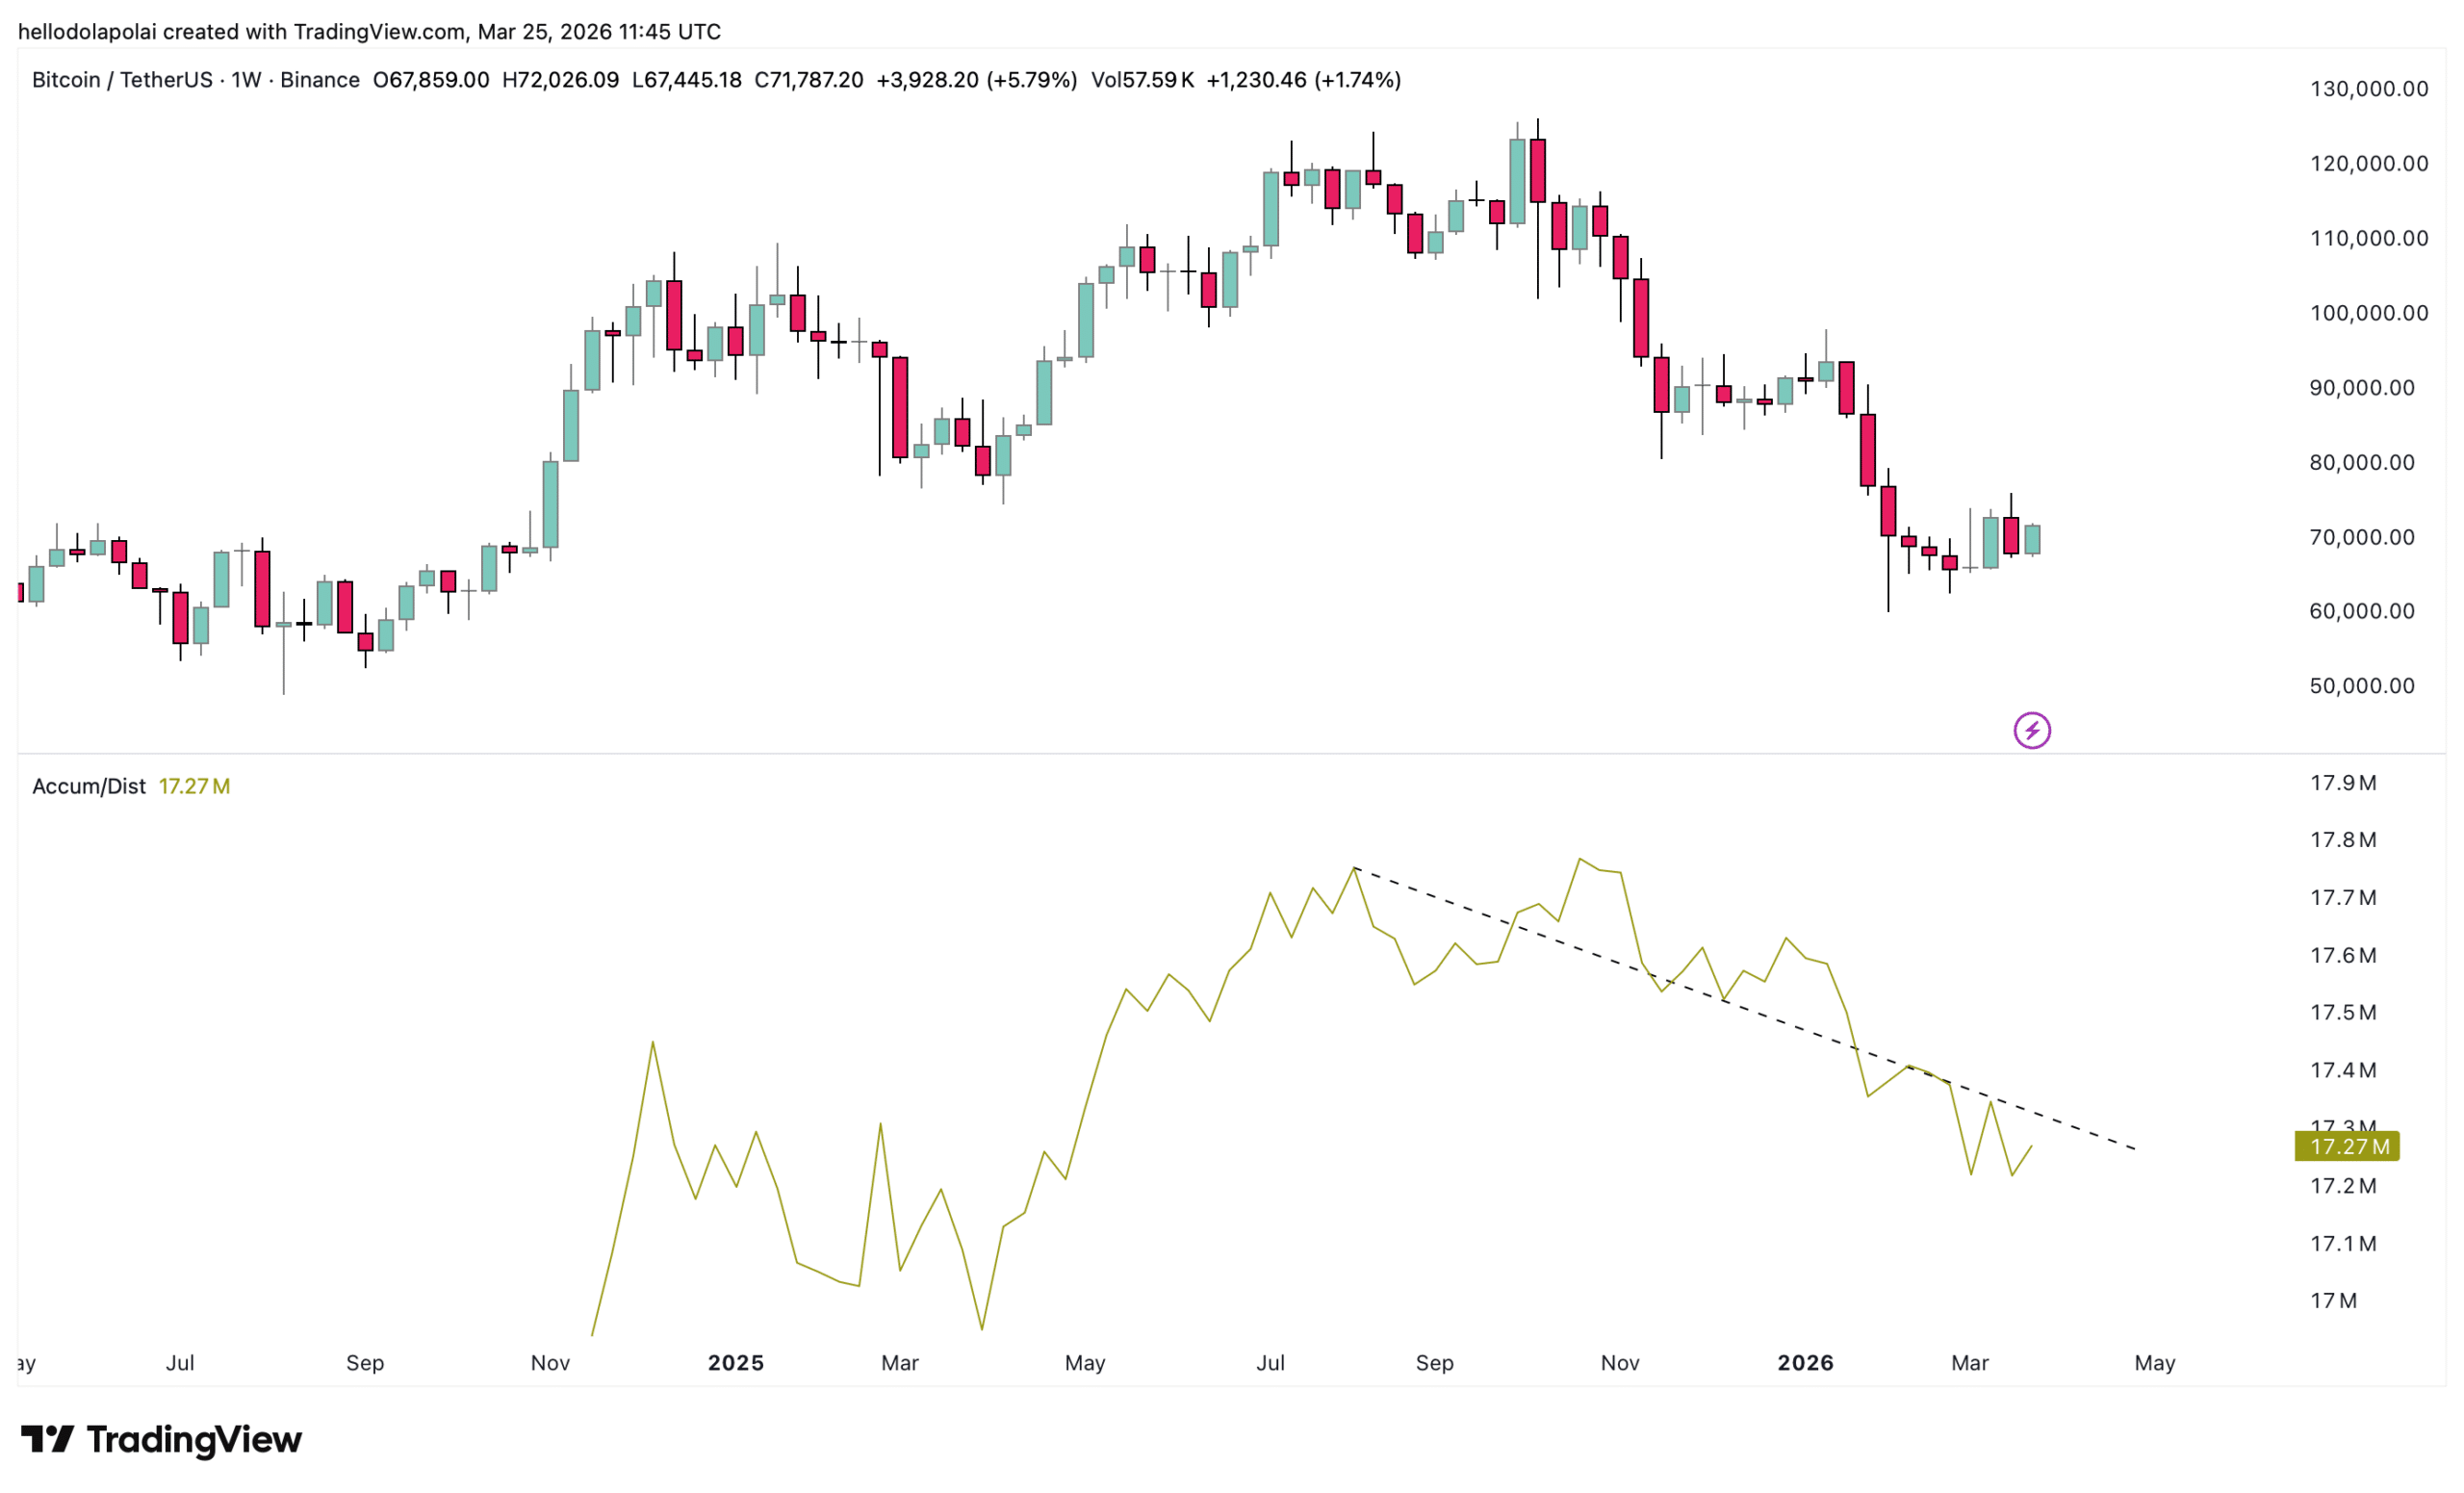
The Accumulation/Distribution (A/D) indicator shows a modest uptick, suggesting that some investors are beginning to buy. However, this signal remains preliminary.

For a confirmed bullish shift, the indicator must break above its resistance trendline and sustain upward movement. Until then, the current accumulation phase reflects early positioning rather than conviction.
Source: TradingView

In its present state, Bitcoin’s structure, positioning, and fundamentals point to a fragile rally. Without stronger confirmation, the move toward $72,000 risks being remembered not as a breakout, but as a trap.

Final Summary

  • Bitcoin’s supply-demand dynamics continue to follow a recurring fractal pattern that previously preceded sharp declines from the $90,000 and $80,000 regions.
  • Structural weakness remains intact, with no confirmed emergence of a momentum-backed rally.

热门币种推荐

相关问答

QWhy does Bitcoin's current push toward $72,000 look fragile according to the article?

AThe article states that the push is fragile because it reflects a temporary move higher that risks trapping overly aggressive long traders. The market shows signs of overcrowding with excessive long exposure, making it vulnerable to a reversal, and the current formation resembles imbalance zones that preceded sharp declines in the past.

QWhat does the high OI-Weighted Funding Rate of 0.0054% indicate about market positioning?

AThe high OI-Weighted Funding Rate indicates that positioning in derivatives markets has turned notably bullish, with a significant share of Bitcoin's open interest concentrated in long positions. This creates a risk of overcrowding, which can lead to a market reversal if long positions are liquidated.

QHow do high-yield bond yields relate to Bitcoin's performance, as mentioned in the article?

ARising high-yield bond yields reflect increasing caution among investors and tightening financial conditions, which historically align with periods of weakness in Bitcoin. The current rise in yields suggests unfavorable broader market conditions for sustained crypto upside.

QWhat is the significance of the Accumulation/Distribution (A/D) indicator in the current market context?

AThe A/D indicator shows a modest uptick, suggesting some investors are beginning to buy, but it remains insufficient to confirm a trend reversal. For a confirmed bullish shift, the indicator must break above its resistance trendline and sustain upward movement, which hasn't happened yet.

QWhat recurring pattern in Bitcoin's supply-demand dynamics does the article highlight as a warning sign?

AThe article highlights a recurring fractal pattern where similar imbalance structures appeared ahead of sharp declines, such as the drops to $90,000 and $80,000. The current formation near $72,000 resembles these imbalance zones that signaled exhaustion rather than continuation, indicating potential downside risk.

你可能也喜欢

意大利央行未发现稳定币在汇款中存在系统性优势

意大利银行的一项研究显示,稳定币在跨境汇款中并未展现出持续的成本与速度优势。其潜在优势被法币出入金手续费以及本地支付基础设施的处理流程所抵消。 研究比较了通过200 USDC在意大利与巴西、阿根廷、日本、阿联酋和南非等10条双向通道进行汇款的成本与结算时间,并与标准汇款服务进行对比。 结果显示,稳定币转账的总成本在0.3%到近9%之间波动,具体取决于汇款方向。在具备即时支付系统的通道中,结算可在20分钟内完成;若缺乏此类基础设施,则需一至两个工作日。 主要成本和延迟源于货币兑换以及当地基础设施的质量。区块链网络手续费并非主要因素。 尽管在大多数研究通道中,稳定币成本低于世界银行统计的全球平均汇款成本(6.65%),但与传统汇款服务商Wise相比,仅在七条可比通道中的三条具备成本优势。 研究者认为,若稳定币能直接用于商品服务消费而无需兑换成当地货币,其优势将更为明显。同时指出,禁令性监管无法消除市场对稳定币的需求,而过严的规则只会增加零售用户的使用难度。 此外,报告提及,稳定币总市值在7月已从5月峰值下跌超100亿美元,至约3100亿美元,创下自2022年5月Terra崩溃以来的最大月度跌幅。

cryptonews.ru2小时前

意大利央行未发现稳定币在汇款中存在系统性优势

cryptonews.ru2小时前

比特币热潮正酣:塞勒尔新声明引发关于购买的猜测

纳斯达克上市公司MicroStrategy(代码:MSTR)的执行董事长迈克尔·塞勒于8月2日发布信息“Bitcoin Drive engaged”(比特币驱动已启动),再次引发市场对于该公司将在周一宣布新一轮比特币购买的猜测。其周日的帖子附带了该公司惯用的购买追踪图表,这符合塞勒通常在每周财报发布前暗示其金库变动的做法。 塞勒的附图报告显示,MicroStrategy的比特币储备为843,775枚BTC,市值约532.5亿美元。平均购买成本为每枚75,653美元,未实现亏损为105.8亿美元(-16.58%)。截至8月2日,累计进行了113次购买操作。 此前在7月27日,类似的周日信号曾预告了公司的公告,当时塞勒发文称“我们还需要一种颜色”,随后MicroStrategy披露了其更大的现金储备。这种时间上的巧合强化了市场对周一将发布新金库状况公告的预期。 然而,该公司实时账本显示,在最近两次共计出售3,588枚BTC(包括1,363枚和2,225枚)后,其比特币储备已从847,363枚降至843,775枚。根据提交给美国证券交易委员会(SEC)的文件,这些出售是为了资助优先股支付并补充美元储备。最近的报告还显示,在截至7月26日的一周内,MicroStrategy没有购买任何比特币,同时将其美元储备增加至约37.5亿美元,这使其优先股股息和债务利息的预计覆盖期限延长至约2.1年。 财务风险依然高企,该公司报告2026年第二季度运营亏损83.3亿美元,与上年同期140.3亿美元的运营利润形成急剧逆转。这些业绩包含了公司数字资产方面83.2亿美元的未实现亏损,而2025年第二季度为未实现利润140.5亿美元。 管理层还可能通过额外出售比特币获得高达12.5亿美元,以补充用于支付优先股股息和债务利息的美元储备。因此,预计周一的披露将揭示“Bitcoin Drive”信息是否标志着资产积累的恢复,因为MicroStrategy需要在平衡其843,775枚BTC自有储备与不断增长的现金负债和积极的资本管理之间做出抉择。

cryptonews.ru2小时前

比特币热潮正酣:塞勒尔新声明引发关于购买的猜测

cryptonews.ru2小时前

交易

现货

热门文章

加密市场宏观研报:《GENIUS Act》法案取得重大进展,BTC突破历史新高,后市全新展望

2025年5月22日,比特币价格正式突破11万美元大关,创下历史新高。在政策面、宏观经济、资金面与投资者结构共同作用下,一场结构性牛市浪潮正在展开。而此轮上涨背后的核心驱动,是美国《GENIUS稳定币法案》的实质性进展以及多项利好的叠加。本文将从政策端突破、宏观环境转向、链上与ETF资金结构、交易行为演化,以及重点受益赛道五大维度,全面解析此轮BTC再创新高的深层逻辑,并前瞻下半年市场的潜在趋势。

1.8k人学过发布于 2025.05.22更新于 2025.05.22

加密市场宏观研报:《GENIUS Act》法案取得重大进展,BTC突破历史新高,后市全新展望

相关讨论

欢迎来到HTX社区。在这里,您可以了解最新的平台发展动态并获得专业的市场意见。以下是用户对BTC(BTC)币价的意见。

活动图片















