In last week's report, we clearly indicated that the market was in a bull trap zone, advised investors against blindly chasing rallies to add positions, and maintained our bearish trend judgment. This week's market movement provided clear validation—Bitcoin failed to effectively break through the resistance zone and subsequently showed a clear pullback, with the bearish logic continuing to hold.
The following will present this week's market forecast, operational strategy recommendations, and a review of last week's trade execution to help readers grasp the direction and make precise decisions in a complex market.
Core Summary of the Trading Weekly Report:
• HYPE Short-Term Trading Results: Completed one short-term long position (1x leverage) last week, successfully achieving a return of approximately 4.41%. (Details in Part Two)
• BTC Short-Term Trading Results: Completed one short-term short position (1x leverage) last week, successfully achieving a return of approximately 5.37%. (Details in Part Four)
• HYPE This Week's Forecast and Operational Strategy: See Parts One and Two for details.
• BTC Price Trend Forecast and Medium & Short-Term Operational Strategies: See Parts Three and Four for details.
• Core View Validation: Bitcoin remained in a bearish trend structure last week, with the price movement fully aligning with our forecast; the bull trap warning was effectively realized.
一、HYPE Prediction and Operational Strategy
1、Core View This Week:
Based on the current structure, we judge that the current hourly-level downward adjustment initiated from the high on March 19th (near endpoint 27) is likely to end soon. Subsequent price movement needs to be observed to see if the price can effectively break away from the束缚 of the range of central pivot C to confirm whether the adjustment has truly ended. If it can break through effectively, the signal for trend continuation will become clearer. It is expected that the probability of wide-range fluctuations this week is high, and operations should remain flexible.
2、HYPE Upside Risk Warning:
It must be specifically pointed out that although HYPE's price movement has its independence, it still cannot completely detach from Bitcoin's macro environment. If Bitcoin's subsequent price movement shows a significant adjustment, it may dampen HYPE's rebound momentum. Investors must remain vigilant and prepare risk contingency plans.
3、Operational Strategy This Week:
Utilize 30% of the position, set stop-loss points, and look for "spread" opportunities based on support and resistance levels. (Using the 30-minute/60-minute chart as the operational cycle). Operations should be light and flexible, strictly adhering to stop-loss discipline.
二、HYPE Last Week's Structure Analysis and Short-Term Trade Review
1、HYPE Market Dynamics and Investment Opportunity Continuous Tracking
Since late February, we have continuously tracked and analyzed HYPE, with each previous judgment effectively validated by market movements. A specific review is as follows:
• February 23rd Weekly Review: First indicated that HYPE might be entering an investment window, pointed out that the行情 was in a Wave II correction phase, and predicted that it was expected to initiate a Wave III main upward行情 subsequently.
• March 3rd Weekly Review: Determined that the low of $25.60 on February 24th could be the starting point of Wave III, confirming the potential location for a trend reversal.
• March 9th Weekly Review: Pointed out that the price had effectively broken through multiple moving average resistances on the daily chart, subsequently entering a retracement and consolidation phase, expecting a rapid rise to follow after its conclusion.
• March 16th Weekly Review: Pointed out that the行情 was in a Wave III trend and was constructing an upward central pivot (i.e., central pivot B). Predicted that after completion, the probability of wide-range fluctuations was high.
2、HYPE Daily Level Structure Overview: (Based on price action after January 21st)
The current HYPE daily chart clearly shows a three-wave progression pattern, with the characteristics of each sub-wave as follows:
• Wave I (Impulse Wave): From the low of $20.46 on January 21st to the high of $38.41 on February 3rd, lasting 14 days, with a maximum increase of 87.73%, showing strong driving force.
• Wave II (Corrective Wave): From the high of $38.41 on February 3rd to the low of $25.60 on February 24th, lasting 20 days, with a maximum decline of 33.35%, an adjustment幅度 within the normal retracement range.
• Wave III (Main Upward Wave): From the low of $25.60 on February 24th to the present, the行情 has run for 27 days, with a maximum increase of 71.02%. The main upward trend is still continuing, with good structural integrity.
3、HYPE Hourly Level Subdivision Structure: (Based on price action after March 16th)
HYPE_60 Minute K-Line Chart
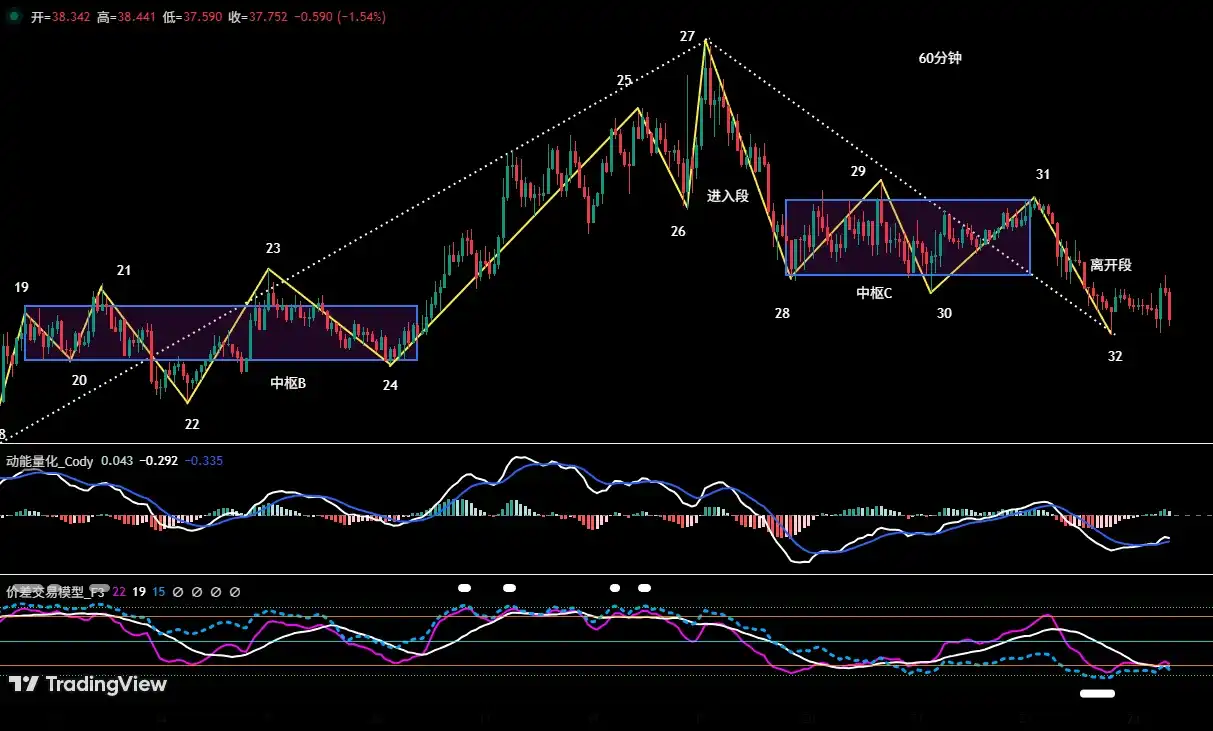
Figure One
• HYPE Hourly Level Structure Review: As shown in the chart, the price was constructing an upward central pivot (i.e., central pivot B) during the period from the 9th to the latter part of the 15th, and it was nearing completion, overall aligning with our previous prediction.
• HYPE Hourly Level Internal Structure Division: (03.16~03.22)
a、As shown in (Figure One), starting from endpoint 24, the previously constructed upward central pivot (i.e., central pivot B) has been confirmed as complete. Subsequently, the行情 evolved into a complex structure consisting of 8 segments: 24-25, 25-26, 26-27, 27-28, 28-29, 29-30, 30-31, 31-32. As of the time of analysis, segment 31-32 was running, with a relatively clear structural hierarchy.
b、Segments 24-25, 25-26, 26-27 form an upward structure, with a relatively clear direction.
c、Segments 27-28, 28-29, 29-30, 30-31, 31-32 form an adjustment structure, with the adjustment process showing obvious震荡收敛 characteristics (oscillating convergence).
d、Among them, segments 28-29, 29-30, 30-31 overlap with each other,共同构建 a downward central pivot (i.e., central pivot C), which is the core range of this adjustment.
4、HYPE Short-Term Trade Review (1x Leverage): (03.16~03.22)
Last week, based on trading signals from our self-constructed spread trading model and momentum quantitative model, combined with the prediction of the upward structure, we completed one short-term (long) operation, successfully profiting 4.41%. The execution process strictly followed the plan.
• HYPE Short-Term Trade Details Summary: (Leverage×1)

• Opening Decision: This opening decision was based on the prediction of trend continuation after the completion of upward central pivot B. The specific trigger signal was the price effectively breaking through the central pivot's upper rail resistance (approx. $38.54), and both the spread and momentum quantitative models发出看涨共振 signals (bullish resonance signals). The叠加 of multiple bases significantly improved the reliability of the entry timing. Accordingly, we executed a 30% position long order at $38.73.
• Closing Decision: Based on the spread quantitative model issuing a top bearish signal, forming a technical resonance with the K-line "strong top分型" combination signal, the top characteristics were clear. Therefore, we executed a closing operation near $40.44, taking the profit.
• Trade Summary: This operation successfully profited approximately 4.41%. The entry and exit points were effectively supported by model signals, indicating high strategy execution quality.
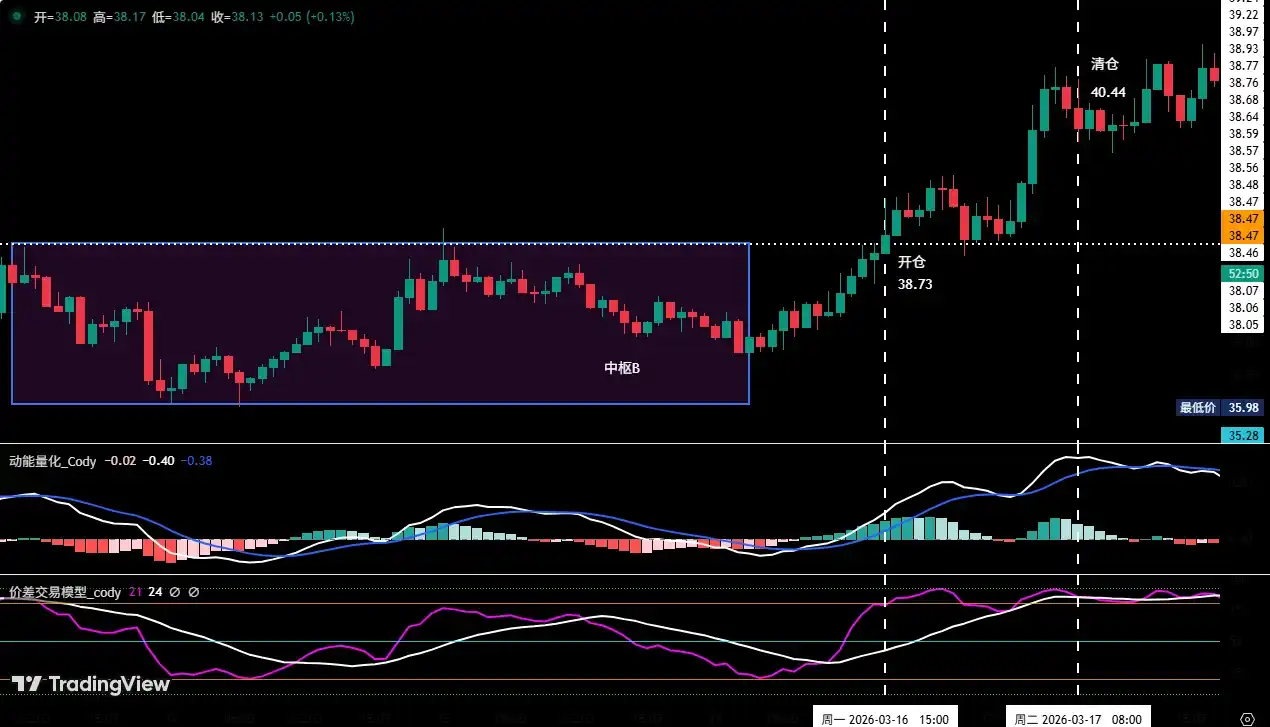
Figure Two
三、This Week's BTC Prediction and Operational Strategy (03.23~03.29)
1、Bitcoin Predicted Structure Analysis (Based on price action after the February 6th low)
Using Bitcoin's 4-hour chart as the analysis period:
• Maintain the previous core research framework: The upward行情 initiated from the low on February 6th (approx. $60,000) is, in nature, a oversold rebound within the large-level C-wave adjustment, specifically the C-2 wave. The rebound nature determines its limited upside space, followed by the C-3 wave adjustment行情.
• Current Structure Interpretation: In the 4-hour analysis period, the short-term upward structure formed from the low on February 24th has been broken. The防守 capability of the bulls at key positions has significantly weakened. If the current support cannot be recovered subsequently, it may further test the lower rail of the upward channel formed since the rebound from the February 6th low. Once this position is lost, the probability that the C-2 wave rebound ended near the recent high of $76,000, as we previously analyzed, will significantly increase. The market may then test the $60,000关口 again downward, at which time market pressure will明显加重. Overall, the market remains dominated by a bearish trend structure.
• C-3 Wave Establishment Condition: If the Bitcoin price falls below the February 6th low (approx. $60,000), the C-3 adjustment wave is established. At that time, downward targets will be reopened, and operational预案 must be prepared in advance.
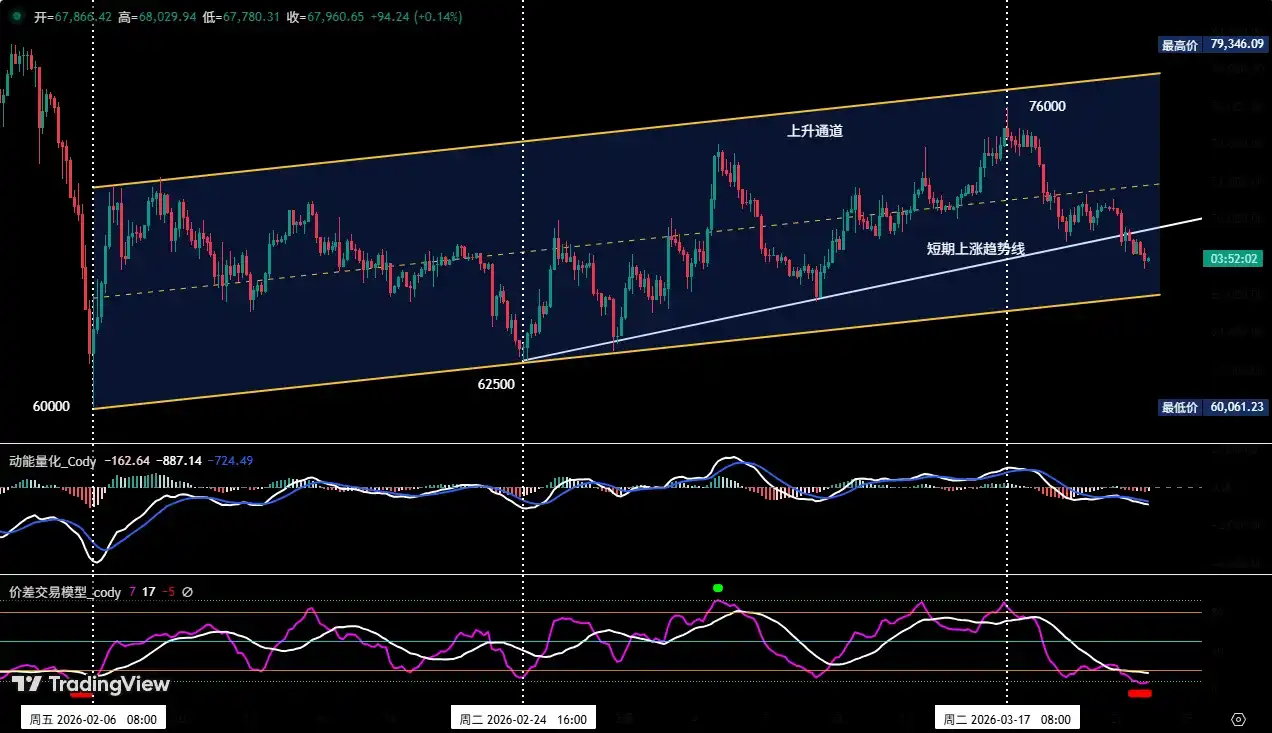
Figure Three
2、This Week's Forecast View:
Maintain the震荡调整格局 (oscillating adjustment pattern), focusing on the battle between bulls and bears near the channel's lower rail (from the February 6th low). The volume changes and price reaction at this位置 will be an important basis for judging the subsequent direction.
3、Core Resistance Levels:
• First Resistance Zone: $69,500~$71,500 area (previous震荡区间, main resistance band for short-term rebound)
• Second Resistance Zone: $74,500~$76,000 area (near the November 2025 low, an important reference level for medium-term bearish strategies)
4、Core Support Levels:
• First Support Level: $65,000~$66,000 area (previous important support area)
• Second Support Level: $60,000~$62,500 area (near the February 6th low; if lost, the bearish structure will be further strengthened)
• Third Support Level: Near $57,400 (an important technical reference level below)
5、This Week's Operational Strategy (Excluding the impact of突发消息):
1 Medium-Term Strategy:
Bitcoin Daily K-Line Chart: (Position Monitoring Model)
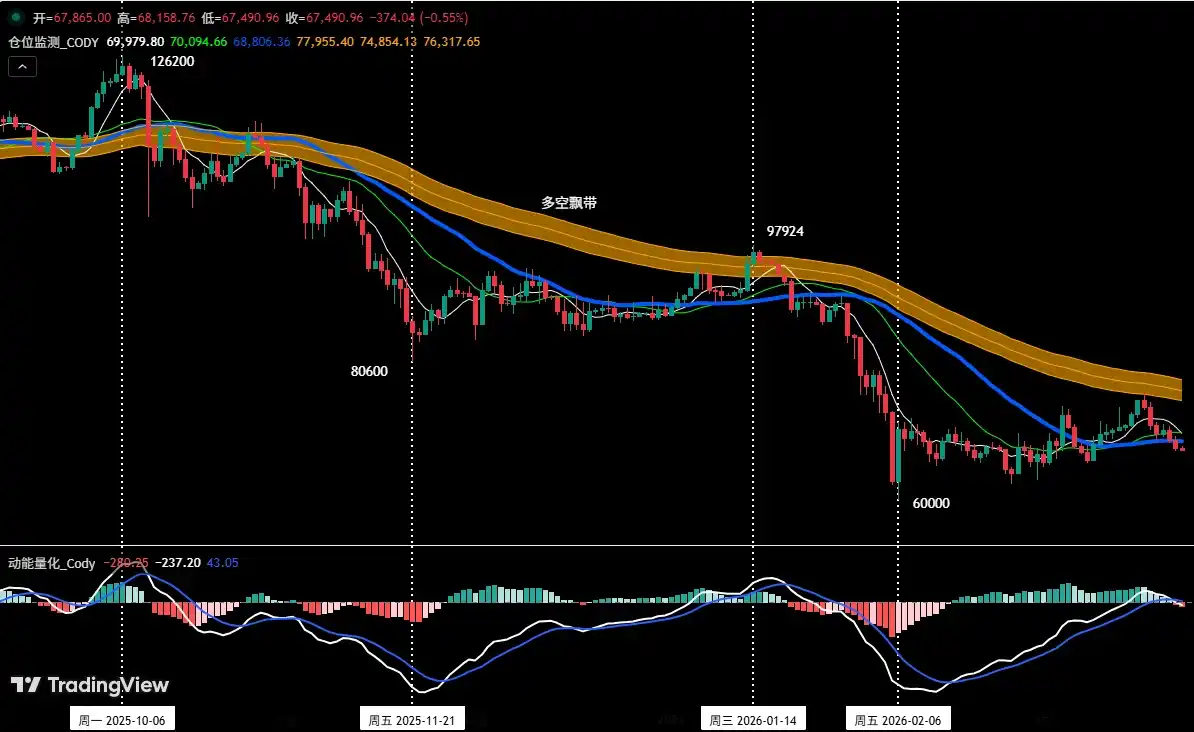
Figure Four
The Position Monitoring Model shows: The coin price is currently below the Bull-Bear Ribbon (yellow), and the bearish structure continues to hold. According to the strategy rules, we continue to hold the 60% short position established at $89,000 (January 28th). The medium-term direction remains unchanged.
• If the coin price反弹 effectively breaks through $74,500, reduce the medium-term position to 40% to lower risk.
• If the coin price反弹 effectively breaks through the Bull-Bear Ribbon and stabilizes above it, clear all medium-term positions, adjusting the strategy with the trend.
2 Short-Term Strategy:
Utilize 30% of the position, set stop-loss points, and look for "spread" opportunities based on support and resistance levels. (Using the 30-minute/60-minute chart as the operational cycle). Short-term operations must strictly execute stop-loss discipline to avoid significant losses from small mistakes.
3 Short-Term Plans A/B:
Since the medium-term market direction is bearish, the operational principle of "trading with the trend by going short" should be adhered to. To dynamically respond to the market's complex evolution and combine with signals from our self-built trading models, we have formulated two short-term operational plans, A and B, for live trading reference:
• Plan A: Sell on rallies encountering resistance.
Targeting scenarios with limited rebound strength and obvious resistance at resistance levels, specific execution is as follows:
• Open Position: When the coin price反弹至 the $69,500~$71,500 area triggers a resistance signal, combined with a model top signal, a 15% short position can be established.
• Add Position: If the coin price continues to反弹至 the $74,500~$76,000 area and encounters resistance, an additional 15% short position can be added,布局 in batches to control the average cost.
• Risk Control: The initial stop-loss for both short orders is set above $77,000, strictly executed with no flexibility.
• Close Position: When the coin price falls near important support levels, combined with model signals, gradually close positions to take profits, avoiding the risk of missing out by closing all at once.
• Plan B: Follow-through short on breakdown.
Targeting scenarios where the coin price continues to decline with a structural breakdown, specific execution is as follows:
• Open Position: When the coin price持续调整跌破 the channel's lower rail, retests this point but fails to hold, combined with a model top signal,顺势建立 a 30% short position to leverage the momentum for larger gains.
• Risk Control: The initial stop-loss for the short order is set about 2% above the entry price (i.e., entry price × 1.02), strictly controlling the maximum loss.
• Close Position: When falling to support levels combined with model signals, gradually close positions to take profits.
四、Bitcoin Short-Term Trade Review (03.16~03.23)
1、Short-Term Trade Review:
We strictly followed the trading signals from our self-constructed spread trading model and momentum quantitative model, combined with the prediction of market movement, and completed one short-term (short) operation last week, achieving a trading profit of 5.37%, with complete execution discipline.
1 Bitcoin Short-Term Trade Details Summary: (Leverage×1)

• Opening: When the coin price反弹至 near $76,000 encountered resistance, the spread trading model simultaneously triggered a strong top warning signal (green dot in the chart), forming a short-selling resonance with the momentum quantitative model. The signals from the two models were highly consistent, indicating clear top pressure characteristics. Based on this signal叠加, we established a 30% short position at $74,246, with sufficient basis for entry.
• Closing: When the coin price fell near $69,000 and stabilized,同时 the spread trading model triggered a bottom warning signal, showing initial support characteristics. Therefore, we closed all positions near $70,257, timely realizing profits.
• Summary: This trade successfully profited approximately 5.37%. The short direction judgment was accurate, and both entry and exit were supported by model signals, indicating overall good execution quality.
2、Medium-Term Trade Review:
The medium-term strategy continues to advance steadily. We continue to hold the 60% short position established near $89,000 (January 28th). As of last week's close (closing price approx. $67,865), the profit is approximately 23.75%, with the maximum profit during the period reaching 32.58%. The medium-term position is overall performing well.
五、Special Note
Risk management is the foundation of stable trading profits. Please strictly adhere to the following execution discipline:
1. When opening a position: Immediately set the initial stop-loss level.
2. When profit reaches 1%: Move the stop-loss to the entry cost price (breakeven point) to ensure capital safety.
3. When profit reaches 2%: Move the stop-loss to the 1% profit level.
4. Continuous tracking: Thereafter, for every additional 1% profit, move the stop-loss同步 by 1%, dynamically protecting and locking in profits.
Financial markets change rapidly. All market analysis and trading strategies require dynamic adjustment. All views, analytical models, and operational strategies involved in this article are derived from personal technical analysis, intended solely for personal trading log purposes, and do not constitute any investment advice or operational basis. The market involves risks, investment requires caution. Please do not make decisions based on this.





















