Last week's market performance was largely in line with expectations—Bitcoin maintained a weak consolidation near the lower rail of the rising channel, with the bearish trend remaining dominant; HYPE, on the other hand, completed confirmation within the $36~38 support zone, continuing its independent upward logic.
This week's report will build on this foundation, further dissecting the current price structure, updating market forecasts and operational plans, and providing a complete review of last week's trading execution.
Summary of This Week's Core Trading Views:
• HYPE's market forecast and short-term trading strategy for this week. (Details in Part One)
• In-depth deconstruction of HYPE's current price structure (hourly timeframe). (Details in Part Two)
• BTC's market forecast and medium & short-term trading strategies for this week. (Details in Part Three)
• BTC trading review. (Details in Part Four)
Market Validation of Last Week's Core Views:
• HYPE Short-term Trading Results: HYPE short-term long position (1x leverage) executed last week, achieving a gain of approximately 5.25%. (Details in Table 1)
• BTC Short-term Trading Results: Bitcoin short-term short position (1x leverage) executed last week, achieving a gain of approximately 6.17%. (Details in Table 2)
• BTC Medium-term Trading Results Validation: Bitcoin followed the established medium-term strategy last week, continuing to hold the short position established at $89,000 (1x leverage). As of last week's close (~$66,962), the profit is approximately 24.76%, with a maximum profit of ~32.58% during the period.
• BTC Market Forecast Verification: In last week's article, we clearly stated that the market would maintain a consolidation and adjustment pattern, observing the battle between bulls and bears near the channel's lower rail (formed from the February 6th low). The current market movement validates our previous forecast.

I. HYPE: Market Forecast & Short-Term Trading Strategy
1. HYPE Market Forecast for This Week: We believe the current market structure still maintains a daily uptrend. The price is currently in a pullback confirmation phase following the breakout of the Wave I peak (the February 3rd high of $38.41). This week, focus on the effectiveness of the $36~38 support zone. If the pullback confirmation is effective, the market will continue its upward trend.
2. HYPE Short-Term Trading Strategy for This Week:
• Based on the forecast of an upward structure, adhere to the principle of "follow the trend, buy on dips".
• Use the 30-minute/60-minute timeframe as the operational cycle, strictly adhere to stop-loss discipline; utilize 30% of the position, and look for "spread" opportunities based on support and resistance levels.
3. HYPE Upside Risk Warning: Although HYPE's trend is independent, it cannot completely detach from Bitcoin's macro environment. If Bitcoin's trend shows a significant adjustment later, it may affect HYPE's rebound momentum.
II. HYPE: Short-Term Trading Review & Price Structure Deconstruction
1. HYPE Short-Term Trading Review (1x Leverage): (03.23~03.29)
We strictly followed the plan and, combined with trading signals captured by our self-built Spread Trading Model and Momentum Quant Model, executed a short-term (long) operation on HYPE last week, successfully profiting 5.25%.
• HYPE Short-Term Trade Details Summary: (Leverage*1x)

Table 1
• Entry Decision: This entry decision (see Figure 1) was based on meeting three conditions for an upward move. First, we judged that the probability of the previous hourly adjustment ending near endpoint 34 (~$36.79) was high; second, the Spread Quant Model triggered a strong bottom signal (red dot + white dot); third, the Momentum Quant Model issued a bottom divergence signal. Accordingly, we executed a 30% long position entry at $38.23.
• Exit Decision: Based on the Spread Quant Model triggering a top bearish signal (white dot); the Momentum Model issuing a top divergence signal; and the candlestick combination forming a "strong top分型" signal. These three signals formed a technical共振 (resonance), so we executed a full position close near $40.24.
• Trade Summary: This operation successfully profited approximately 5.25%.
HYPE_60-minute Candlestick Chart (Momentum Quant Model + Spread Trading Model):
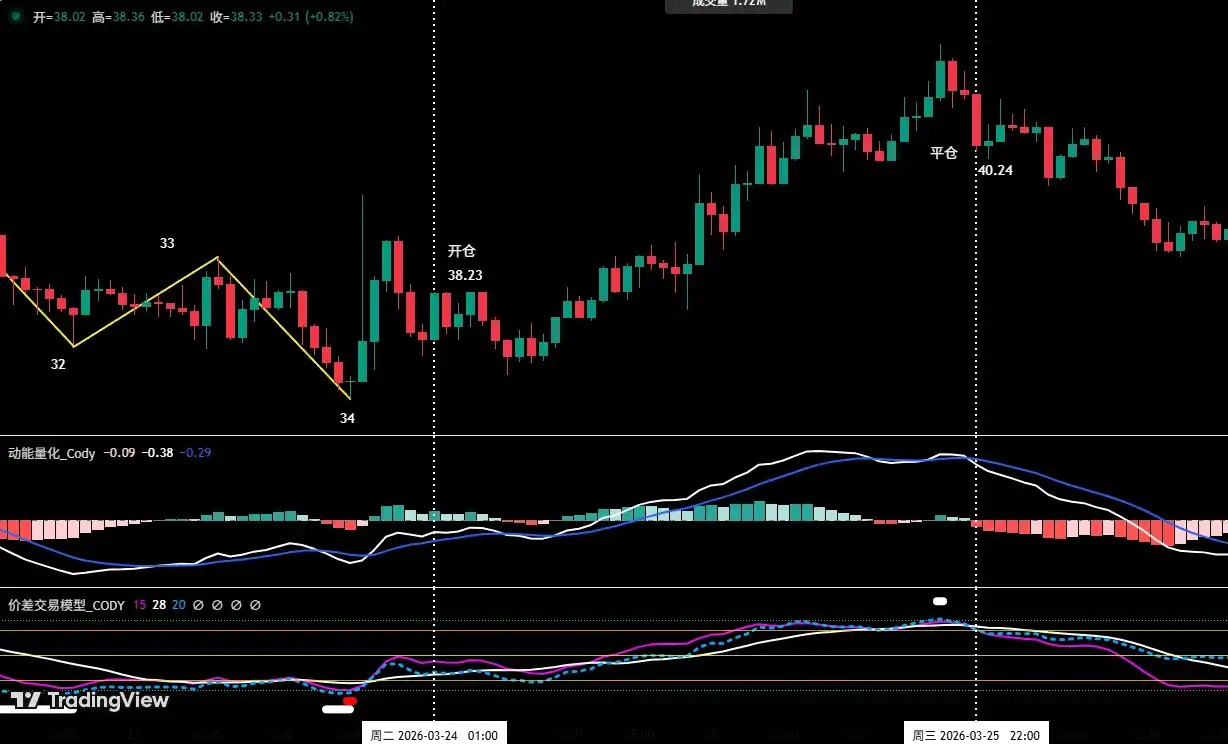
Figure 1 (Short-Term Trade Illustration)
2. In-Depth Analysis of HYPE's Current Price Structure (Using 1-hour as Analysis Period)
• As shown in (Figure 2), reviewing HYPE's hourly movement from the 16th to the 22nd, the price successfully built a下跌中枢 (declining中枢,中枢 C). We initially predicted the low might form near endpoint 32 (~$37.52), but the actual low appeared at the lower endpoint 34 (~$36.79), about $0.73 lower than predicted.
• HYPE Hourly Internal Structure Breakdown Last Week: (03.23~03.29)
a. As shown in (Figure 2), starting from endpoint 34, HYPE's price last week evolved into a complex震荡 structure consisting of 8 segments: 34-35, 35-36, 36-37, 37-38, 38-39, 39-40, 40-41, 41-42. As of the time of analysis, segment 41-42 was in progress.
b. Segments 34-35 constitute the上涨结构 (rising structure).
c. Segments 35-36, 36-37, 37-38, 38-39, 39-40, 40-41, 41-42 constitute the调整结构 (corrective structure). Among them, segments 36-37, 37-38, 38-39, 39-40, 40-41 overlap with each other,共同构建 (jointly forming) a下跌中枢 (declining中枢,中枢 D).
d. The market is currently running the离开段 (exit segment, segment 41-42). As shown in (Figure 2), compared to the进入段 (entry segment, segment 35-36), the exit segment has already shown a momentum背驰 (divergence) signal. If the背驰 signal persists after the exit segment concludes, the probability of the price moving upward is high.
HYPE_1-hour Candlestick Chart:
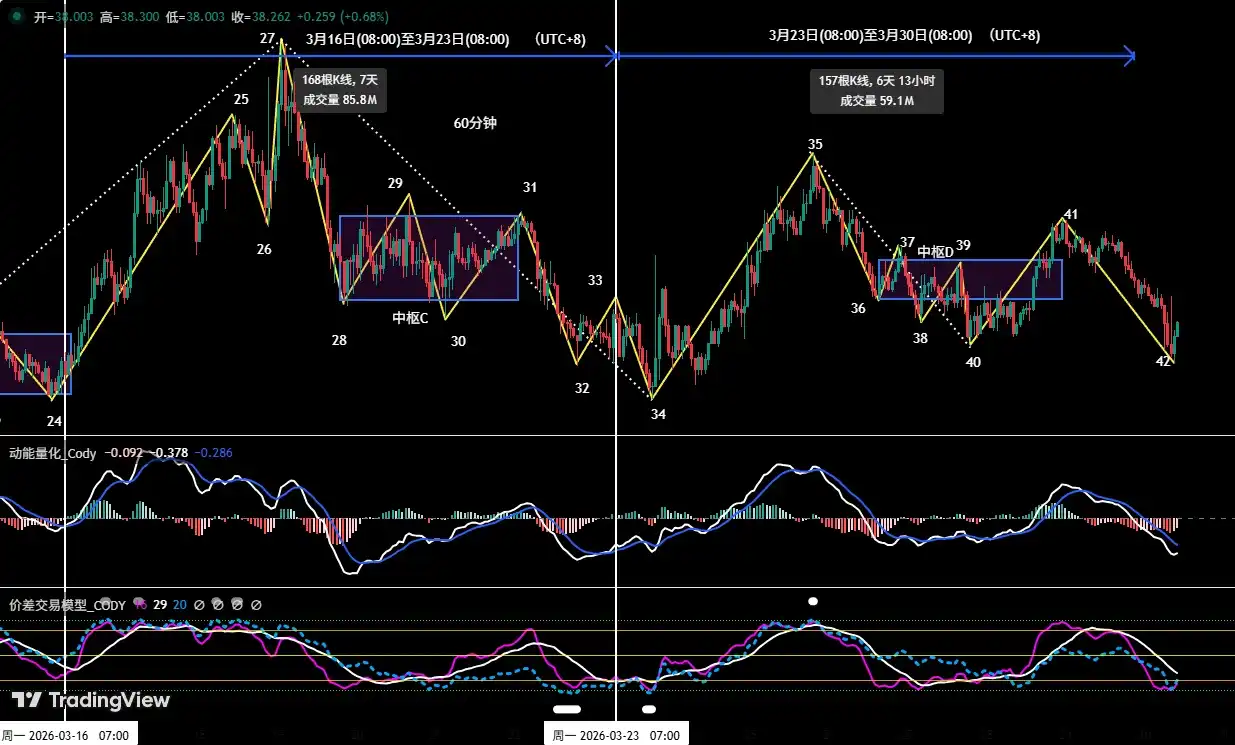
Figure 2
III. Bitcoin: This Week's Market Forecast & Trading Strategy
1. In-Depth Analysis of Bitcoin's Current Price Structure (Using 4-hour as Analysis Period)
• Based on the price action after the February 6th low (~$60,000).
• Maintain the core analytical framework from before: In the February 16th Weekly Review, we clearly stated that the rally starting from the February 6th low was, in nature, a C-2 wave oversold rebound within the larger C-wave correction, to be followed by a C-3 wave corrective行情.
• Condition for C-3 Wave Formation: If the Bitcoin price breaks below the February 6th low (~$60,000), the C-3 corrective wave is confirmed.
• Current BTC Chart Interpretation: As shown in (Figure 3), on the 4-hour chart, Bitcoin effectively broke below the short-term rising trendline formed from the February 24th low last week. It has fallen to near the lower rail of the rising channel formed since the rebound from the February 6th low and is consolidating narrowly around this level. If this level is lost, the market may retest the $60,000 level.
• In-Depth Analysis of BTC Hourly Structure: As shown in (Figure 3), on the 4-hour chart, Bitcoin's pullback from the March 17th high around $76,000 evolved into a 5-segment corrective structure: 13-14, 14-15, 15-16, 16-17, 17-18. Segments 14-15, 15-16, 16-17 form a下跌中枢 (declining中枢,中枢 B). The subsequent离开段 (exit segment, segment 17-18) has fallen to near the rising channel's lower rail. Currently, only the Spread Trading Model has triggered a bottom预警 signal (white dot) at this location. Therefore, the price is showing weak consolidation here, repairing the oversold condition of the 4-hour technical indicators.
Bitcoin _4-hour Candlestick Chart:
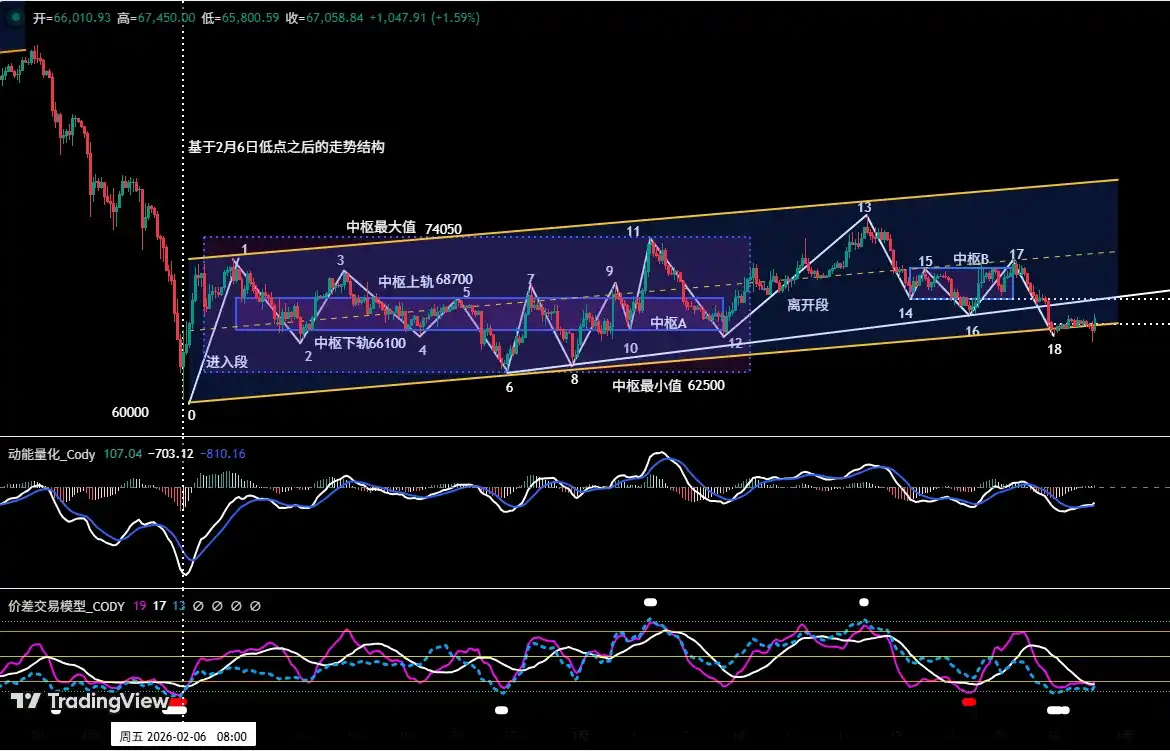
Figure 3
2. Core View This Week: Maintain consolidation and adjustment pattern, observe the battle between bulls and bears near the channel's lower rail (from the Feb 6th low).
3. Core Resistance Levels:
• First Resistance Zone: $69,500~$72,000 area (Previous consolidation range)
• Second Resistance Zone: $74,500~$76,000 area (Near the November 2025 low)
4. Core Support Levels:
• First Support Level: $65,000~$66,000 area (Previous important support zone)
• Second Support Level: $60,000~$62,500 area (Near the February 6th low)
• Third Support Level: Near $57,400
5. Trading Strategy This Week (Excluding Impact of Sudden News):(03.30~04.05)
1. Medium-Term Strategy:
Bitcoin _ Daily Candlestick Chart: (Position Monitoring Model)
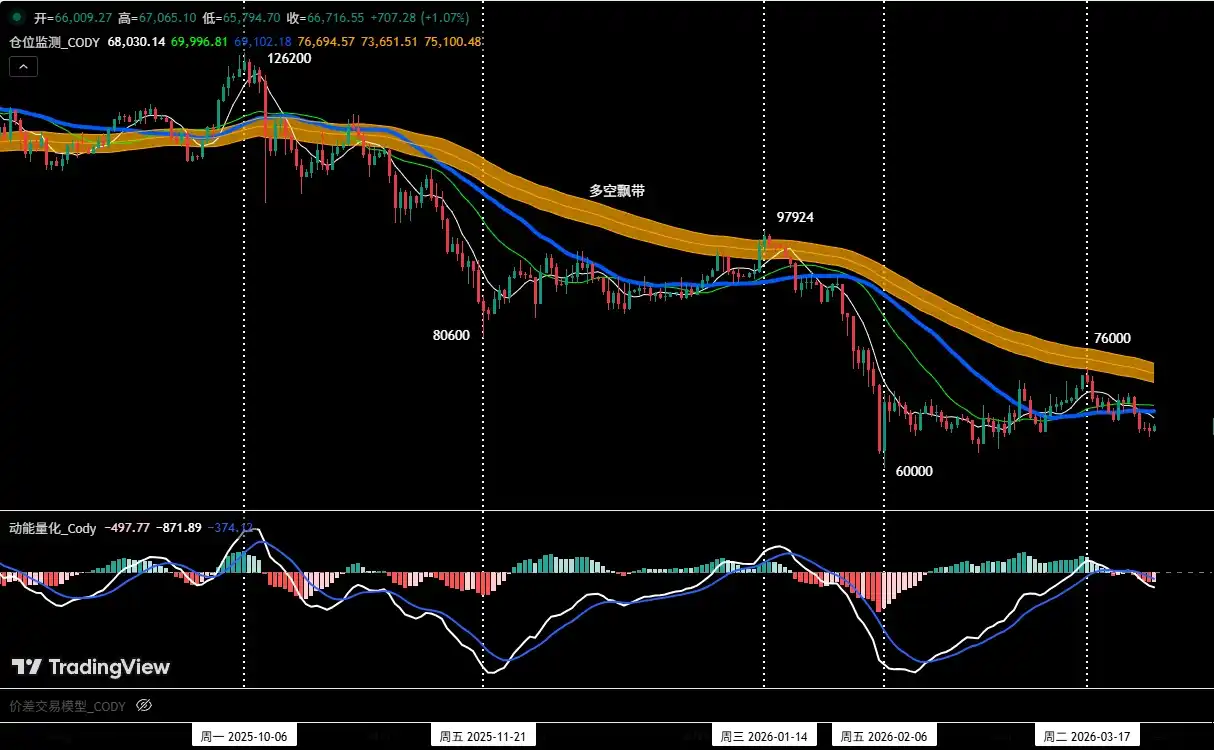
Figure 4
Position Monitoring Model: As shown in (Figure 4), currently the price is below the Bull-Bear Ribbon (yellow), and the bearish trend continues. Following the strategy rules, we continue to hold the 60% short position established at $89,000 (January 28th). If the price反弹 (rebounds) and effectively breaks above and stabilizes above the Bull-Bear Ribbon, the medium-term position will be fully closed.
2. Short-Term Strategy: Utilize 30% of the position, set stop-loss points, and look for "spread" opportunities based on support and resistance levels. (Use 30-minute/60-minute as the operational cycle).
3. Based on the forecast of a medium-term bearish trend, the current operating principle should be "follow the trend and go short". To dynamically respond to the market's complex evolution and combined with signals from our self-built trading models, we will formulate two short-term operational plans A/B:
• Plan A: Rebound meets resistance, sell high on rallies.
• Entry: When the price rebounds to the $69,500~$72,000 area, triggers a rejection signal, and combines with model top signals, a 30% short position can be established.
• Risk Control: Initial stop-loss for short positions set above $74,500.
• Exit: When the price falls near important support levels and combines with model signals, gradually close the position to take profits.
• Plan B: Follow-through breakdown short.
• Entry: When the price effectively breaks below the $65,000~$66,000 area and combines with model top signals, a 30% short position can be established顺势 (following the trend).
• Risk Control: Initial stop-loss for the short position set above $67,500.
• Exit: When falling to support levels and combining with model signals, gradually close the position to take profits.
IV. Bitcoin: Trading Review
1. Short-Term Trading Review: (See Table 2)
We strictly followed the operational plan and, based on trading signals issued by our self-built Spread Trading Model and Momentum Quant Model, completed one short-term (short) operation last week, achieving a trading profit of 6.17%.
1. Bitcoin Short-Term Trade Details Summary: (Leverage*1x)
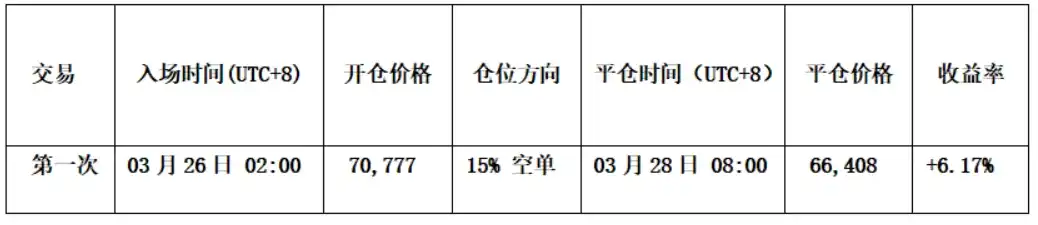
Table 2
2. Short-Term Trade Review: (See Figure 5)
• Entry: When the price rebounded near $72,000 and met resistance, the Spread Trading Model simultaneously triggered a top预警 signal (white dot), forming a short-selling共振 (resonance) with the Momentum Quant Model. Based on this signal叠加 (overlay), we established a 15% short position at $70,777.
• Exit: When the price fell near $65,000 and stabilized, and the Spread Trading Model triggered a strong bottom预警 signal (red dot + white dot), we therefore closed the entire position near $66,408.
• Summary: This trade successfully profited approximately 6.17%.
Bitcoin _60-minute Candlestick Chart: (Momentum Quant Model + Spread Trading Model)
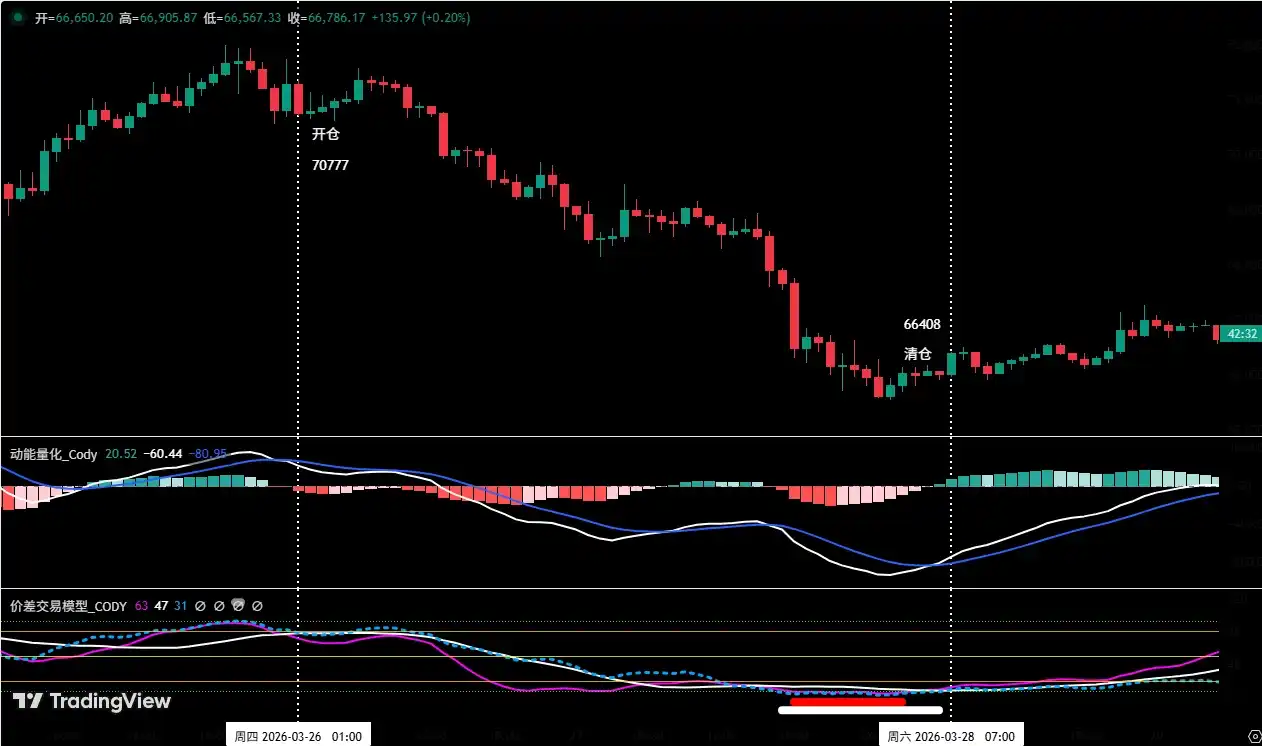
Figure 5 (Short-Term Trade Illustration)
2. Medium-Term Trading Review:
Medium-Term Strategy: Continue holding the 60% short position established near $89,000 (January 28th). As of last week's post-market close (closing price ~$66,962), the profit is approximately 24.76%.
V. Special Notes:
1. When opening a position: Immediately set the initial stop-loss level.
2. When profit reaches 1%: Move the stop-loss to the entry cost price (breakeven point), ensuring capital safety.
3. When profit reaches 2%: Move the stop-loss to the 1% profit level.
4. Continuous tracking: Thereafter, for every additional 1% profit the price makes, move the stop-loss up 1%同步 (synchronously), dynamically protecting and locking in profits.
Financial markets change rapidly; all market analysis and trading strategies require dynamic adjustment. All views, analytical models, and operational strategies involved in this article are derived from personal technical analysis, intended solely for personal trading log purposes, and do not constitute any investment advice or basis for operation. The market involves risks, investment requires caution. Please do not make decisions based on this.





















