Bitcoin (BTC) starts the last full week before Christmas threatening to lose $90,000 support.
Bitcoin traders brace for range-bound trading with the price stuck without catalysts.
The new year bear flag is causing some to see a bullish outcome for the current BTC price consolidation.
CPI and unemployment lead an important week of US macro data.
Derivatives markets are pricing out risk for the medium term after a predictable Fed rate cut.
Short-term holders give further signs of a market reset now underway.
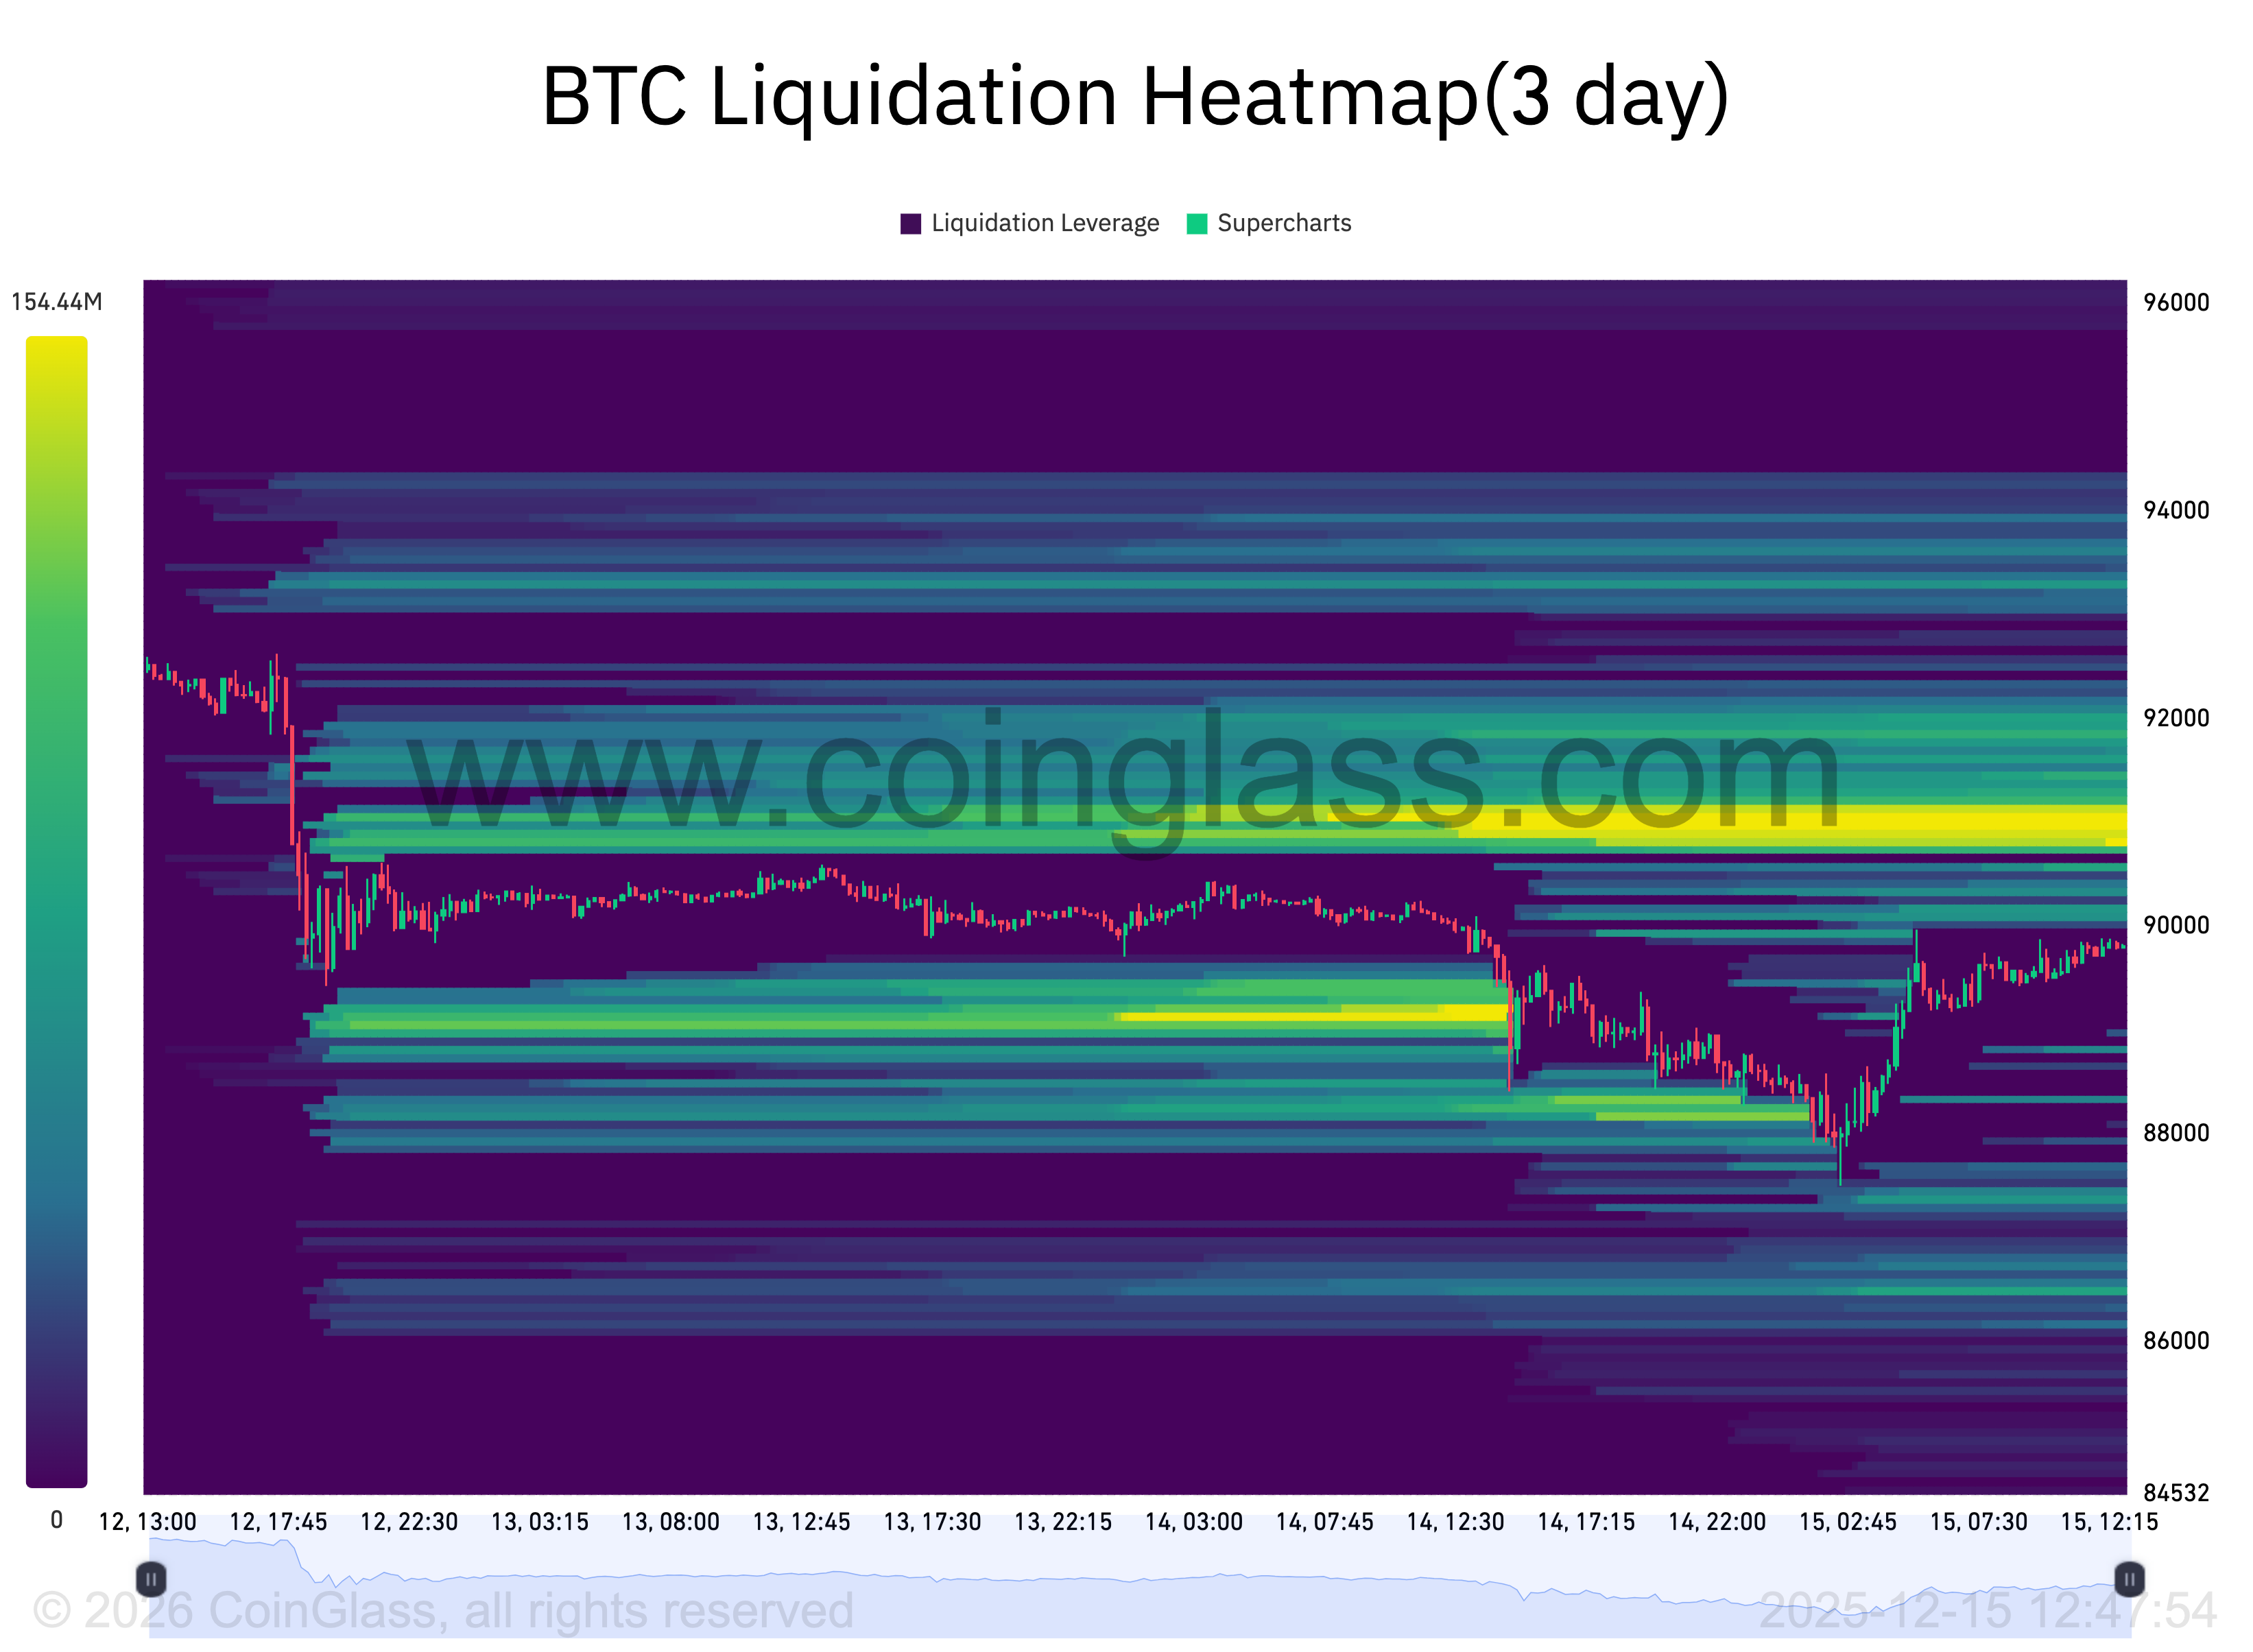
$95,000 in focus for Bitcoin liquidity grab
On spot markets, Bitcoin offers traders little security, sticking in a frustratingly narrow range, per data from Cointelegraph Markets Pro and TradingView.
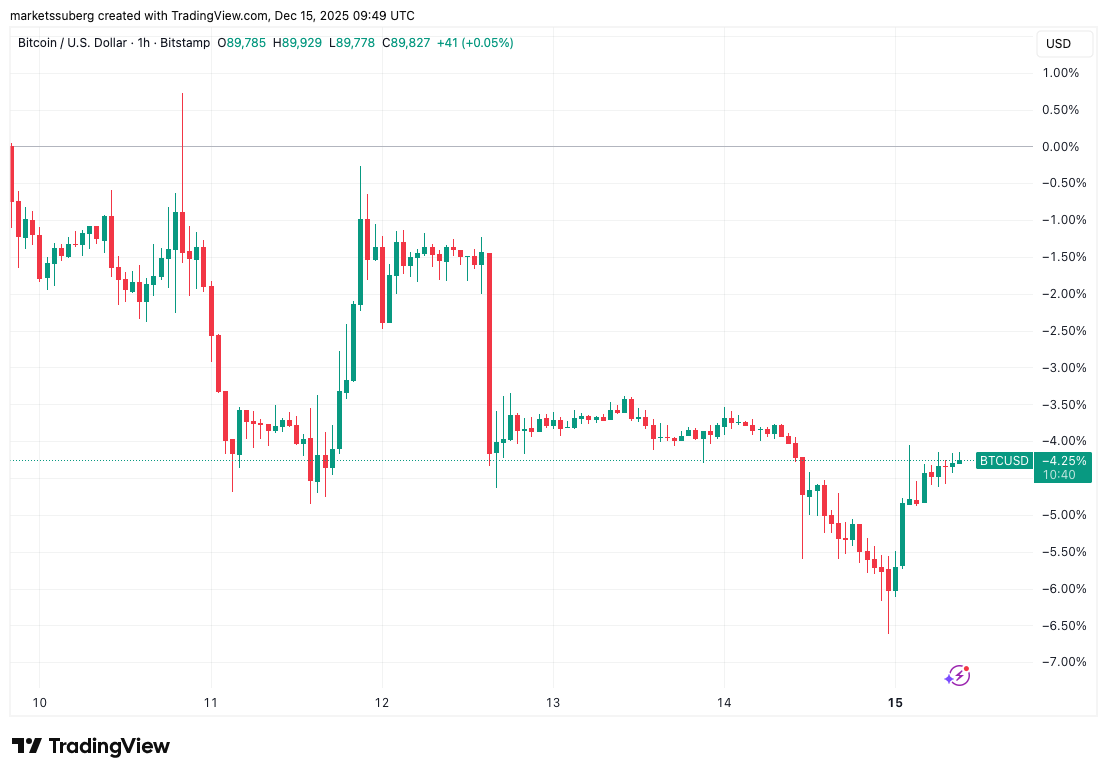
As the Christmas holiday period nears, market participants are demanding clearer signals before taking sides.
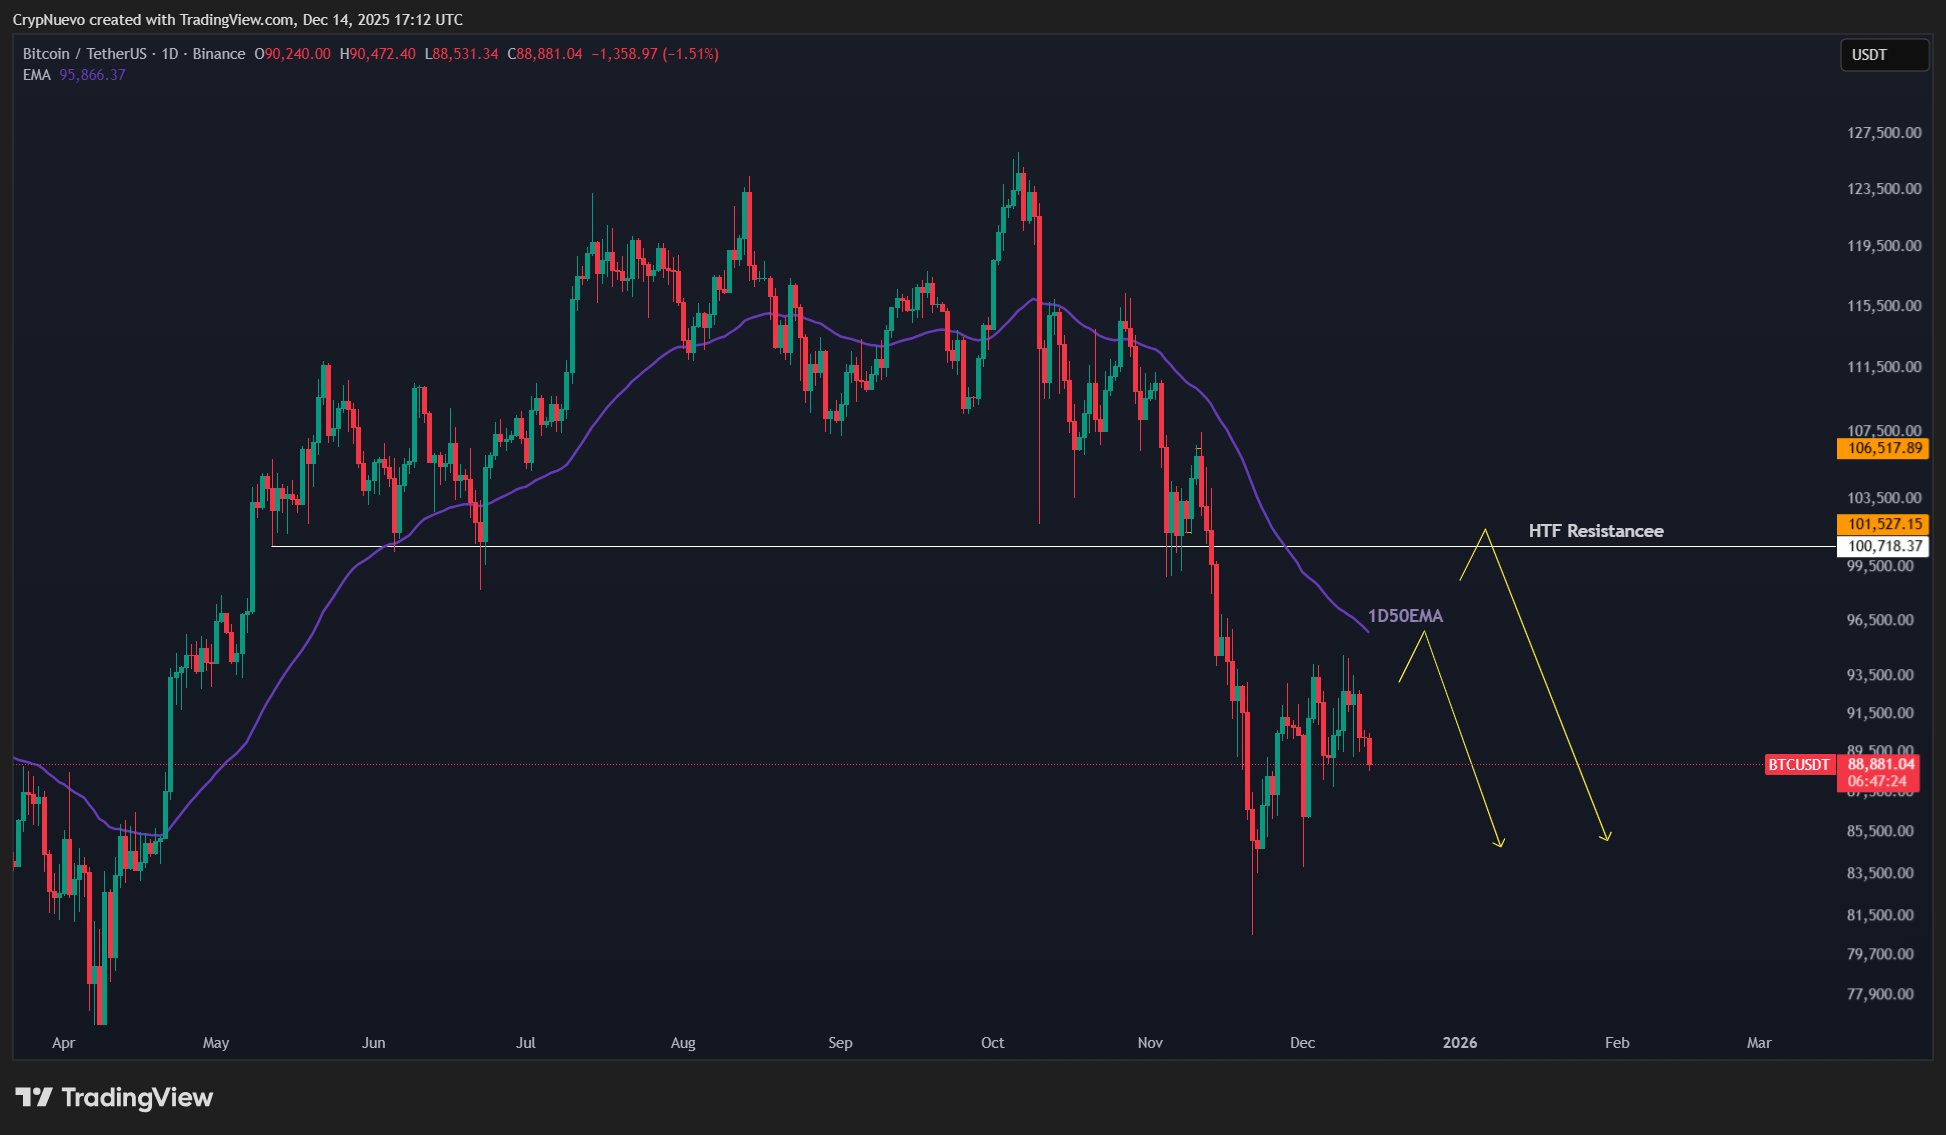
“This really looks like a range and it's trading like one,” trader CrypNuevo wrote in a dedicated X thread on BTC price action Sunday.
CrypNuevo identified $80,000 and $99,000 as the extremes of the new range while anticipating a trip to one end or the other “soon.”
“There are some more liquidations in the upper side around the 1D50EMA ($95.5k) which makes it a bit more likely to tag this zone first,” he noted, referring to the 50-day exponential moving average.
The latest data from monitoring resource CoinGlass underscored the potential significance of the $95,000 zone as a short-term price magnet on the day.
Exchange order-book liquidity, having seen a sweep of bids overnight, was now primed to put shorts in the firing line.
“The amount of liquidity between the 95K and 98K region is shining brighter than the sun,” analyst Mark Cullen told X followers.
Cullen suggested that a large player could artificially send the price higher in order to execute a sizeable sell order.
For crypto trader, analyst and entrepreneur Michaël van de Poppe, meanwhile, it was $90,000 that held the key to short-term direction.
“If that $90K area breaks, I think we'll see some fast moves to $92-94K, which increases the chances of a quick breakout to $100K,” he wrote.
“However, if this $90K still holds up as resistance, there's a chance we'll go substantially lower. Important week!”
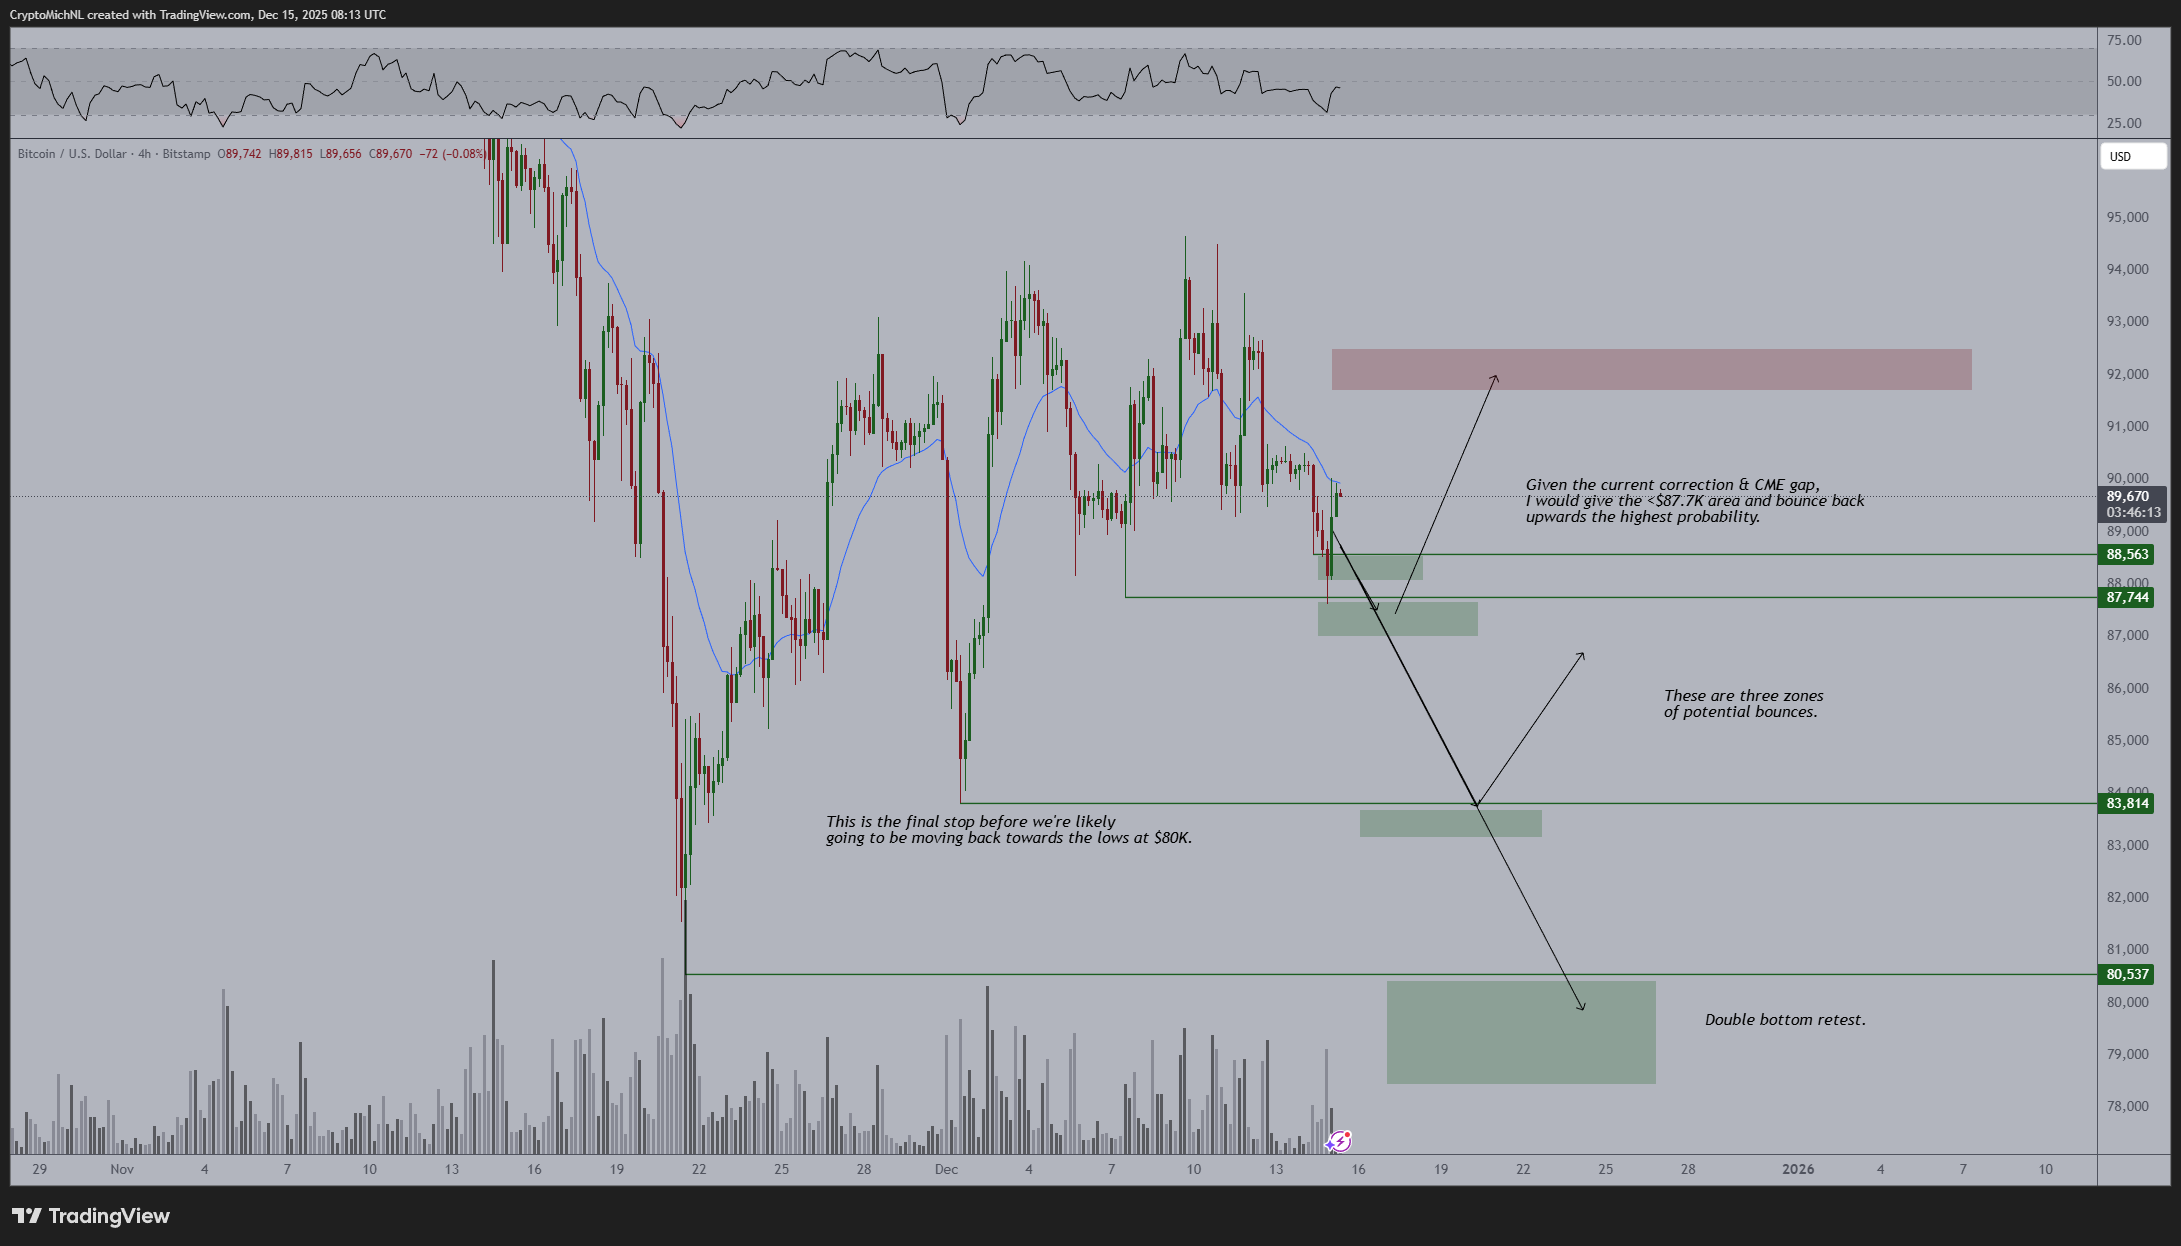
As Cointelegraph reported, downside BTC price forecasts include a return to levels closer to $50,000.
Bear flag debate continues
When it comes to BTC price chart features, traders are watching one in particular as 2025 comes to an end.
The bear flag playing out on daily timeframes has led to increasing consensus that current price action is just a relief bounce within a broader downtrend. Once it breaks, new lows are due.
“Let the drop to 76k begin. Bear divs + bear price action proving their worth,” trader Roman wrote in part of an X post on the topic last week.
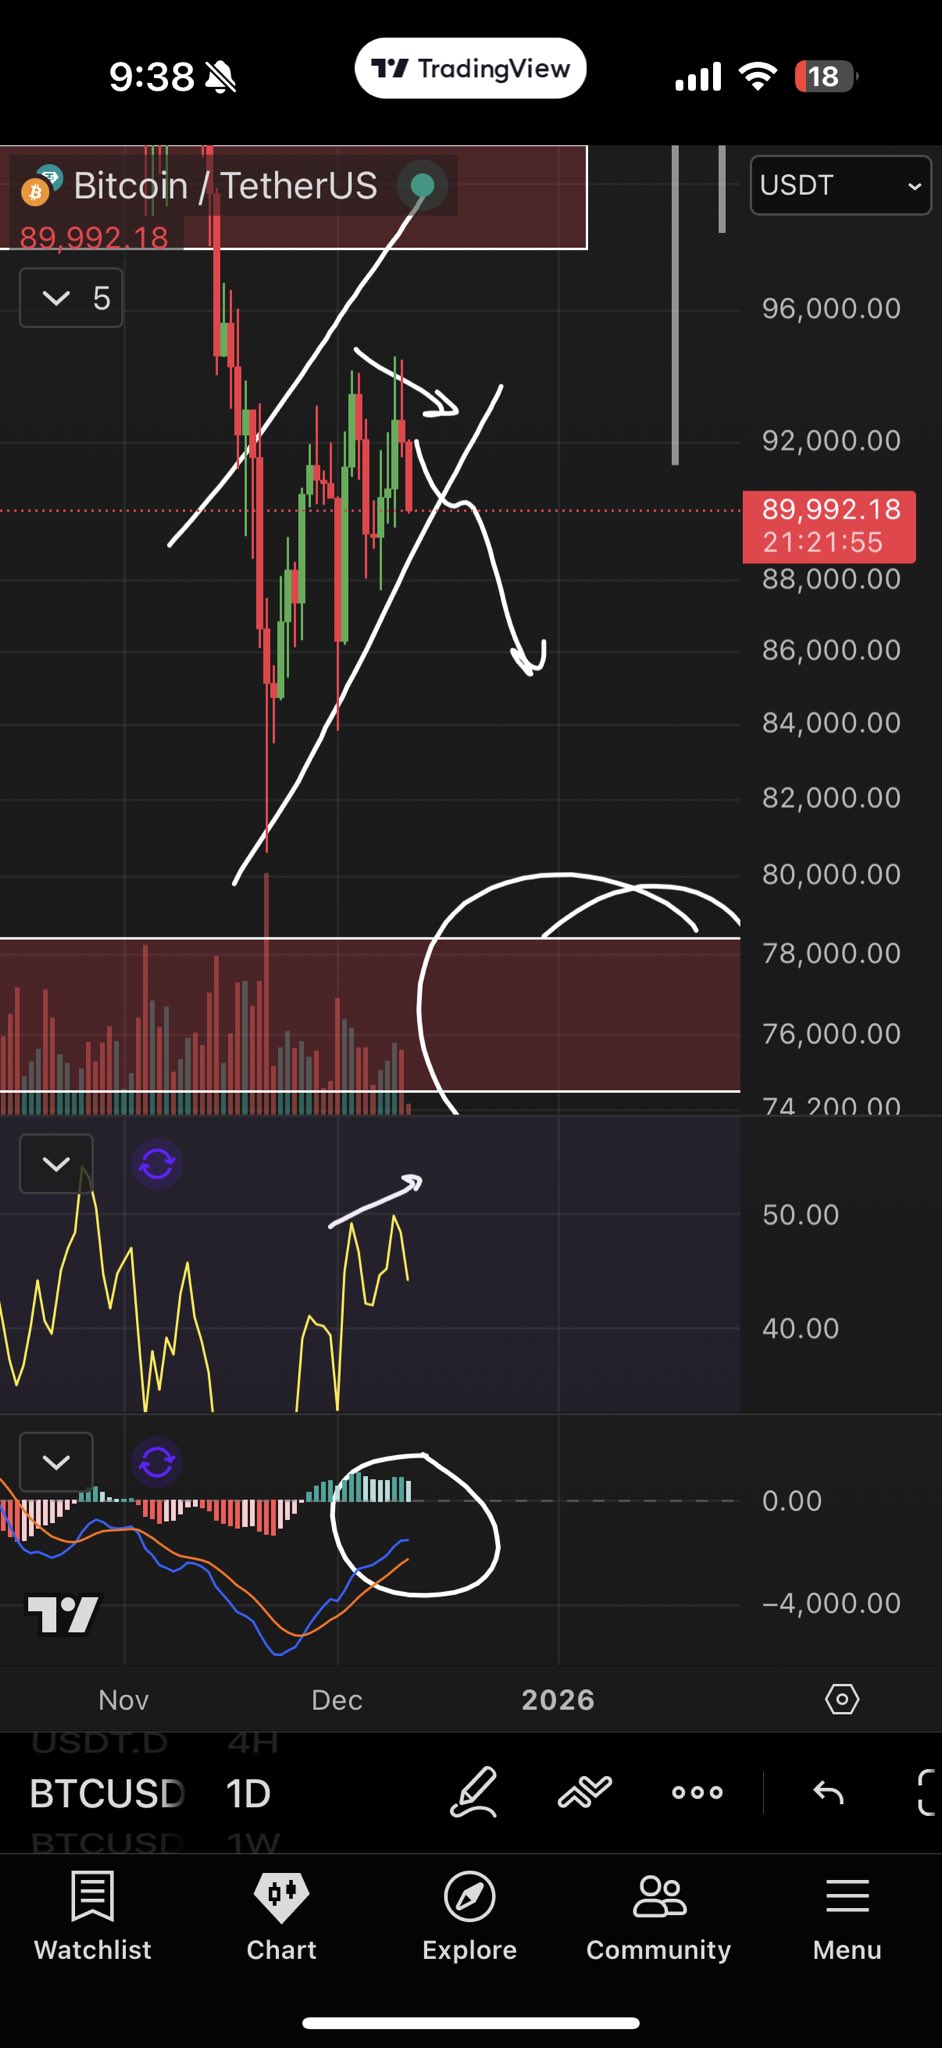
Not everyone, however, believes that the pattern will leave sellers in control.
“This bear flag and measured move is unlikely to play out,” trader SuperBro argued Monday.
“Instead, I expect a higher low or a shallow sweep like we saw in April.”

SuperBro referred to BTC price performance in the aftermath of the US trade tariff implementation, which saw a trip below $75,000 before a multimonth rebound.
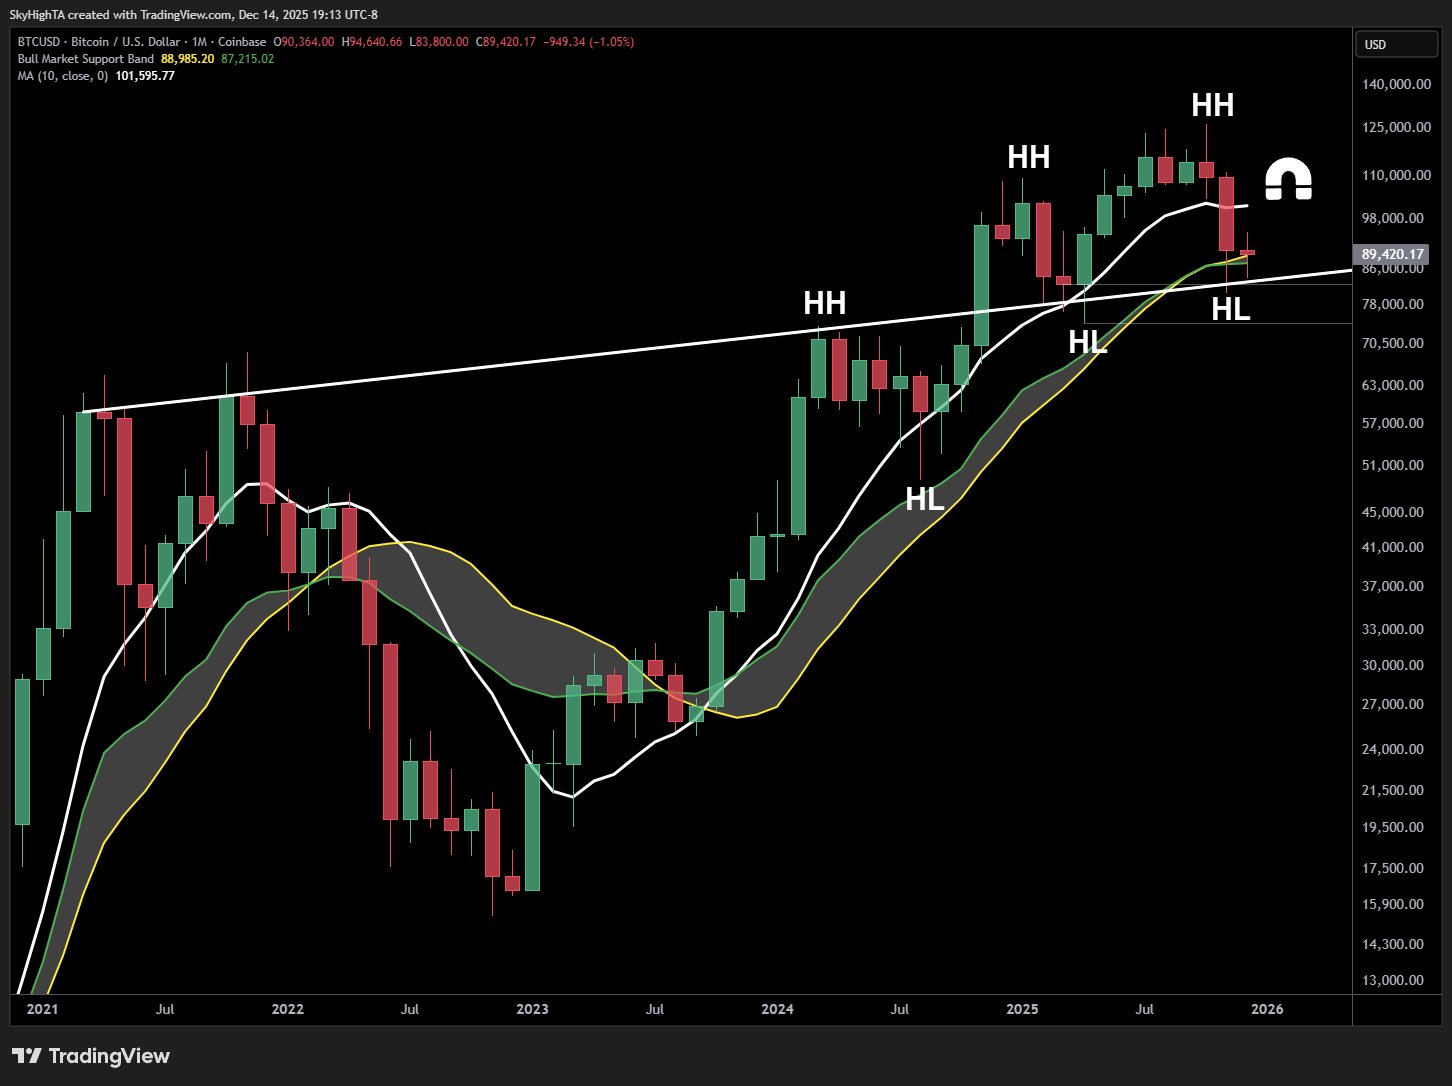
Higher lows are also on the radar for the monthly chart. SuperBro eyed a potential reversal structure already in play, questioning the idea that Bitcoin is at the start of a new bear market despite its 30% drop from all-time highs.
“Many are convinced this is the start of a painful bear, but the monthly chart supports my base case of a prolonged bull cycle,” he commented.
Macro data makes a comeback
A deluge of US macroeconomic data is set to round out the last full week before Christmas.
Unemployment data will lead the line-up of figures to watch for risk-asset traders, with the Consumer Price Index (CPI) print following on Thursday.
Both will include unreleased data from during the government shutdown, giving an insight into economic trends that traders and policymakers have lacked for months.
“A massive backlog of economic data is coming this week,” trading resource The Kobeissi Letter summarized on X.
“Mass amounts of economic data from the government shutdown have officially arrived.”
Key Events This Week:
— The Kobeissi Letter (@KobeissiLetter) December 14, 2025
1. October Retail Sales data - Tuesday
2. November Jobs Report - Tuesday
3. November CPI Inflation data - Thursday
4. December Philly Fed Manufacturing Index - Thursday
5. October PCE Inflation data - Friday
6. November Existing Home Sales data -...
The releases come as the Federal Reserve begins to expand liquidity after officially ending its latest round of quantitative tightening (QT) at the end of November.
Interest rates also continue to drop despite inflation remaining above the Fed’s notional 2% target. All this, says analysis, points to an ideal mix of catalysts for risk assets.
“The boost to liquidity is also coinciding with solid economic growth and fiscal stimulus arriving next year due to tax and spending provisions contained in the One Big Beautiful Bill,” trading outfit Mosaic Asset Company wrote in the latest edition of its regular newsletter, “The Market Mosaic.”
“That’s a perfect storm of conditions to keep driving the bull market into the new year. With valuations historically extended, a positive earnings outlook is critical to support additional gains in the stock market.”
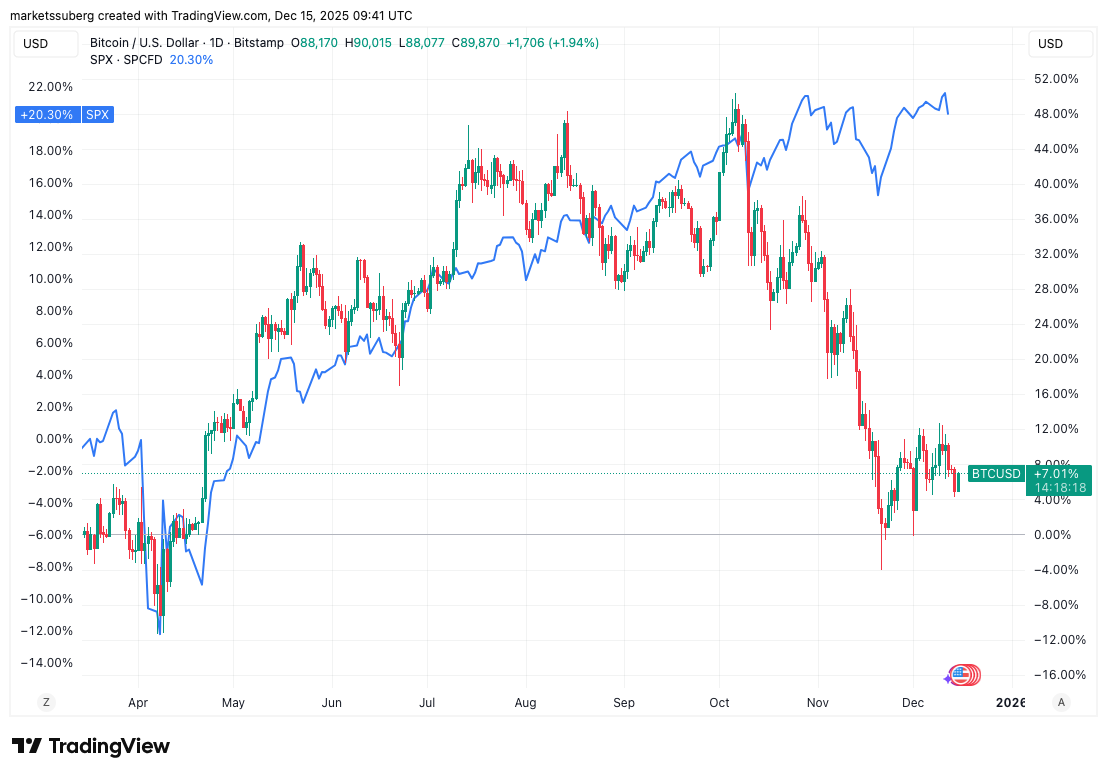
As Cointelegraph reported, crypto has diverged conspicuously from stocks and gold over the past month, failing to capitalize on the latest round of financial easing by central banks worldwide.
Speaking at the White House over the weekend, meanwhile, US President Donald Trump described inflation as being “totally neutralized.”
“We may get it a little bit lower — you don’t want it too [low]. You don’t want deflation; deflation is in many ways worse than inflation,” he said.
Bitcoin options traders lock in post Fed
The Fed move quickly began to impact Bitcoin derivatives markets.
Summarizing the situation at the end of last week, onchain analytics platform Glassnode said that traders were now very much in “wait and see” mode.
“Post FOMC, implied volatility has compressed, but downside remains consistently priced,” an X thread concluded.
“Skew and flow data point to a market expecting limited upside, range bound conditions, and ongoing sensitivity to macro drivers rather than fresh policy catalysts.”
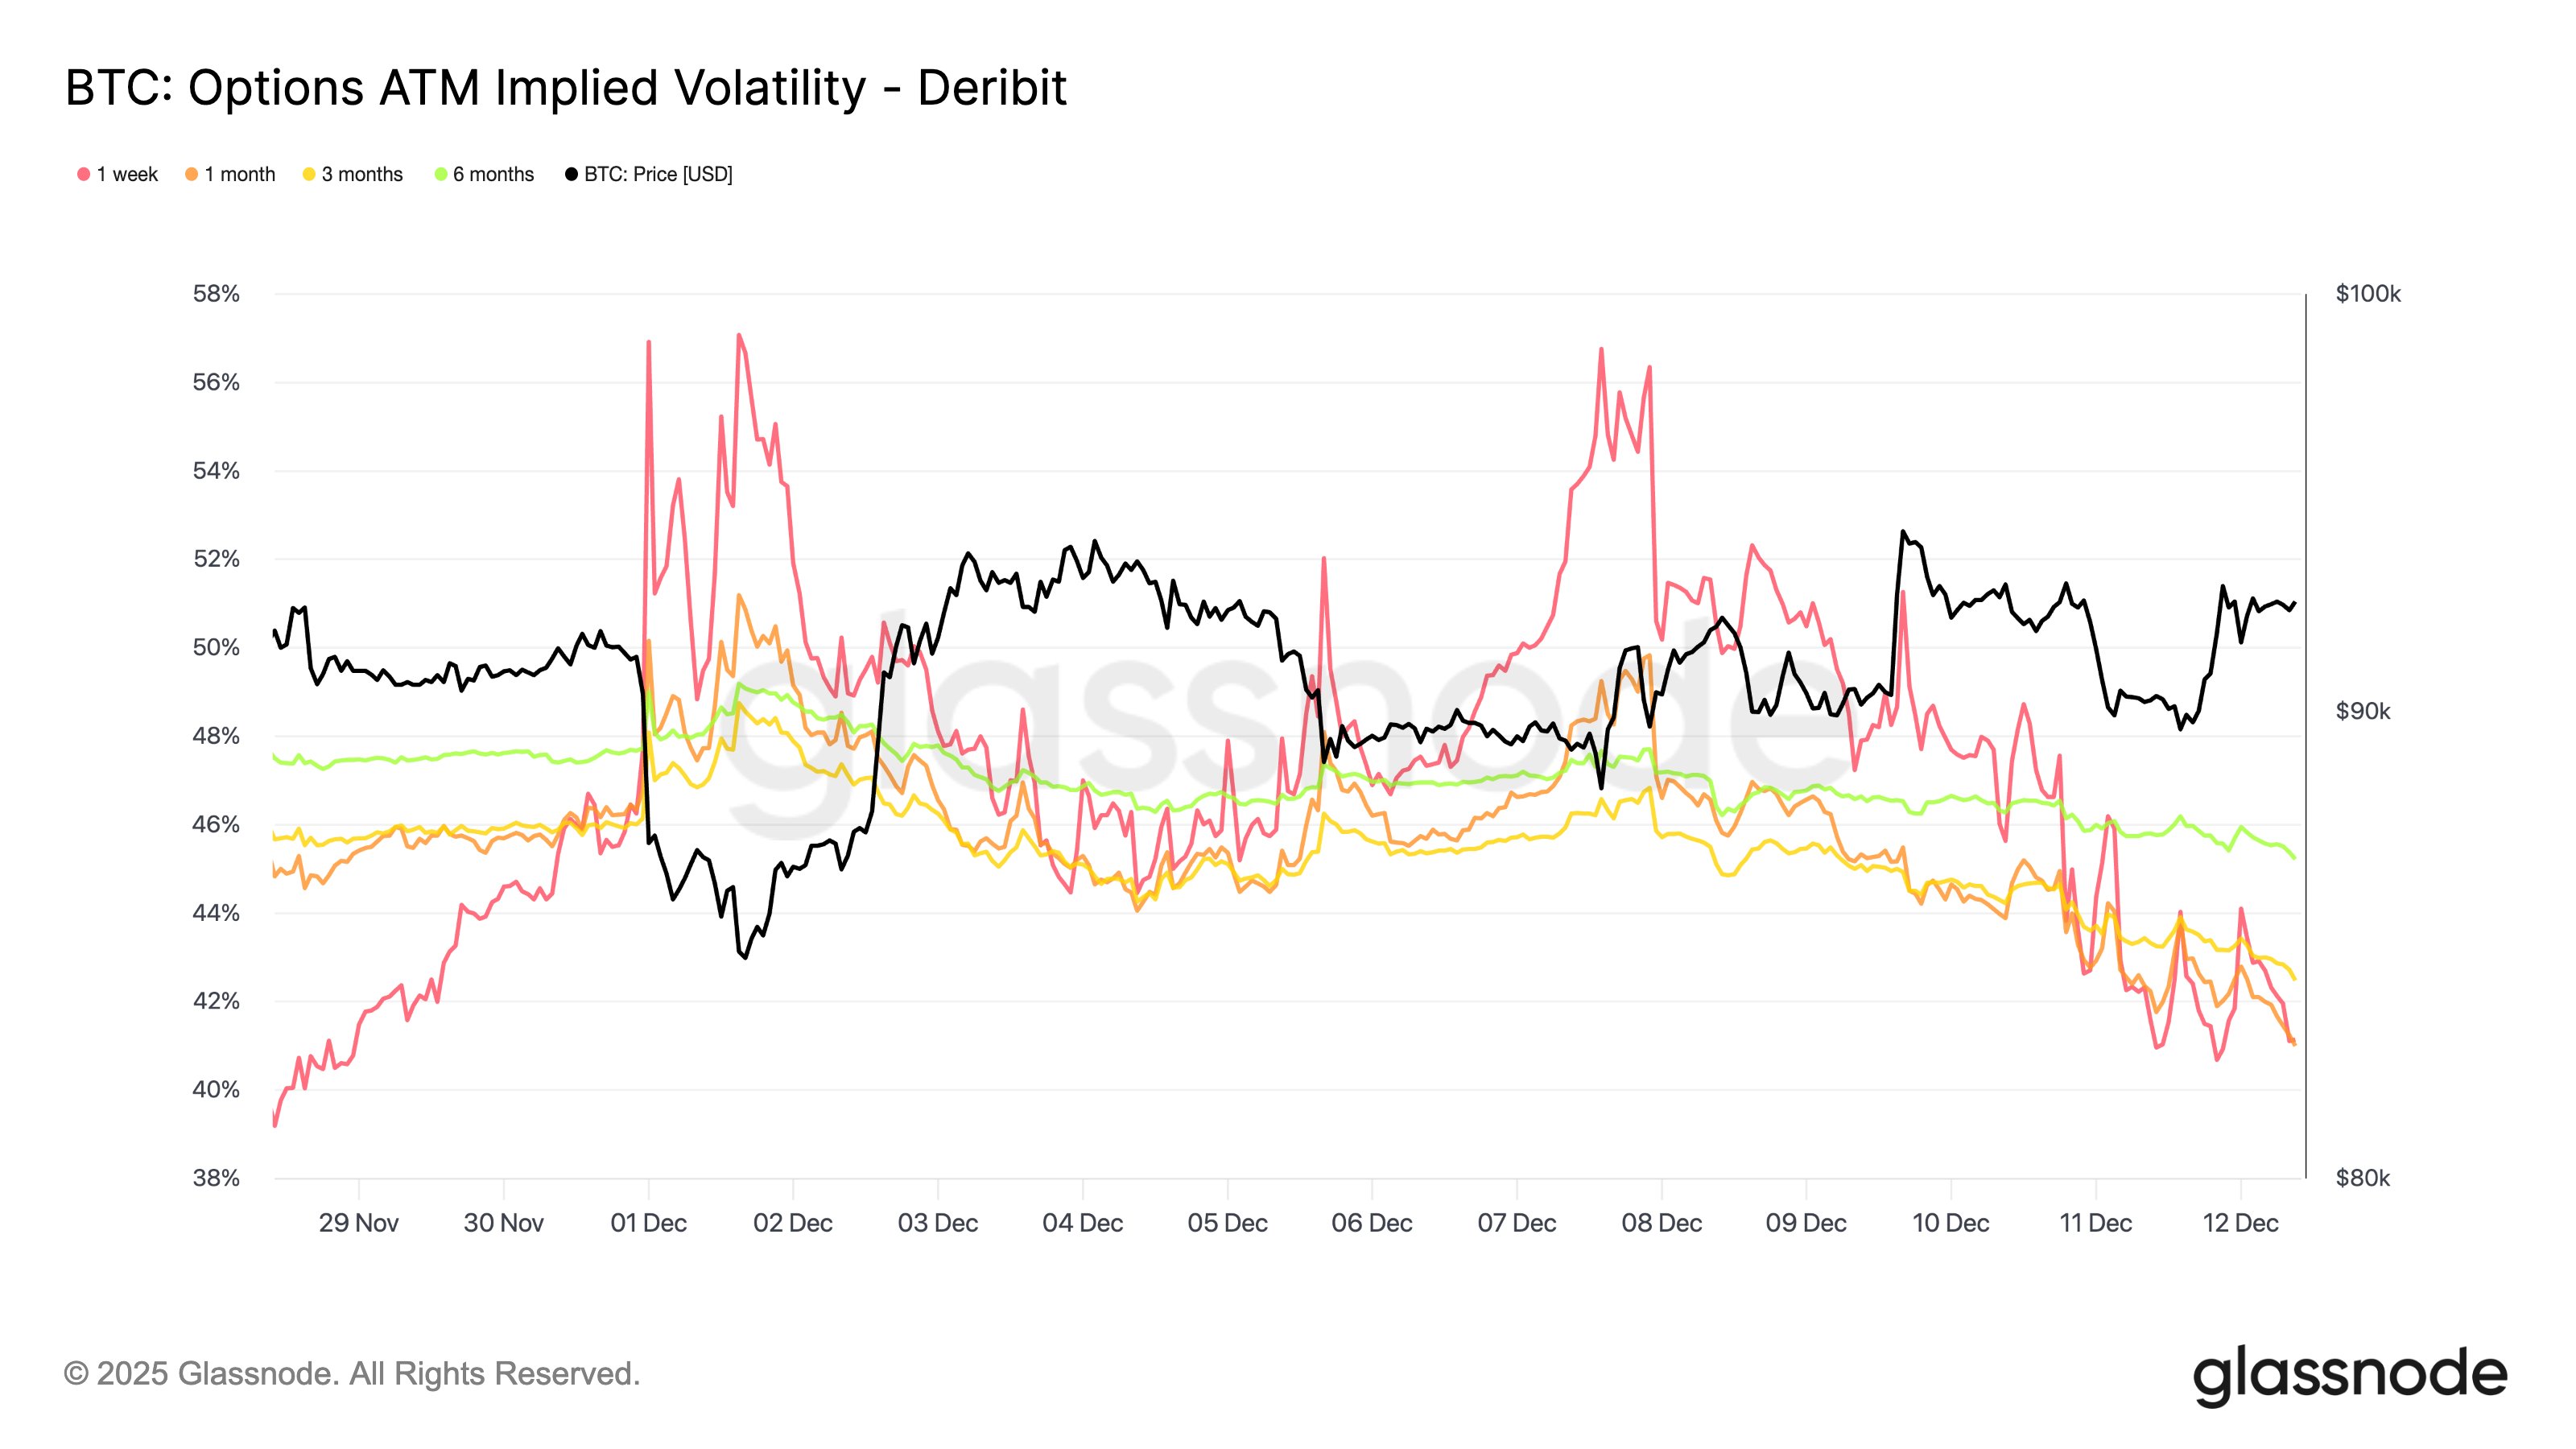
Backing up its forecast was decreasing implied volatility (IV) between weekly and six-month timeframes.
“Lower IV means options price in smaller expected moves. With the policy catalyst behind us, the market is de-pricing uncertainty,” Glassnode explained.
Despite this, concerns over Japanese market stability have led some commentators to warn of volatility making a sweeping return across risk assets.
This Friday, Japan’s central bank is expected to go against the global easing trend and hike interest rates — something that historically has had bearish implications for Bitcoin.
$BTC vs Bank of Japan
— Cryptocium (@Cryptocium_id) December 15, 2025
Over the past 2 years, the Bank of Japan (BoJ) has executed multiple rate hikes, a structural shift after 17 years of ultra-low rates, pushing them to levels last seen during the 2008 financial crisis.
Historically, each BoJ hike triggered a retracement... pic.twitter.com/mbkvNC3D3o
Speculators in Bitcoin market cleanse
Bitcoin speculators are capitulating at a rate not seen since late 2023, “setting the stage” for a market comeback.
Related: Michael Saylor hints at next Bitcoin buy as BTC falls below $88K
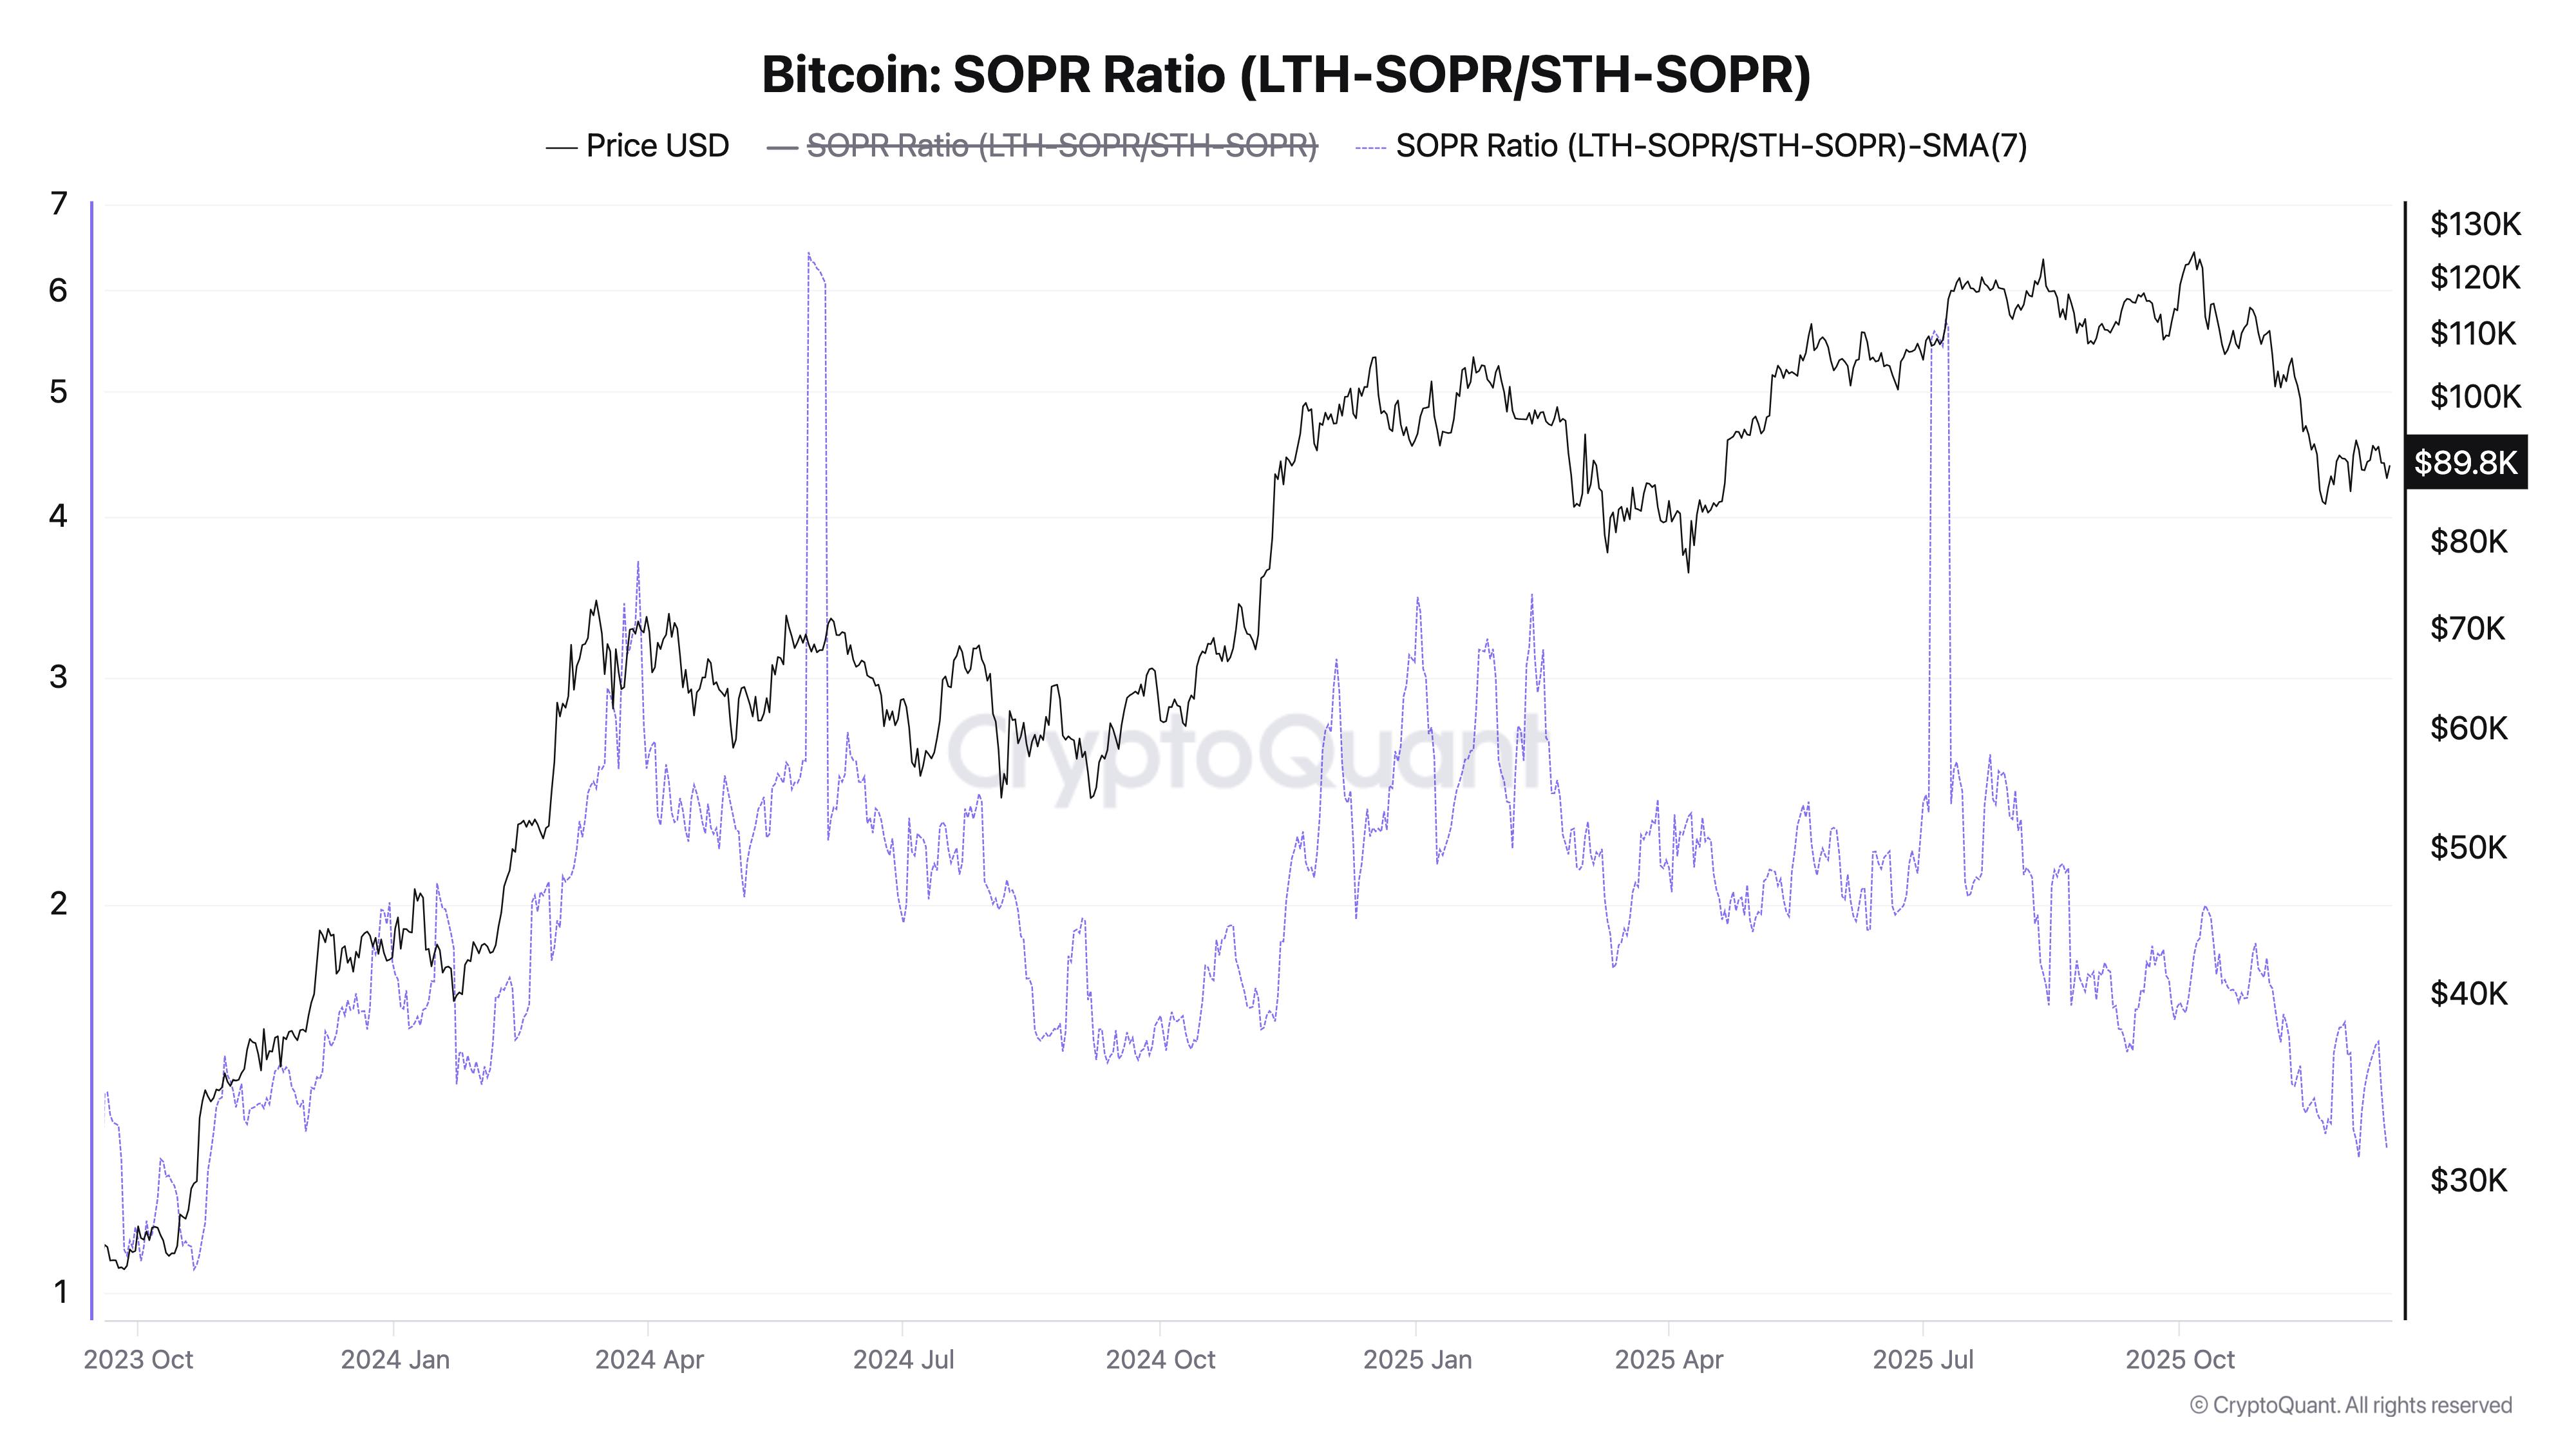
In one of its latest market insights, onchain analytics platform CryptoQuant revealed two-year lows in the ratio of loss-making onchain transactions originating from long-term (LTH) and short-term (STH) holders.
A “ratio of a ratio,” the data stems from the spent output profit ratio (SOPR) metric, which measures the extent to which coins moving onchain are doing so in profit or loss.
When STH-based onchain losses become noticeably more common than those of LTHs, it can signal that a flush-out of speculative activity is underway.
The SOPR Ratio hit 1.29 in recent days, marking lows not seen since BTC/USD began to rise for its Q3 2023 bull run. At the time, BTC/USD traded at around $30,000.
“This sharp drop signals that short-term holders (STH) are realizing heavy losses relative to long-term holders (LTH), who are largely holding firm and spending minimal profits (or even losses),” CryptoQuant contributor NovAnalytica commented.
“Historically, such extreme lows in the ratio have coincided with major capitulation phases for speculative participants – often clearing out weak hands and setting the stage for a market rebound.”
Last week, Cointelegraph reported on STHs’ ongoing battle to avoid complete capitulation as the cohort’s cost basis becomes a key focus.
This article does not contain investment advice or recommendations. Every investment and trading move involves risk, and readers should conduct their own research when making a decision. While we strive to provide accurate and timely information, Cointelegraph does not guarantee the accuracy, completeness, or reliability of any information in this article. This article may contain forward-looking statements that are subject to risks and uncertainties. Cointelegraph will not be liable for any loss or damage arising from your reliance on this information.