Assessing Sonic’s [S] 12% price drop and why more selling may be next

ambcrypto发布于2026-06-26更新于2026-06-26

文章摘要

Sonic (S) has dropped 12% in 24 hours, with further declines anticipated. Despite a notable 23% surge in daily active users and over 228,000 on-chain transactions, key metrics suggest selling pressure is driving the activity. Total Value Locked (TVL) fell by $4.47 million to around $16.07 million, indicating capital outflows. While DEX volume spiked to $3.27 million and overall trading volume rose 51% to $26.8 million, this high volume alongside a falling price points to dominant selling momentum. Spot market data shows slight positive net inflows of about $20,000, hinting at minor accumulation, but this buying pressure is currently insufficient to counter the selling or fuel a near-term price recovery.

Sonic SVM [S] has shed 12% of its value over the past 24 hours in one of the steepest losses across the market. That’s not all though as at press time, the decline looked likely to extend further as the week wears on.

A convergence of off-chain and on-chain metrics seemed to build the case for a deeper drop. Hence, investors may have to offload more of their S holdings at discounted prices.

Sonic’s users and on-chain activity surge in tandem

On-chain activity across the Sonic blockchain has spiked notably over the past week, with two metrics standing out in particular—Daily Active Users (DAU) and the volume of chain transactions.

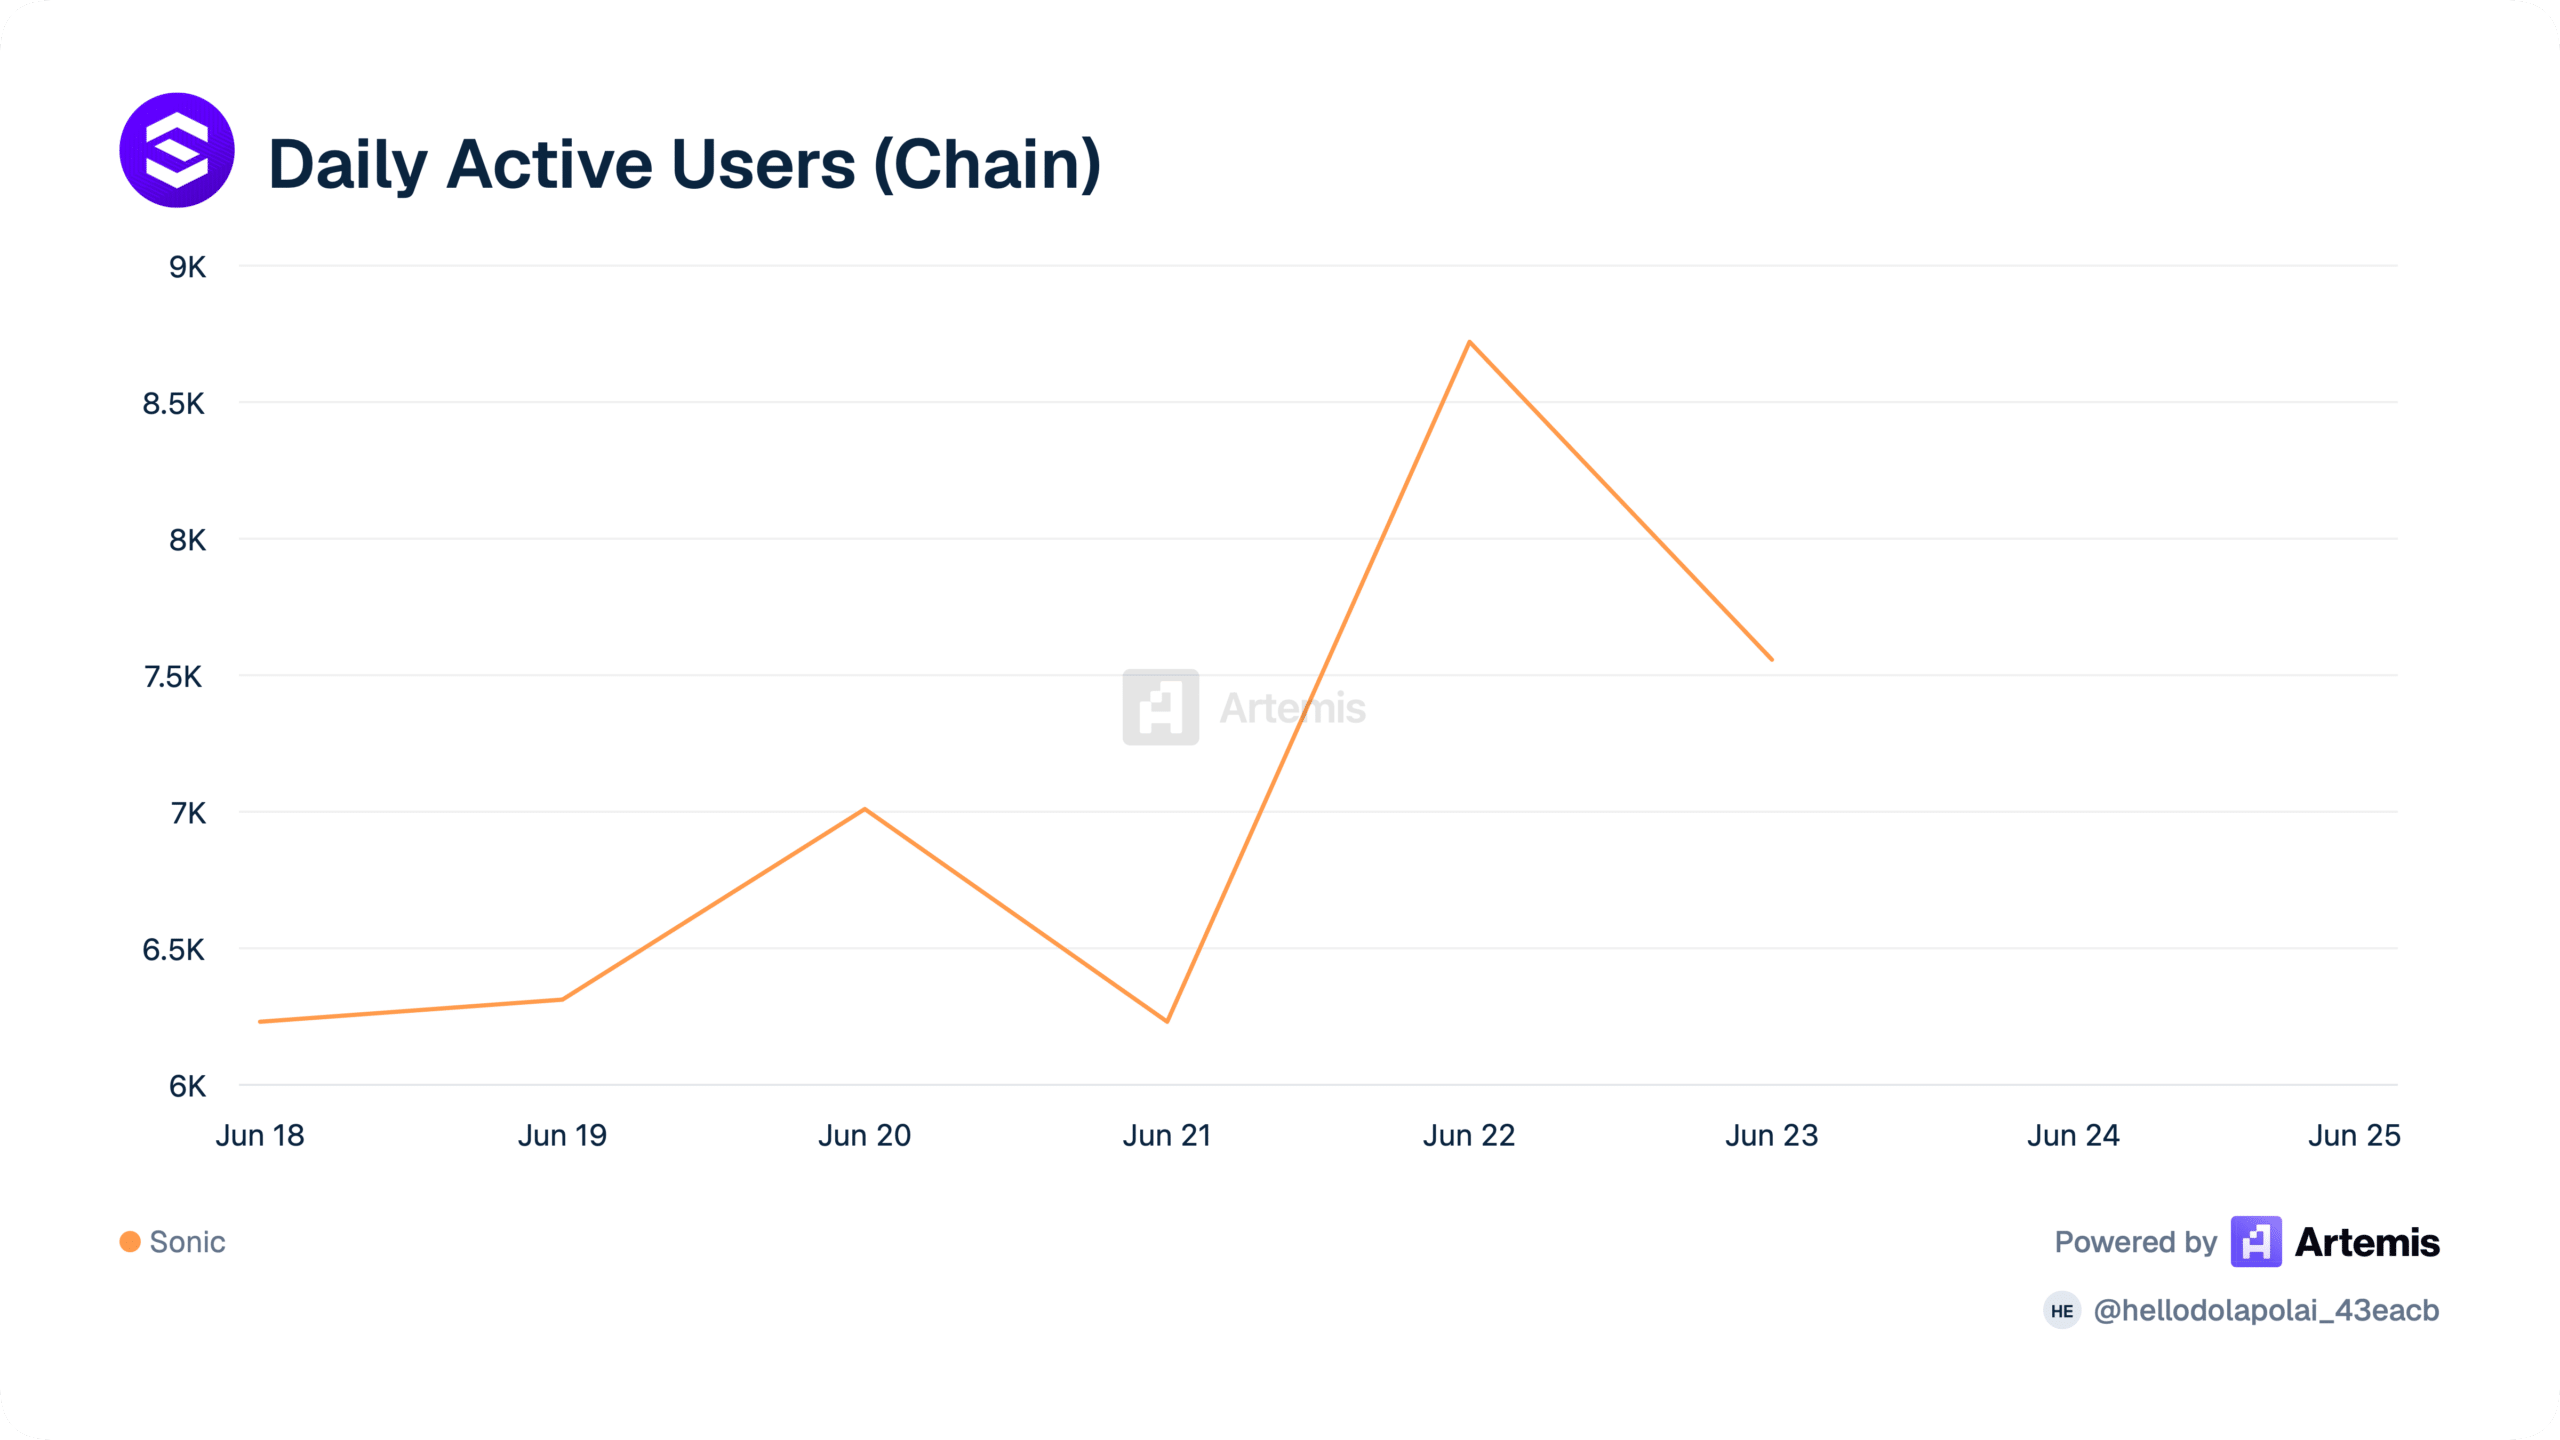
At the time of writing, the data revealed a clear surge in users on the network, with the count climbing week-over-week from 6,200 to 7,600. This hinted at an increase of roughly 22.6% in just seven days.
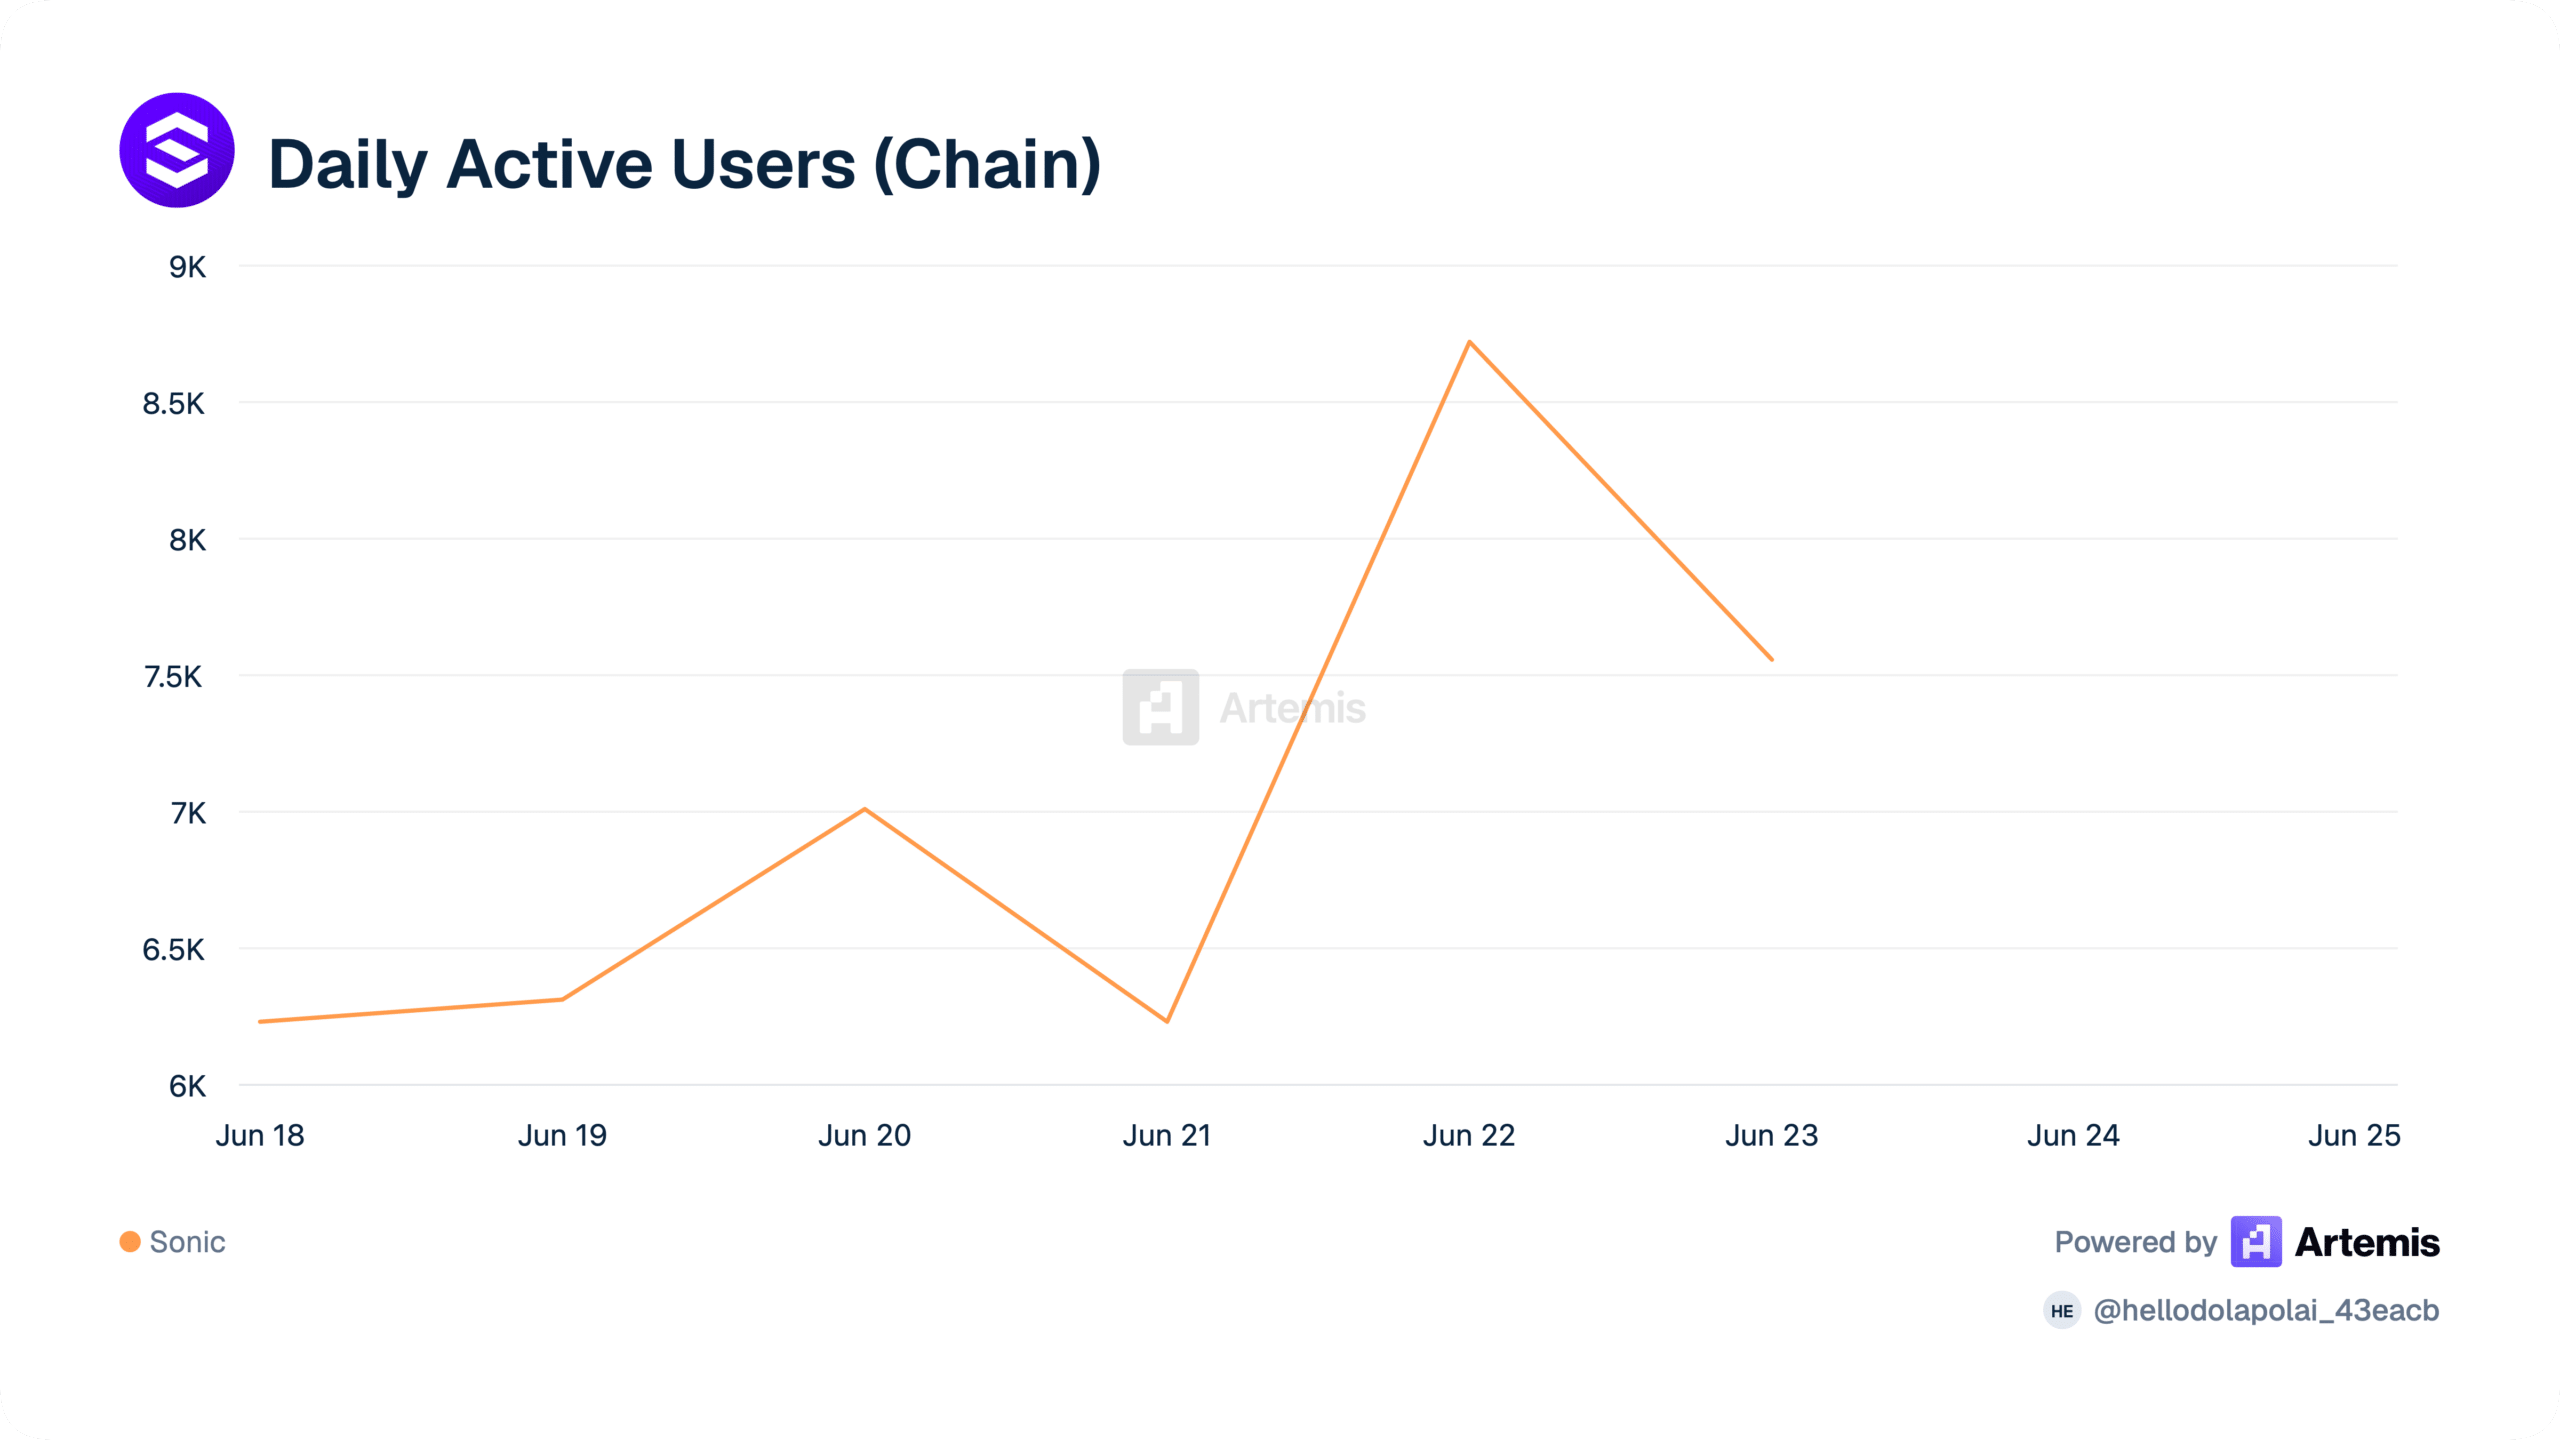
Source: Artemis

This kind of surge rarely happens in isolation and tends to pull broader chain activity higher with it. Sonic has followed that pattern closely with a matching jump in its transaction count.

Artemis data highlighted on-chain transactions at 228,000 too – A figure that underscores how active participants have remained across the network, despite the price weakness.

A build-up like this would normally signal price strength. And yet, the opposite may be playing out since S has dropped by 25% over the past 30 days. In fact, a closer look at the numbers might tie the recent rise in on-chain activity to selling, rather than to fresh demand.

Sonic’s on-chain activity is tracking outflows, not inflows

The uptick in on-chain activity can be correlated with capital leaving the network rather than flowing into it. This finding could reframe what the surge actually represents.

One of the clearest markers of this liquidity drain is total value locked (TVL). It declined over the very same period that users and transactions were climbing.

TVL measures how much capital sits deposited on a blockchain and often serves as a gauge of investor outlook, with inflows pointing to longer-term conviction and a greater willingness to hold, while outflows signal that short-term selling pressure could be building beneath the surface.
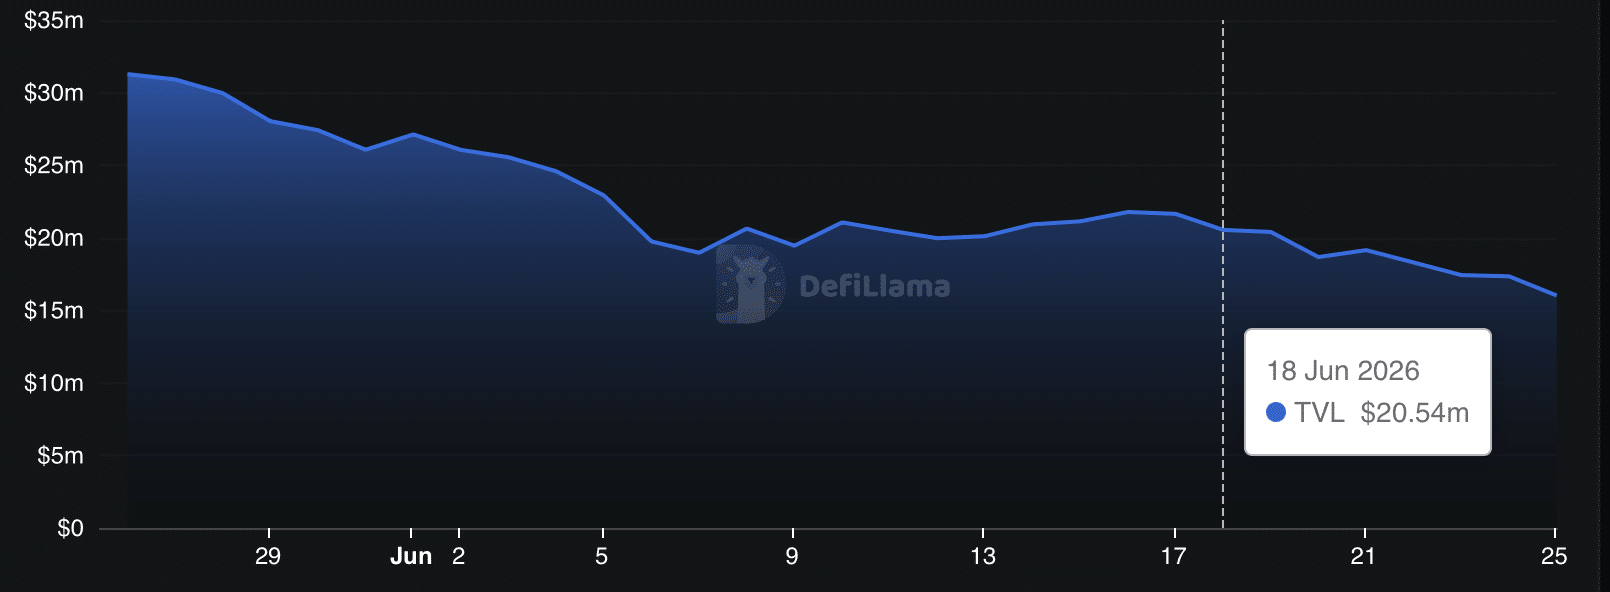
Source: DeFiLlama

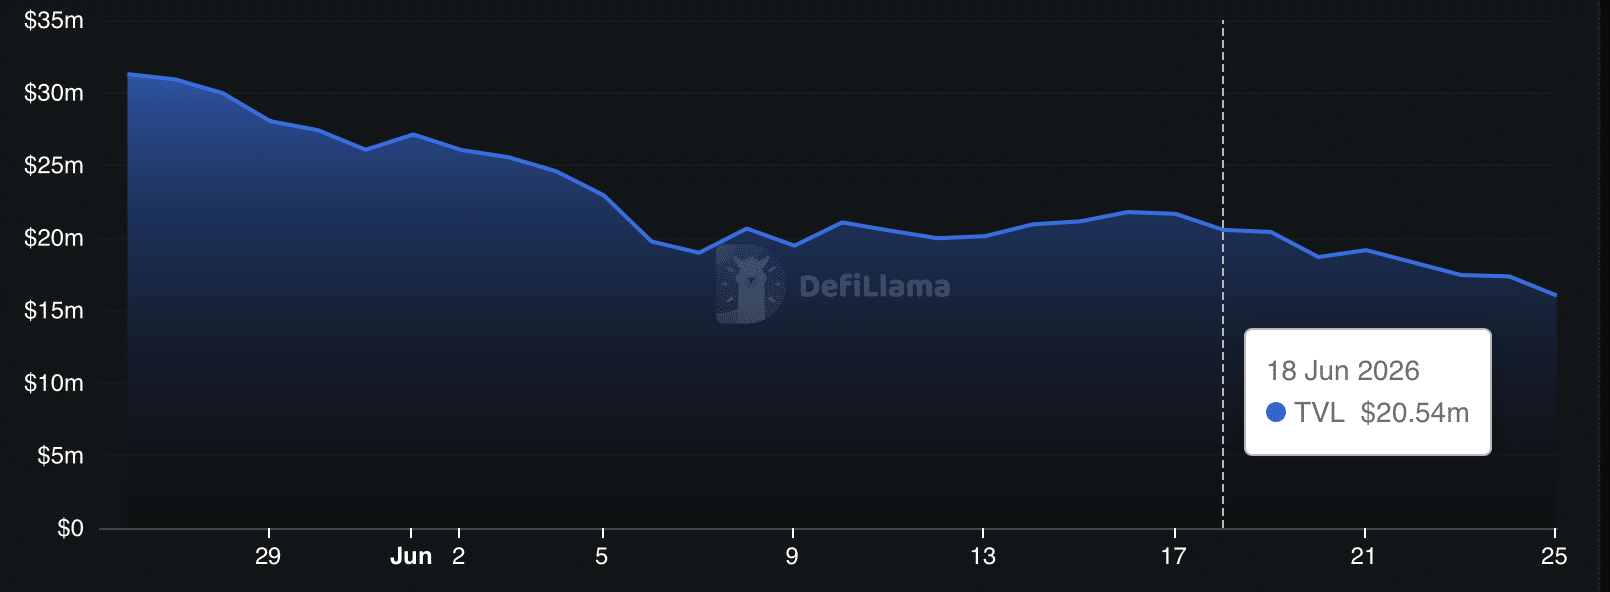
At the time of writing, $4.47 million had left Sonic’s TVL, dragging it down to roughly $16.07 million. This, even as decentralized exchange (DEX) volume pushed it in the other direction.

DeFiLlama data also highlighted DEX volume surging to $3.27 million—its second-highest reading of the month and third-highest since March—while Sonic’s own trading volume sat around 51% higher on the day at $26.8 million.

A hike in volume set against a falling price points to selling momentum holding the upper hand. Traders may be ready to keep pressing in that direction for as long as volume stays elevated at press time levels.

Are buyers holding back?

Activity in the spot market, by contrast, has stayed largely muted, with little meaningful buying or selling moving through it.

Spot netflows for the week has nonetheless leaned supportive and could allude to buyers quietly accumulating, carrying a net inflow of roughly $20,000 on total buys of about $231,000 across the week. However, any meaningful rebound from here would demand that buying scale up far more sharply.

For now, buying pressure remains too thin to fuel a sustained upward move in the near term.


Final Summary

  • Sonic’s DAUs rose 23% and transactions topped 228,000, but TVL saw outflows.
  • Positive spot netflow hinted at light accumulation, too thin to absorb the selling, leaving S exposed to more downside.


热门币种推荐

相关问答

QAccording to the article, what is the main reason Sonic (S) price dropped 12% and may continue to decline?

AThe price drop and potential for further decline are attributed to on-chain activity surging due to capital outflows (evidenced by a decrease in Total Value Locked) rather than new demand, indicating underlying selling pressure despite increased user numbers and transactions.

QWhat two key on-chain metrics for Sonic showed significant growth recently, and by how much did Daily Active Users increase?

AThe two key metrics were Daily Active Users (DAU) and the volume of chain transactions. Daily Active Users increased by approximately 22.6% week-over-week, climbing from 6,200 to 7,600.

QHow does the article interpret the relationship between Sonic's rising DEX/on-chain volume and its falling price?

AThe article interprets the rise in trading volume (including DEX volume hitting $3.27M) concurrent with a falling price as a signal that selling momentum is dominant, suggesting traders are actively selling rather than buying.

QWhat does the change in Sonic's Total Value Locked (TVL) indicate about investor behavior according to the analysis?

AThe decrease in Total Value Locked (TVL) by $4.47 million to around $16.07 million indicates capital is leaving the network, signaling a build-up of short-term selling pressure and a lack of longer-term holding conviction among investors.

QDoes the article suggest buying pressure is currently strong enough to reverse Sonic's price trend? Why or why not?

ANo, the article suggests buying pressure is not strong enough. While spot netflows showed a slight positive inflow ($20k on ~$231k buys), this accumulation is described as 'too thin to absorb the selling' and insufficient to fuel a sustained upward price move in the near term.

你可能也喜欢

解析稳定币真实使用场景与区域机会

本文基于对152亿美元已识别国家来源的链上稳定币转账数据分析,揭示了其真实使用场景与区域机会。关键发现如下: 1. **稳定币交易以“境内”为主**:在可识别交易量中,境内转账占比高达62.6%,规模达95亿美元。土耳其、韩国、墨西哥、印尼和美国是前五大市场,合计贡献近80%的境内交易量。这表明稳定币在本国市场内广泛用于支付、交易和美元储蓄,境内结算服务是当前更重要的市场。 2. **跨境资金呈现区域化流动**:包含境内转账,73%的交易量发生在发送方所在大洲内部。尤其在亚太地区,79.5%的资金留在了本区域。在跨境交易中,亚太区域内部流动依然显著,如台湾与印尼、印尼与韩国之间已形成规模可观的支付通道,为区域支付基础设施建设提供了明确需求基础。 3. **亚太地区是核心市场**:亚太地区发送和接收的交易量分别占全球的41.0%和42.1%,境内交易量占比41.6%。全球前15大跨境支付通道中,有9条涉及亚太市场,印尼在6条通道中出现。此外,亚太整体呈现稳定币净流入,印尼、新加坡和韩国是主要净流入地。 **结论**:对于机构而言,当前最值得关注的市场机会在于**为本国市场提供境内结算服务**,以及在**亚太地区构建跨境支付通道**(如台湾-印尼、印尼-韩国等)。亚太地区凭借最大的交易规模、高境内需求及资金净流入,已成为稳定币生态的核心区域。

marsbit1小时前

解析稳定币真实使用场景与区域机会

marsbit1小时前

交易

现货

热门文章

如何购买S

欢迎来到HTX.com!我们已经让购买Sonic(S)变得简单而便捷。跟随我们的逐步指南,放心开始您的加密货币之旅。第一步:创建您的HTX账户使用您的电子邮件、手机号码注册一个免费账户在HTX上。体验无忧的注册过程并解锁所有平台功能。立即注册第二步:前往买币页面,选择您的支付方式信用卡/借记卡购买:使用您的Visa或Mastercard即时购买Sonic(S)。余额购买:使用您HTX账户余额中的资金进行无缝交易。第三方购买:探索诸如Google Pay或Apple Pay等流行支付方法以增加便利性。C2C购买:在HTX平台上直接与其他用户交易。HTX场外交易台(OTC)购买:为大量交易者提供个性化服务和竞争性汇率。第三步:存储您的Sonic(S)购买完您的Sonic(S)后,将其存储在您的HTX账户钱包中。您也可以通过区块链转账将其发送到其他地方或者用于交易其他加密货币。第四步:交易Sonic(S)在HTX的现货市场轻松交易Sonic(S)。访问您的账户,选择您的交易对,执行您的交易,并实时监控。HTX为初学者和经验丰富的交易者提供了友好的用户体验。

3.6k人学过发布于 2025.01.15更新于 2026.08.06

如何购买S

相关讨论

欢迎来到HTX社区。在这里,您可以了解最新的平台发展动态并获得专业的市场意见。以下是用户对S(S)币价的意见。

活动图片