
Data shows Bitcoin is now approaching another retest of the realized price, will the bulls be able to blow through the resistance this time?
Bitcoin’s Recent Upwards Momentum Has Brought It Near Realized Price Again
As pointed out by an analyst in a CryptoQuant post, BTC has spent a total of 138 days under the realized price so far since the June of this year.
Before we look at the data for the Bitcoin realized price, it’s best if a basic understanding of the “realized cap” is attained first.
The realized cap is calculated by multiplying each coin in the circulating supply with the price at which the particular coin was last moved or sold at, and then taking the sum for the entire supply.
This is different from the usual market cap, which doesn’t weigh each coin separately like this, and simply multiplies the entire supply with the current BTC price.
Now, if the market cap is divided by the total number of coins in circulation, we obviously get back the BTC price. Much in the same way, a “realized price” can also be derived from the realized cap.
The significance of the realized price is that it’s the cost-basis of the average investor in the Bitcoin market. Here is a chart that shows how the normal price has compared with this one during the last six months:
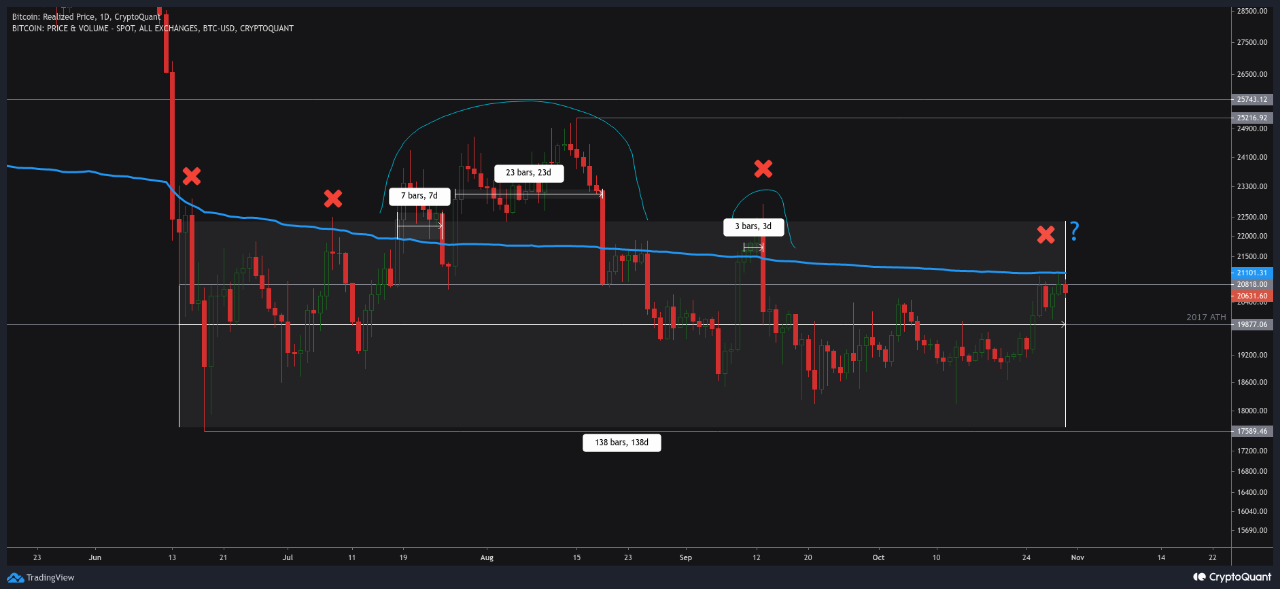
Looks like the two metrics have been approaching each other in recent days | Source: CryptoQuant
As you can see in the above graph, the Bitcoin price has been below the realized price during the last few months, but has recently started approaching it as a result of the bullish momentum.
Historically, the realized price has posed a resistance to the crypto’s value during bear market periods, keeping it trapped in the region below.
During 2015, BTC spent 300 days under this level, while during 2019 it remained in the zone for only 133 days.
So far in the current year, Bitcoin has found itself below the realized price for a total of 138 days, with a couple of exceptions. One of the instances of the opposite was the relief rally back in July-August, which helped the price stay in the zone above for almost a month.
The coin has failed to break this resistance several times already in the last six months, so it remains to be seen whether bulls can keep up the momentum this time and find some ground above the level or not.
Bitcoin Price
At the time of writing, Bitcoin’s price floats around $20.7k, up 7% in the last week.

The value of the crypto seems to have been stable above $20k recently | Source: BTCUSD on TradingView


